Top 3 price prediction BTC, ETH, XRP: Bitcoin falls into a well of shrinking volatility
- The collapse in the daily price range expands anxiety levels.
- Volatility tends to cluster, both expanding and contracting, making extreme situations possible.
- The market is in need of new price catalysts.

Starting the trading week, we assume that the market sees no signs of significant technical changes. The crypto market suffers when the price stagnates for a few days.
This new market is very emotional; it loves extreme rises and fears rapid falls. But when the price stagnates, it succumbs to the ostrich's strategy – closing its eyes to avoid the panic of not having a referent movement.
The current sharp drop in volatility is causing a slowdown in intraday trading and freezes medium and long-term flows, that are waiting for price action to hint at the direction of the next move.
ETH/BTC Daily Chart
The ETH/BTC cross is currently trading at the price level of 0.0198 and is mimicking the extreme lack of volatility seen in the Top 10 cryptos by capitalization.
My intuition warns me of possible bullish development in the next few days, but the pure TA cannot confirm this extreme.
Above the current price, the first resistance level is at 0.01982, then the second at 0.020 and the third one at 0.0205.
Below the current price, the first support level is at 0.019, then the second at 0.018 and the third one at 0.017.
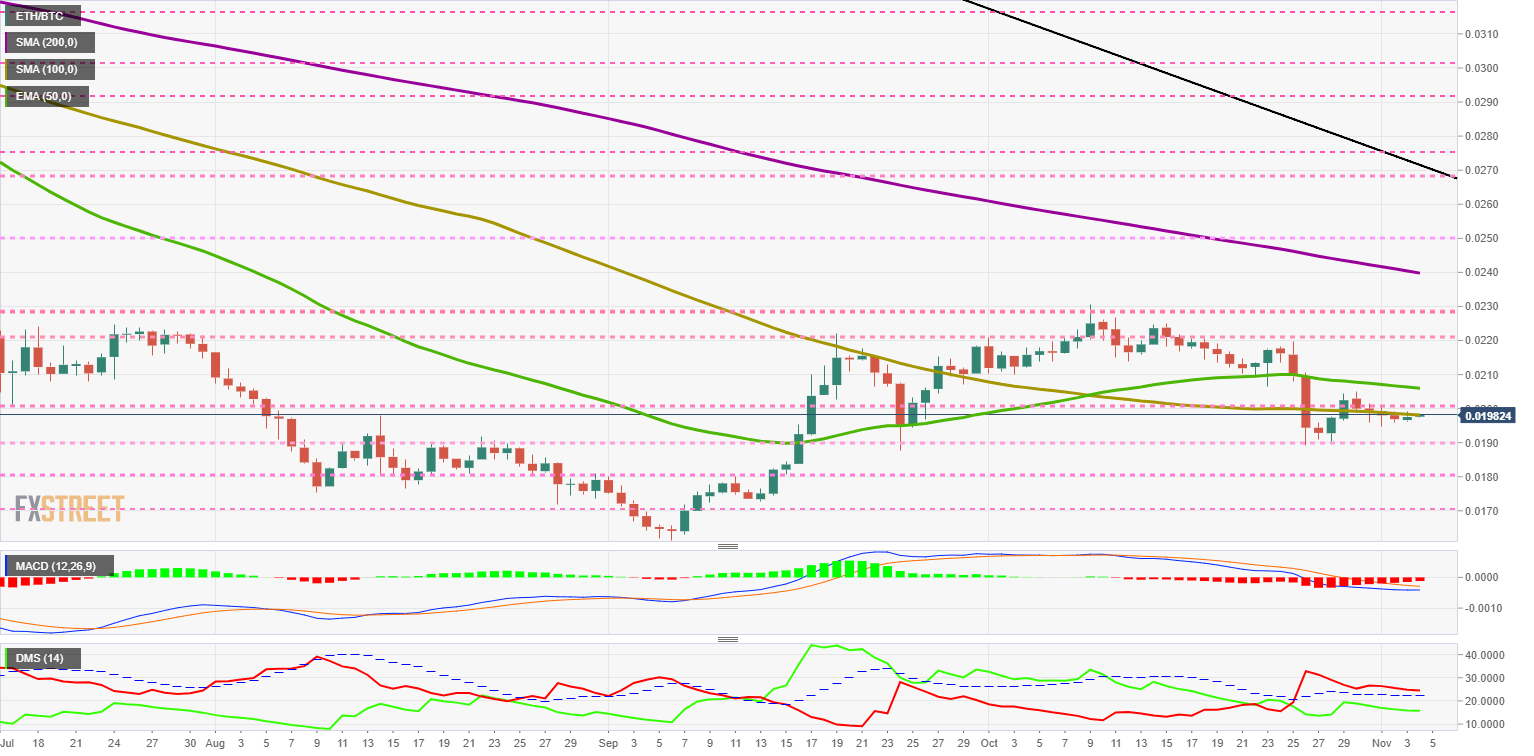
The MACD on the daily chart softens the bearish profile and flattens out completely. The future development is uncertain, although, in the ultra short term, the trend should continue with the bearish deceleration.
The DMI on the daily chart shows how bears lose strength as bulls lose strength. This move poses a risk for the bears to lose the support of the ADX line and with it, the current bearish dominance.
BTC/USD Daily Chart
BTC/USD is currently trading at $9,169.9, staying one more day in the narrow range of the last few days.
Bitcoin enjoys stable support levels, with two major moving averages and two price congestion supports in the first support zone.
Above the current price, the first resistance level is at $9,600, then the second at $10,600 and the third one at $11,300.
Below the current price, the first support level is at $9,150, then the second at $8,850 and the third one at $8,450.
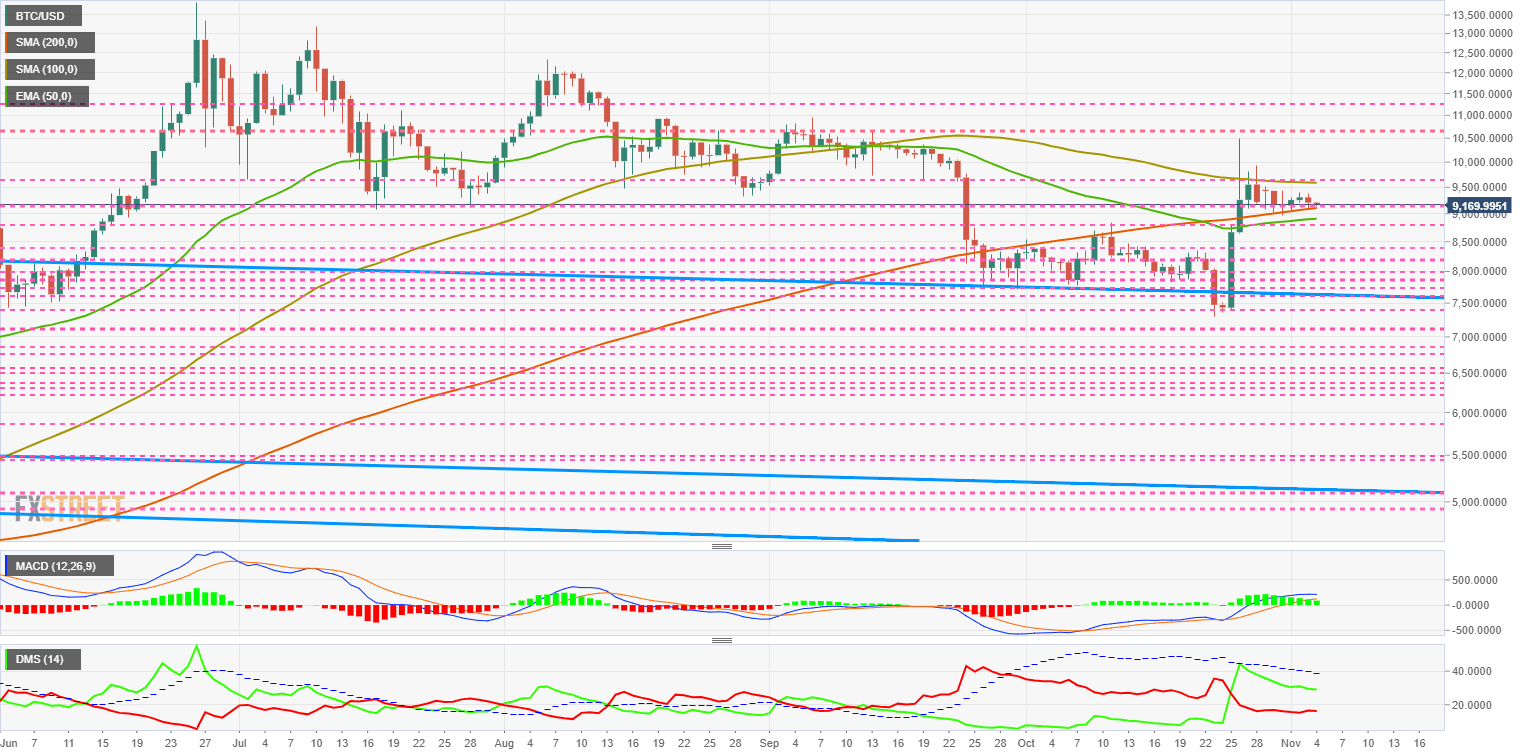
The MACD on the daily chart shows a bullish strength loss profile, but retaining a favorable substrate for the price in the medium term. Moving averages may come down for support and confirmation at the zero levels.
The DMI on the daily chart shows bulls dominating the money flow, but unable to move above the ADX line. Bears continue to show an indeterminate profile in the short term.
ETH/USD Daily Chart
ETH/USD currently trading at the $182.1 price level. It recovers the critical $180 technical support level but is just below the EMA50. The first level to yield will mark the development of the price in the short term.
Above the current price, the first resistance level is at $182, then the second at $190 and the third one at $195.
Below the acting price, the first support level is at $180 then the second at $170 and the third one at $160.
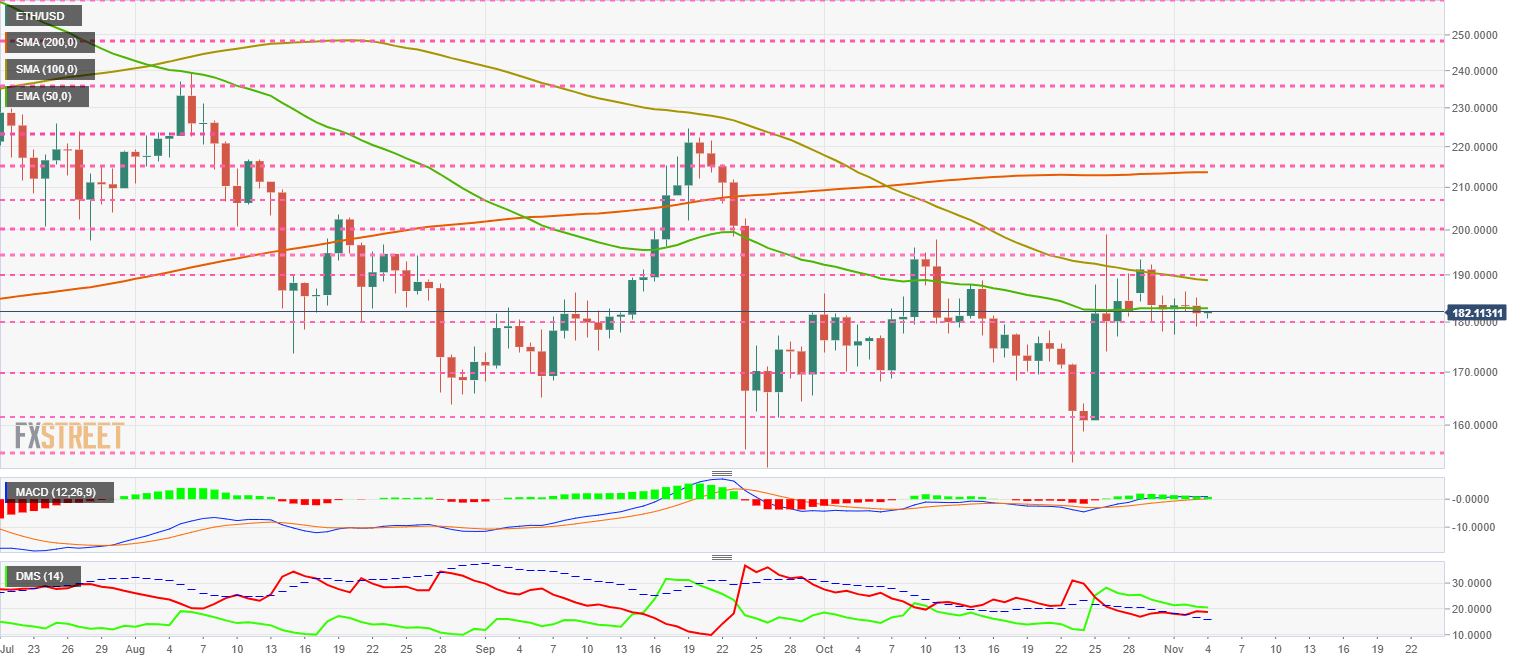
The MACD on the daily chart shows the total loss of incline and opening between lines. Moving averages remain above the zero lines, a situation that gives some bullish tone to the scenario.
The DMI on the daily chart shows both bulls leading by the slightest advantage over the bears.
XRP/USD Daily Chart
XRP/USD is currently trading at the $0.2911 price level and continues the mild decline that began last week. Strong supports are at $0.28, while the strong resistance level is at $0.325.
Above the current price, the first resistance level is at $0.294, then the second at $0.297 and the third one at $0.30.
Below the current price, the first support level is at $0.289, then the second at $0.285 and the third one at $0.282.
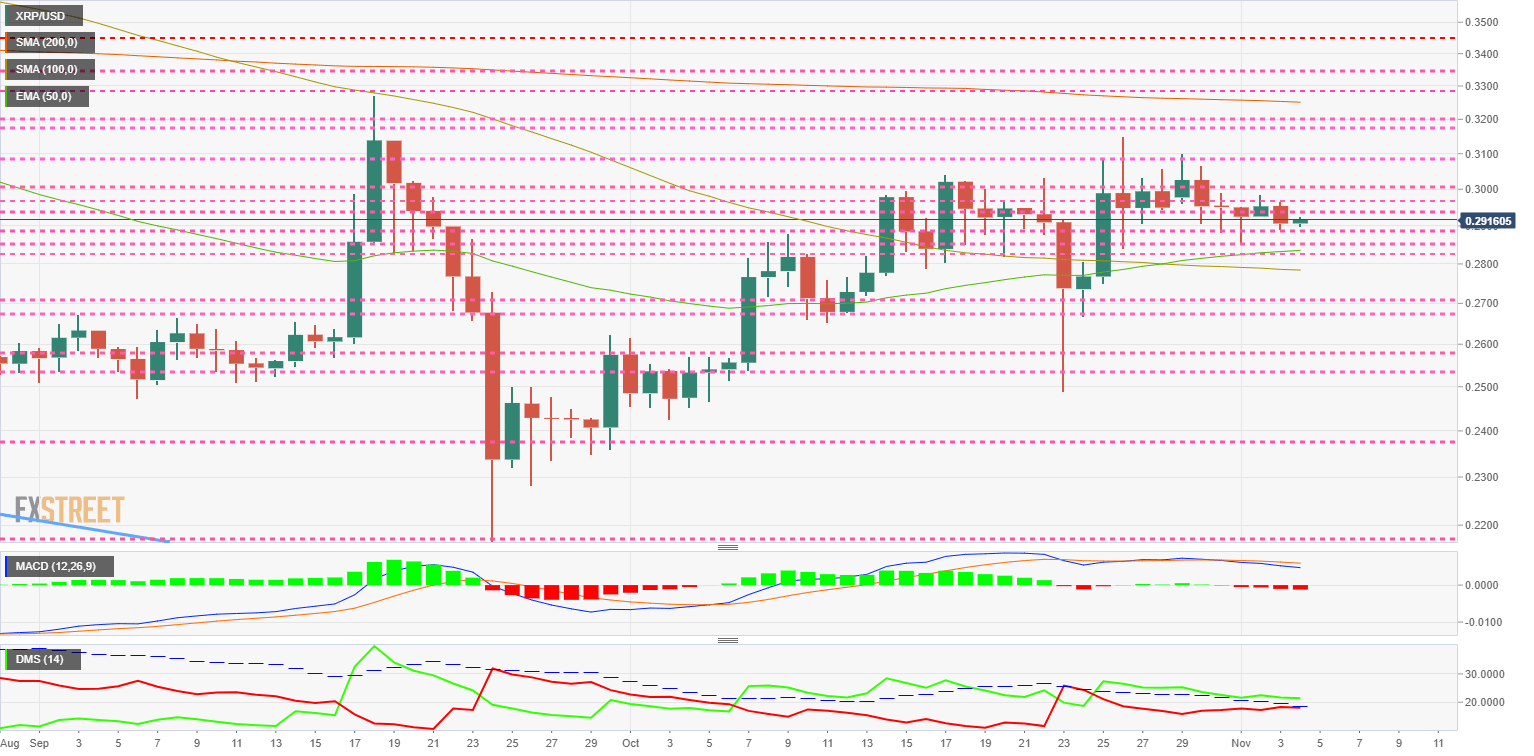
The MACD on the daily chart increases the bearish profile with a worsening in the slope of the averages. The indicator remains comfortably in the bullish zone, which would support a lateral bullish scenario.
The DMI on the daily chart shows how the bulls retain control of the XRP/USD pair. The bears tried to cross up the ADX line over the weekend but they fail and now pay for it.
Get 24/7 Crypto updates in our social media channels: Give us a follow at @FXSCrypto and our FXStreet Crypto Trading Telegram channel
Author

Tomas Salles
FXStreet
Tomàs Sallés was born in Barcelona in 1972, he is a certified technical analyst after having completing specialized courses in Spain and Switzerland. He expanded his technical training following the guidance of great experts on the financial markets.


