Top 3 Price Prediction Bitcoin, Ripple, Ethereum: Two steps away from the great LONG!
- Condition one: seeing BTC/USD conquer $8,300.
- Condition two: ETH/BTC above 0.0300.
- From there it's better to buckle up for a vertical takeoff.

Wednesday saw broad advances in the Crypto boar, with just one exception, Bitcoin. Once the King arrived at the frontier that separates the bearish market from the bullish one, at around $8,300, it was time for Altcoins to take the reins.
And what a moment! We witnessed double-digit rises among the majority of secondary actors, but above all, the spectacular bullish reaction of Ethereum. At the time of writing, Vitalik's creature trades at $265 after peaking at $270.
The market is waiting for two conditions to be met to raise the LONG flag.
The first condition is that BTC/USD exceeds $8,350 and consolidates this move.
The second condition is that the ETH/BTC crypto cross tops 0.0300 and consolidates it, taking advantage of the strength of Ethereum and as Bitcoin prolongs its pause.
ETH/BTC Daily Chart
The ETH/BTC cross is currently trading at 0.0327, after surging above the EMA50 and the SMA200 in the session. Through these achievements, it has also surpassed the baseline of the bullish parallel structure and got back into the game. Finally, it made a first attempt at the SMA100 at 0.0329, but this attempt ended in failure.
Above the current price, the first resistance level is at 0.030 (SMA100 and price congestion resistance), then the second resistance level is at 0.0342 (parallel bullish trend line). The third resistance level in the ETH/BTC pair is 0.035 (strong price congestion resistance).
Below the current price, the first support level is at 0.0324 (SMA200 and base parallel trendline), then the second support level is at 0.0316 (price congestion support). The third support level is at 0.0305 (EMA50 and price congestion support).
-636935942777930084.png)
The MACD on the daily chart shows a strong uptrend and a positive opening between the lines. The negative side is that for now, the indicator continues on the negative side and will have to go through the process of crossing into the positive zone. This crossing always brings complications.
The DMI on the daily chart shows the bulls shooting upwards while the bears lose a lot of strength but remain above the 20 levels. This setup is a risk for the bullish movement and could lead to sharp reversals.
BTC/USD Daily Chart
BTC/USD is currently trading at $8,037 after another failed evening attempt to breach the upper bearish parallel line.
Above the current price, the first level to beat is $8,300 (upper bearish parallel line), then the second resistance level is $8,420 (price congestion resistance). The third resistance level for the BTC/USD pair is at $8,790 (price congestion resistance).
Below the current price, the first support level is $8,000 (price congestion support), then the second support level is $7,870 (price congestion support). The third level of support for the BTC/USD pair is at $7,750 (price congestion support).
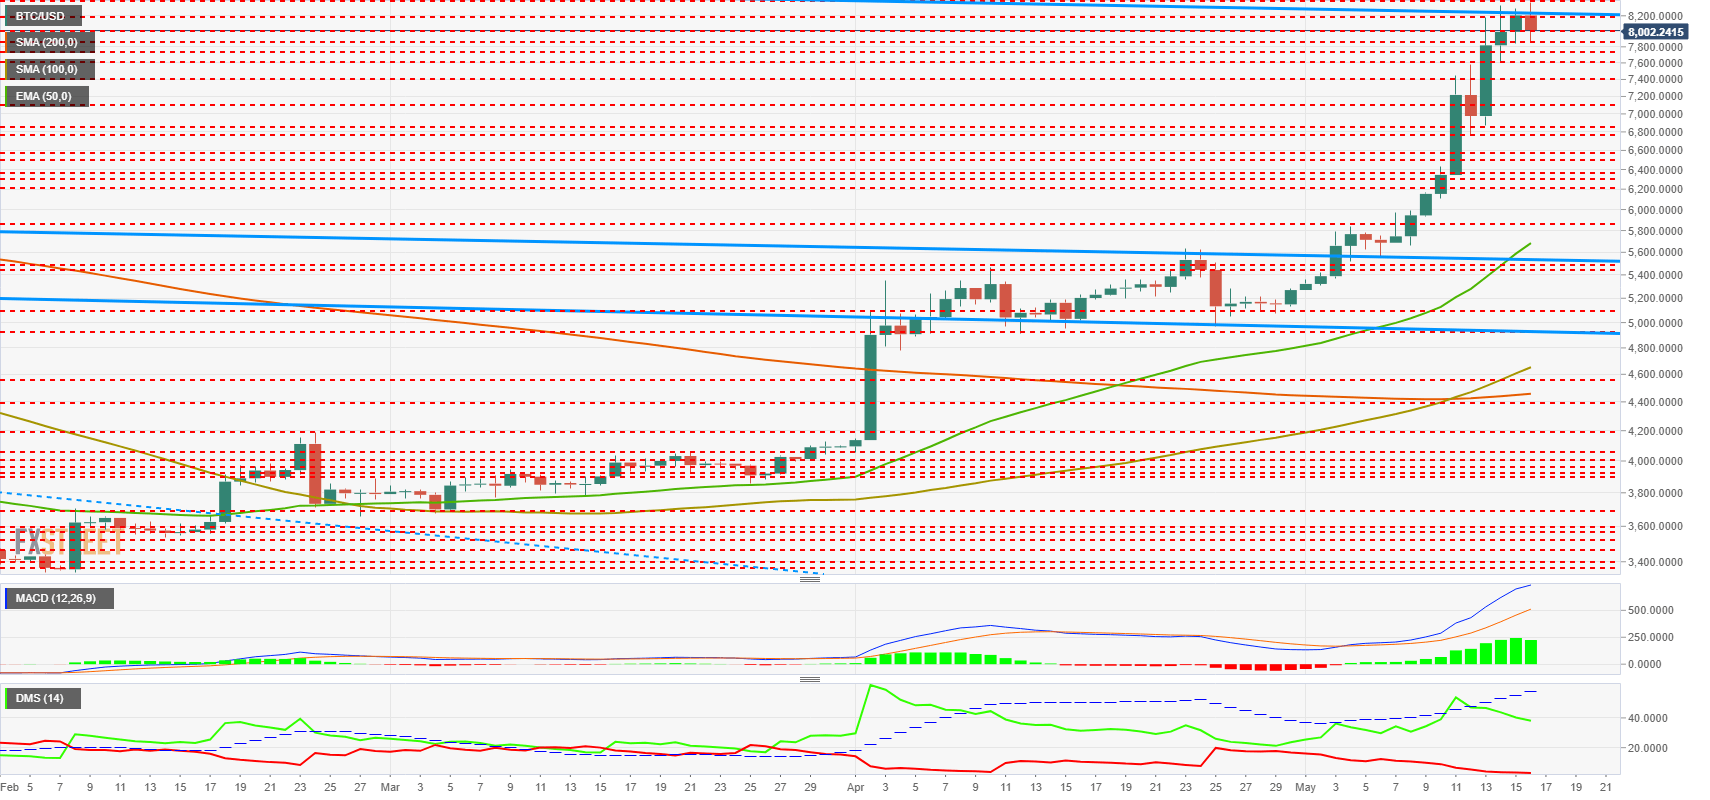
The MACD on the daily chart shows a somewhat developed bullish structure and is beginning to lose inclination, although it retains the full amplitude. The development will tend to decrease the distance between lines rather than lose inclination. Both patterns lead to price falls but as consolidation.
The DMI in the daily chart shows bears completely nullified while bulls firmly control the market. The bullish side of the market moves below the ADX line, but it moves at very high levels so that a test move could take the pair to new relative highs.
ETH/USD Daily Chart
ETH/USD is currently trading at $261 after peaking at $272.15. The improvement of Ethereum is crucial for the market in general, and this is seen in the behavior of the vast majority of Altcoins.
Above the current price, the first resistance level is at $290 (price congestion resistance), then the second resistance level is at $306 (price congestion resistance). The third resistance level for ETH/USD is at $320 (price congestion resistance).
Below the current price, the first support level is at $250 (price congestion support), then the second support level is at $238 (price congestion support). The third level of support for the ETH/USD pair is at $225 (price congestion support).
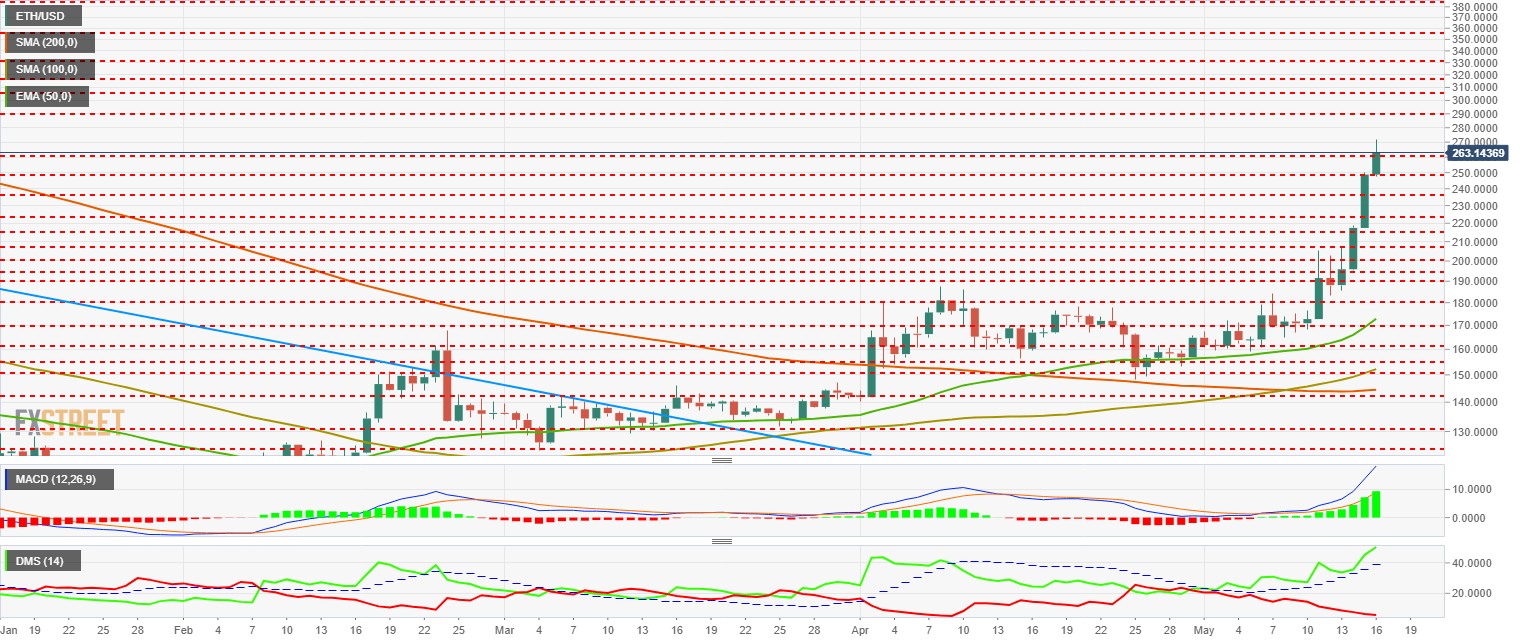
The MACD on the daily chart shows a powerful uptrend that does not show signs of losing momentum, although it is such a positive extreme that there may be some quick, squeeze type corrections.
The DMI on the daily chart conveys a situation similar to what we see on the MACD. Bulls rule with a lot of authority and stay above the ADX line so they can continue to evolve upwards with ease. The bears are at minimum levels, so there may be some bearish movement of reaction to the extremes, but it should not go beyond a small technical correction.
XRP/USD Daily Chart
The XRP/USD is currently trading at $0.443, after leaving a relative high of $0.471.
Above the current price, the first resistance level is $0.47 (price congestion resistance), then the second resistance level is $0.505 (price congestion resistance). The third resistance level for the XRP/USD pair is $0.52 (price congestion resistance). The intermediate target for the XRP is $0.55 as exceeding this price level would return it to a very bullish scenario with goals above the dollar unit.
Below the current price, the first support level is $0.440 (price congestion support), then the second support is $0.43 (price congestion support). The third one is XRP/USD pair is $0.417 (price congestion support).
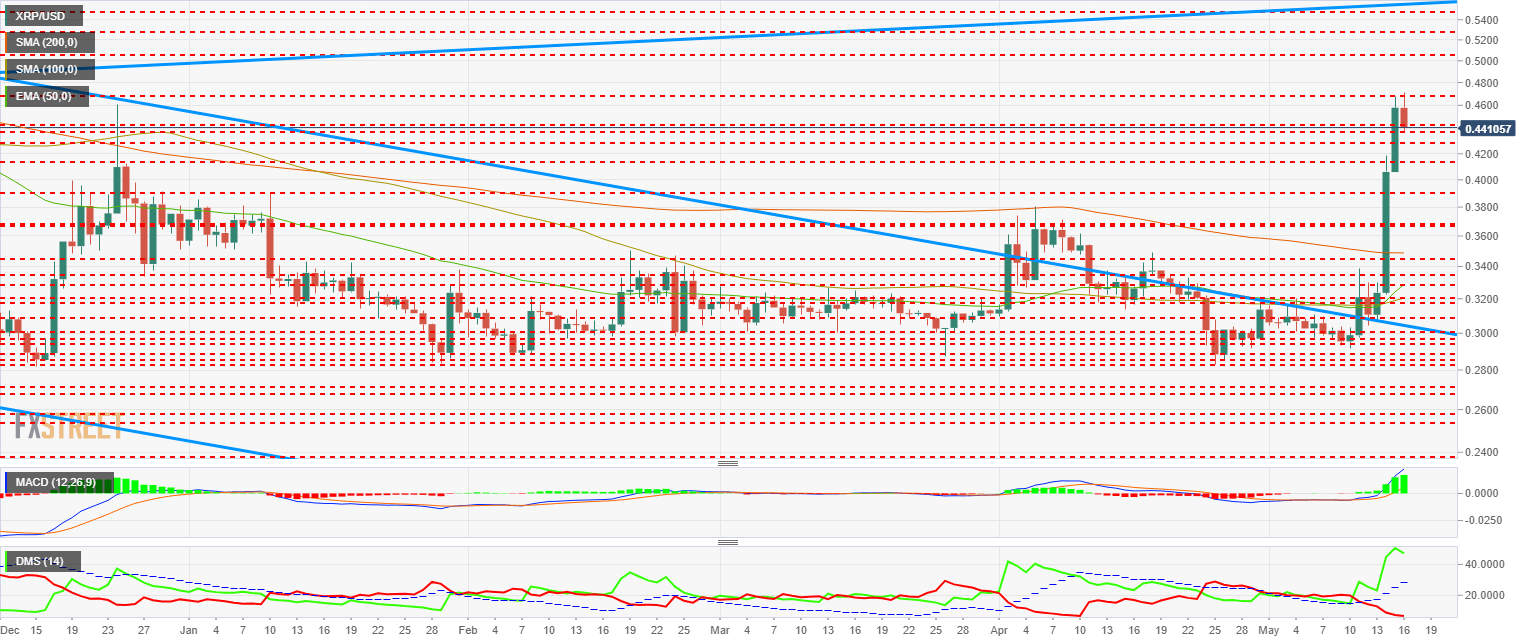
The MACD on the daily chart shows a strong bullish inclination and a significant openness to the upside. It is still a growing structure, so it is likely that the rises will continue in the XRP.
The DMI on the daily chart shows bulls firmly controlling the market while bears sink to minimum levels. This setup is also a growing structure so the XRP may do very well in the coming days.
Get 24/7 Crypto updates in our social media channels: Give us a follow at @FXSCrypto and our FXStreet Crypto Trading Telegram channel
Author

Tomas Salles
FXStreet
Tomàs Sallés was born in Barcelona in 1972, he is a certified technical analyst after having completing specialized courses in Spain and Switzerland. He expanded his technical training following the guidance of great experts on the financial markets.


