Top 3 Price Prediction Bitcoin, Ripple, Ethereum: The levels to watch after the massive bullish weekend rally – Confluence Detector
- Cryptocurrencies have shot higher over the weekend as more money pours in.
- Bitcoin jumped by around $1,000 and the others also pushed higher.
- Here are the levels to watch according to the Confluence Detector.

The Tether scandal may belong to the past, at least according to recent price action. Digital coins are not constrained by opening and closing times of stock markets and are on the rise while investors in shares try to grapple with the recent downfall.
Yet like with share prices, the movements in cryptos are not a one-way street and we may see corrections before the next moves higher. What levels should we watch?
This is what the Crypto Confluence Detector shows in its latest update:
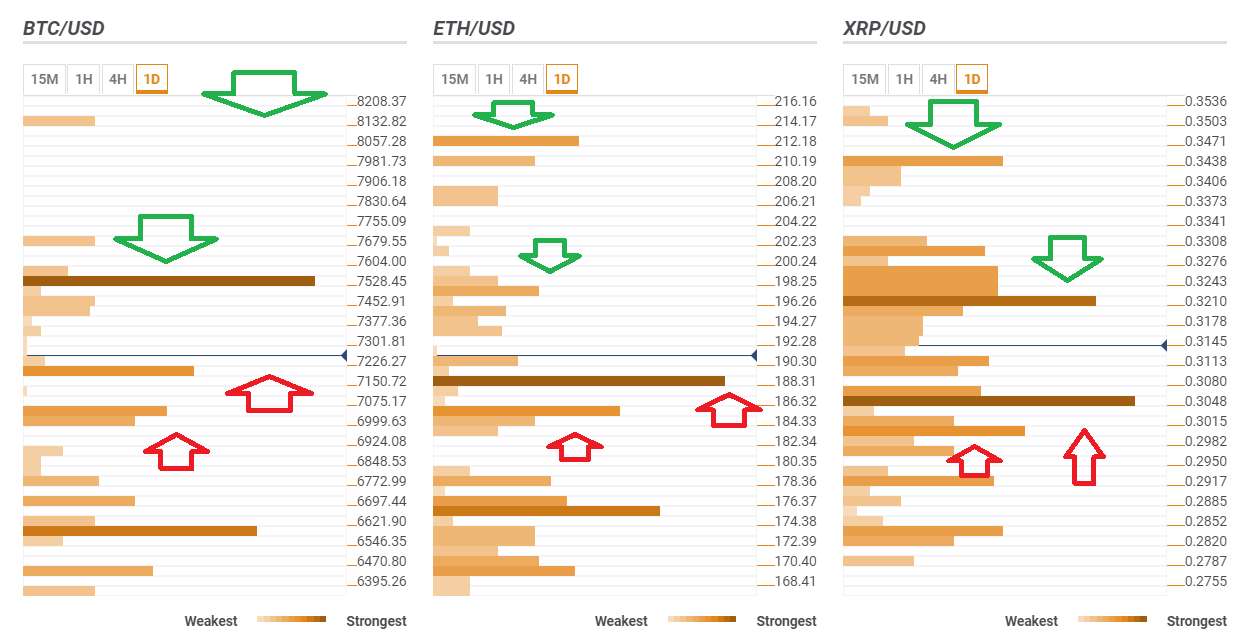
BTC/USD has one more hurdle before $8,000
Bitcoin, the top digital asset, faces fierce resistance at $7,528 which is the convergence of the Pivot Point one-month Resistance 3, the Bollinger Band 1h-Upper, and the Pivot Point one-week Resistance 3.
If it surpasses this hurdle, the next target is already at $8,132 which is s the Pivot Point one-day Resistance 2.
BTC/USD enjoys support at $7,188 which is the confluence of the previous 4h-Low, the Simple Moving Average 5-4h, the BB 1h-Middle, and the Fibonacci 23.6% one-day.
The next cushion is at $7,033 where we see the Fibonacci 38.2% one-day meet the PP one-week R2.
ETH/USD is above strong support
Ethereum, Vitalik Buterin's baby, has also risen, eyeing $200. It now enjoys substantial support at $188 where last month high, the PP 1m-R1, and the BB 1h-Lower converge.
Further support is quite close. At $185, the king of altcoins enjoys the juncture of the SMA 200-15m, the SMA 50-1h, the PP 1w-R1, and the Fibonacci 61.8% one-day.
ETH/USD has its eyes on $197 as the first upside target. The area includes the BB 15min-Middle, the PP 1w-R2, and the Fibonacci 23.6% one-day.
Further up, it targets $212, the PP 1m-R2.
XRP/USD finally recovers
Ripple, the eternal laggard, also managed to move higher and now hovers above $0.3050 which is a dense cluster of lines including the SMA 5-1d, the SMA 100-4h, the Fibonacci 61.8% one-week, the SMA 5-4h, the SMA 10-1d, and more.
That line is closely followed by the round level of $0.3030 which is where the Fibonacci 38.2% one-week and the PP 1d-S1 converge.
Resistance awaits at $0.3210, a veteran cap. The minefield includes the SMA 501-d, the SMA 5-1h, the Fibonacci 61.8% one-month, the SMA 50-15m, the BB 15m-Middle, the SMA 100-15m, and many more.
Further up, XRP/USD can target $0.3438 where the Fibonacci 38.2% one-month and the PP 1d-R1 meet.
Author

Yohay Elam
FXStreet
Yohay is in Forex since 2008 when he founded Forex Crunch, a blog crafted in his free time that turned into a fully-fledged currency website later sold to Finixio.


