Top 3 Price Prediction Bitcoin, Ripple, Ethereum: The charts show a worrying picture, don't be fooled by this stability
- Cryptocurrencies are still looking weak.
- The slightly lower volatility hides a worsening technical picture.

Cryptocurrencies look relatively stable after the recent crash seen on November 24th. What is the next direction?
The Confluence Indicator helps us answer the question, and the answer will not please the bulls.
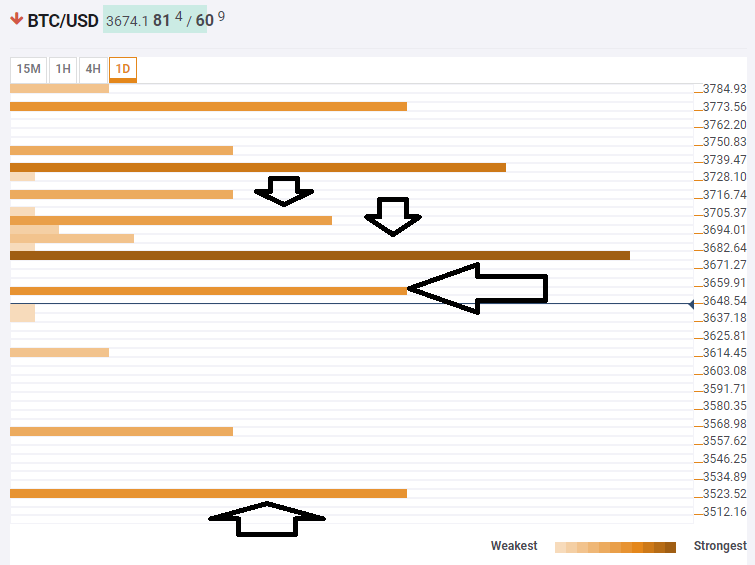
Bitcoin dropped below $3,675, and this could prove critical. The line is the convergence of the potent Pivot Point one-month Support 1 and the Bollinger Band 15min-Middle.
Some support awaits at $3,655 which is the Fibonacci 23.6% one-day, but if this is lost, the road is open to $3,523 which was yesterday's low. The last line is the 14-month trough of $3,456.
Looking up, resistance awaits at $3,700 where we see a cluster including the Simple Moving Average 50-15m, the previous hourly low, the Bollinger Band 1h-Middle, and the SMA 10-1h.
See the Crypto Confluences Indicator live
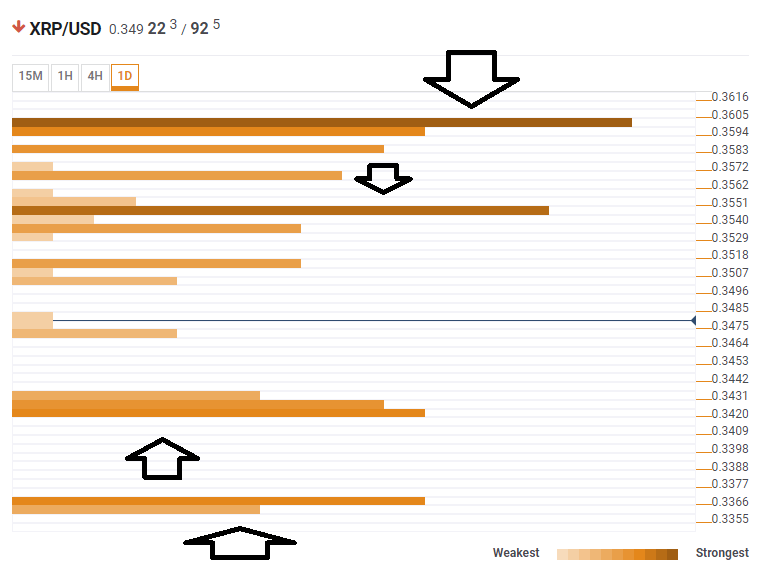
Ripple also lost support, albeit at higher levels. At $0.3540 we find the Fibonacci 23.6% one-day, the Bollinger Band 15m-Upper, the SMA 10-1h, the SMA 50-15m, and the previous hourly high.
Support awaits only at $0.3420 which is yesterday's low and the previous 4h high, not such strong lines.
Further down, we see the Pivot Point one-day S1 at $0.3066.
In the case of Ripple making a comeback, it will find a cluster of resistance at $0.3600 with the Pivot Point one-month Support 1, the previous 4h-high, and the SMA 5-4h.
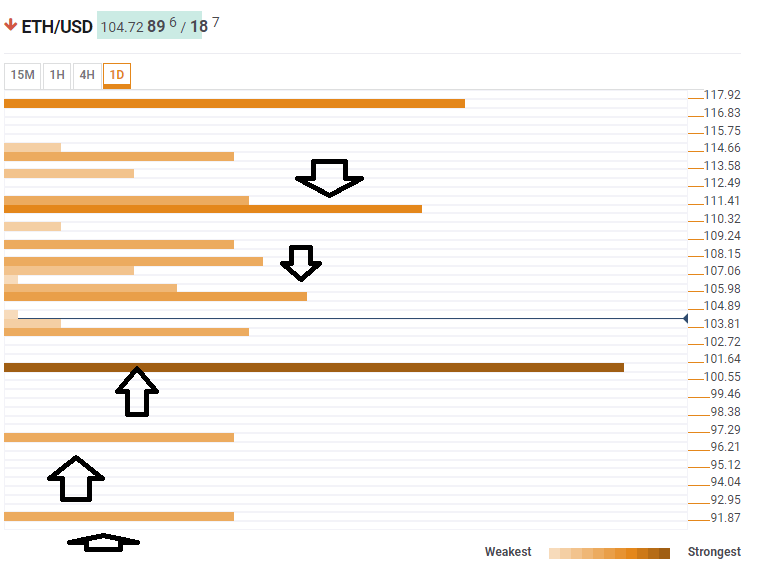
Ethereum a slightly better environment with support at $101. Here we see the confluence of the PP 1m-S1, the previous 4h low and the BB 4h-Lower.
Below, weak support awaits at $96.56 which is the Pivot Point one-day S2 and then at $91.87 which is the BB one-day Lower.
On the upside, resistance awaits at $105.50 where we see yesterday's low, the BB 15m-Middle, and the SMA 5-1h. Above $111 is the meeting point of the Fibonacci 38.2% one-day, the SMA 200-15m, the SMA 50-1h, and the SMA 10-4h.
Author

Yohay Elam
FXStreet
Yohay is in Forex since 2008 when he founded Forex Crunch, a blog crafted in his free time that turned into a fully-fledged currency website later sold to Finixio.


