Top 3 Price Prediction Bitcoin, Ripple, Ethereum: Cryptos sinking in the quicksand with the BTC/USD’s worst estimate at $5,500
- The worst case scenario only represents a return to the SMA200.
- This is the natural environment of this market.
- Good buying opportunities open up in front of us.

It is mid-morning in Europe that has received the legacy of the last failed attempt by BTC/USD to surpass the $8,750 mark.
King Bitcoin's immediate reaction has been a drop of more than 10% and technically more important, it has lost the support of the long-term bearish channel.
Red is the dominant color on the screens, with ETH/BTC being the interesting exception – it wears a discreet green.
The arrival of sellers to the crypto market does not seem to respond to any external event, beyond the calls to regulate the sector on behalf of a transnational authority.
The fall originates in price action. After the increases seen since December’s lows, the indicators have been showing signs of exhaustion for days.
The magnitude of the fall is uncertain at the moment. This uncertainty is due to the considerable rise seen in previous months leaving the most significant moving averages far behind.
There are several scenarios in play right now. If the falls bring a significant increase in volatility, the process will be quite fast and could be completed before the end of the current month. If volatility remains at current levels, the process can extend for longer, perhaps until the end of the summer.
ETH/BTC 4 Hours Chart
ETH/BTC is currently trading at 0.03106 and is aiming for a significant gain at the close. This development is positive and provides hope for those who intend to increase their position against Bitcoin. The few next days will be enlightening and can help set a long-term scenario for cryptos.
Above the current price, the first level of resistance is the most solid one. It is formed by the confluence between 0.0311 and 0.0316 (EMA50, SMA100, price congestion resistance, and upper parallel trend line). Above this first hurdle, the situation seems easier with the second resistance level awaiting between 0.0334 and 0.0337 (price congestion resistance and second upper parallel bullish line). The third resistance level for ETH/BTC is at 0.035 (price congestion resistance and third parallel upper bullish line).
Below the current price, the first support level is at 0.030 (price congestion support and SMA200). The second support level is at 0.0298 (price congestion support). The third support level for ETH/BTC is at 0.0276 (price congestion support).
-636952407225831548.png)
The MACD on the 4-hour chart shows a very flat profile. It moves just below the equilibrium level, which is an added difficulty. If we increase the zoom of the chart, we see how the indicator has crossed upwards — good news for the market.
The DMI on the 4-hour chart shows bears dominating the market but with little advantage over bulls. Both sides of the market are moving above the ADX line, so they will have no opposition if they choose to increase trend strength.
BTC/USD Daily Chart
BTC/USD is trading at $7,893 after dropping below the session low of $7,750.
King Bitcoin loses the support of the upper parallel line of the long term bearish channel and falls back in. A radical change of scenario, much more harmful and which could – in an extreme case – take the BTC/USD pair as low as $5,500 (the base of the long term bearish channel).
Below the current price, the first support level is $7,745 (price congestion support), then the second support level is $7,400 (price congestion support). The third level of support for BTC/USD is at $7,100 (price congestion support and EMA50).
Above the current price, the first resistance level is at $8,000 (price congestion resistance), then at $8,200 (long term bear channel ceiling and price congestion resistance). The third resistance level for BTC/USD is $8,400 (price congestion resistance).
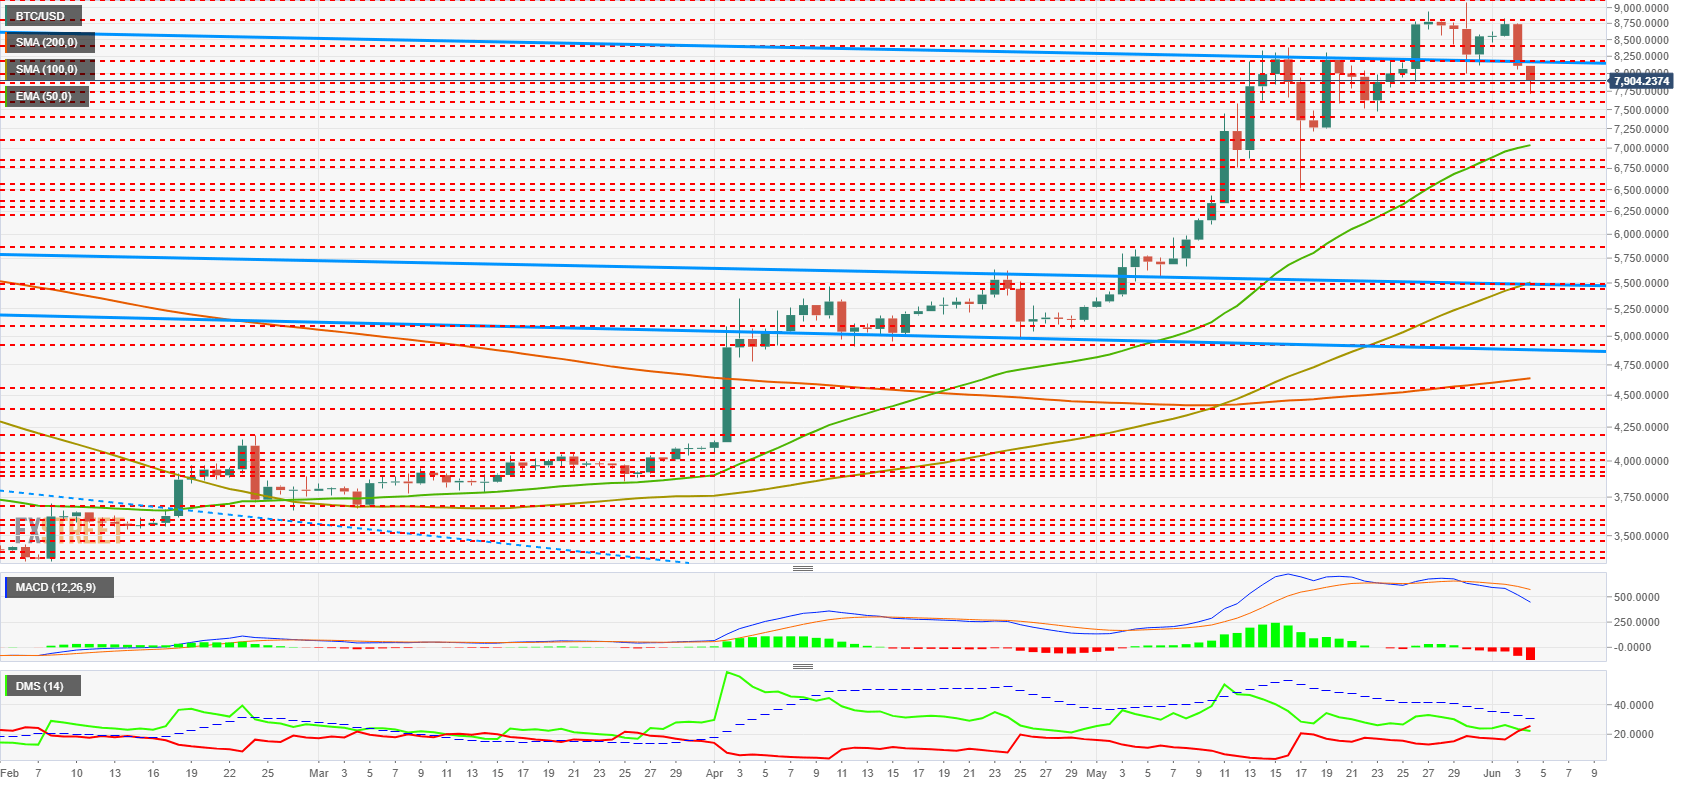
The MACD on the daily chart shows how the bearish cross accelerates, inclines, and opens between the lines. The positive aspect is that with this acceleration, the time needed to close the bearish cycle would shorten considerably.
The DMI on the daily chart shows how bears outnumber bulls. Both are below the ADX, which can hinder the process and increase volatility.
ETH/USD Daily Chart
ETH/USD is currently trading at $246 after dropping the session low to $235 (price congestion support).
Below the current price, the second level of support is at $225 (price congestion support), so the third level of support for ETH/USD is at $215 (price congestion support and EMA50).
Above the current price, the first resistance level is at $250 (price congestion resistance), then the second resistance level is at $260 (price congestion resistance). The third resistance level for ETH/USD is at $290 (price congestion resistance).
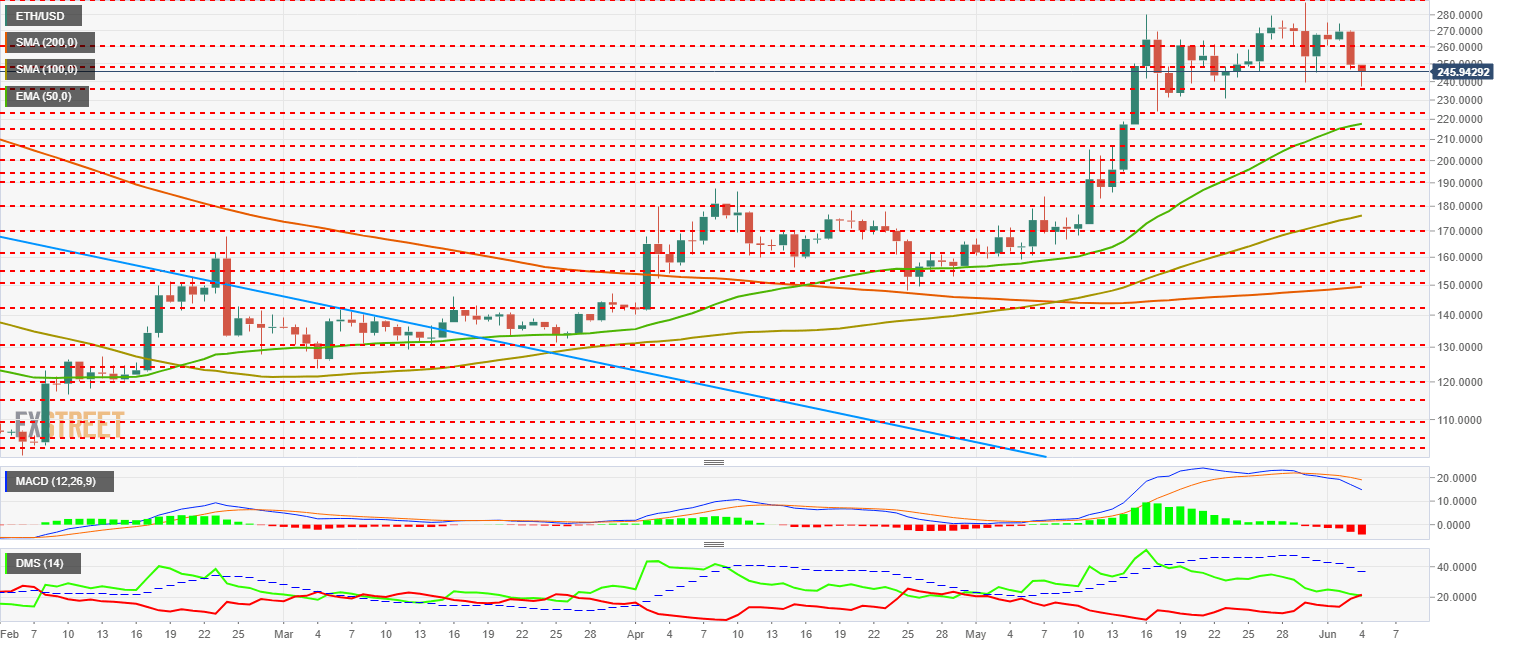
The MACD on the daily chart shows a lower bearish cut with less inclination and opening than BTC/USD. It is a less bearish structure but may change at any time.
The DMI on the daily chart shows an absolute tie between both sides of the market. Bears are more likely to win as their trend is bullish, just the opposite of bulls.
XRP/USD Daily Chart
XRP/USD is currently trading at the $0.411 price level after dropping the day's low to $0.395.
Below the current price, the first support level is $0.39 (price congestion support), then the second support level is $0.37 (price congestion support and EMA50). The third level of support for XRP/USD is $0.345 (SMA200, SMA100, and price congestion support).
Above the current price, the first resistance level is $0.43 (price congestion resistance), then the second resistance level is $0.44 (double price congestion resistance). The third resistance level for XRP/USD is $.047 (price congestion resistance).
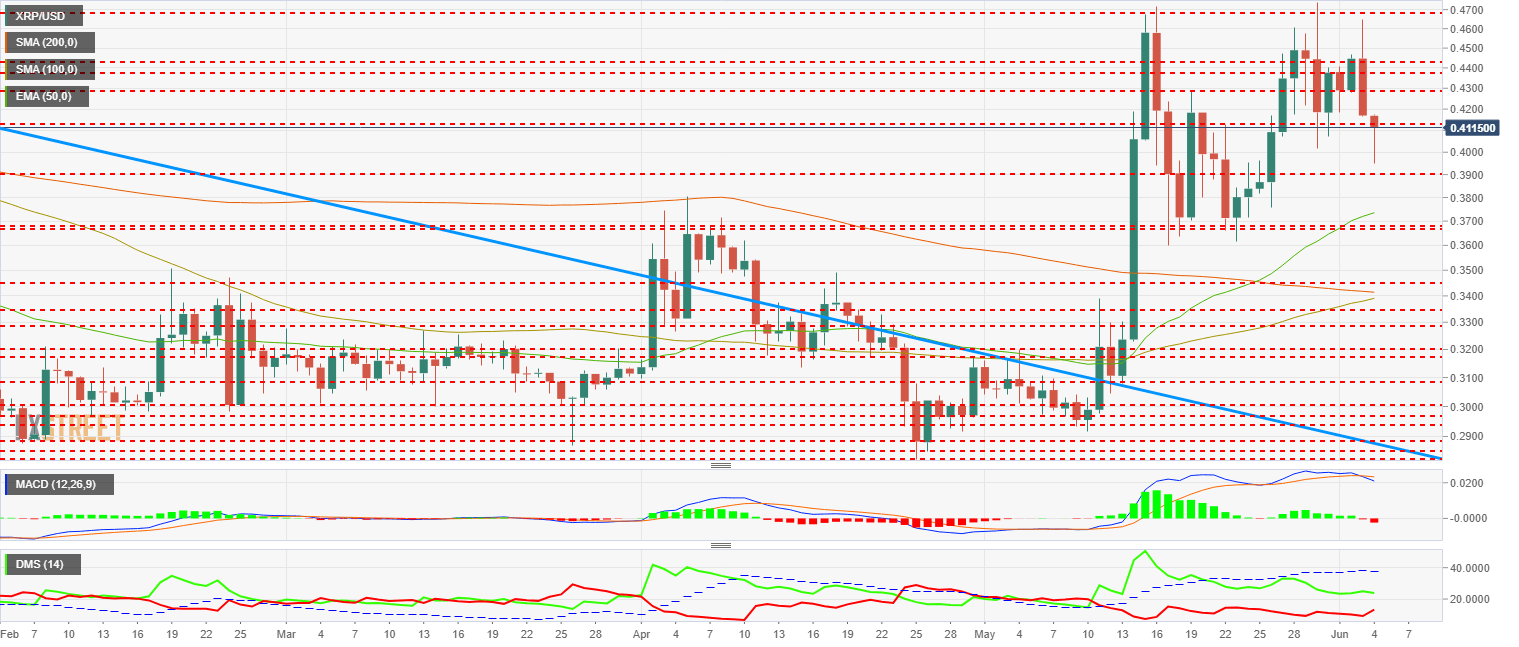
The MACD on the daily chart shows a bearish cross at an early stage. The slope of the fast average opens the door to a bearish acceleration in the coming days.
The DMI on the daily chart shows bulls leading the market with an advantage over bears. The sellers – who were at minimum levels on Monday – are moving quickly upwards today.
Get 24/7 Crypto updates in our social media channels: Give us a follow at @FXSCrypto and our FXStreet Crypto Trading Telegram channel
Author

Tomas Salles
FXStreet
Tomàs Sallés was born in Barcelona in 1972, he is a certified technical analyst after having completing specialized courses in Spain and Switzerland. He expanded his technical training following the guidance of great experts on the financial markets.


