Top 3 Price Prediction Bitcoin, Ripple, Ethereum: Bitcoin signs up for Dragsters' races - Historical highs on target
- The upside potential for BTC is still impressive, impossible to set goals.
- Bitcoin eclipses Ethereum, which waits for its moment to attract the spotlight.
- XRP claims faith in the lack of harmony with the bull market.

A new crypto trading day dawns in Europe with a great headline once Bitcoin has just left the relative high at $13,000.
It starts to be usual to wake up with positive news about the Crypto industry. A few days ago the story was Libra; today is the concession of an exchange license and clearing of derivatives on Bitcoin futures to LedgerX Ltc.
When a market re-attains a high so quickly, one could argue the prior high was not a bubble after all.
ETH/BTC Daily Chart
ETH/BTC, the pair that most reliably reports the health status of the Alt segment is approaching unseen levels since early 2017. Last May the minimum was 0.025, from where it shot up in a move that helped launch Bitcoin into space.
Technically it is remarkable the possible formation of a triple floor in the current price zone. The confirmation of this technical event would be significant as it would indicate an accumulation zone where portfolios could rotate massively towards the most backward assets in the current bull market.
Above the current price, the first resistance level is at 0.0268 (price congestion resistance), then the second at 0.0275 (price congestion resistance) and the third one at 0.0291 (price congestion resistance).
Below the current price, the first support level is at 0.025 (price congestion support and relative minimum), then the second is at 0.0229 (price congestion support) and the third one at 0.022 (price congestion support).
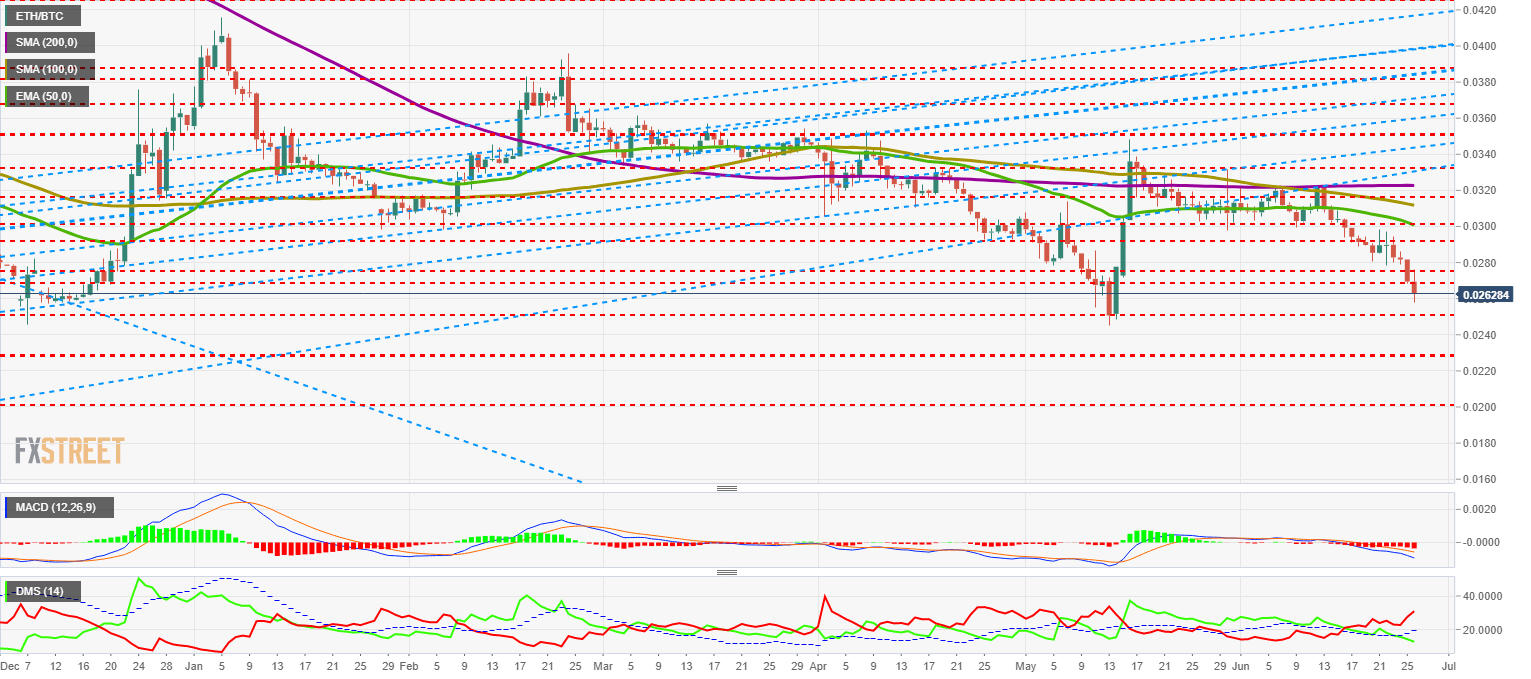
The MACD on the daily chart shows a bearish profile but does not reflect the current levels of tension in the exchange between Ethereums and Bitcoins. The bearish trend may continue over time.
The DMI on the daily chart shows a worrying profile, with bears dominating and even increasing dominance. The bulls, on the other hand, sink and complicate their existence by getting clearly under the ADX. The pattern indicates that falls can continue for weeks.
BTC/USD Daily Chart
BTC/USD continues to show the world that what happened at the end of 2017 was not unique and unrepeatable, but is part of the nature of Bitcoin itself and can be improved.
BTC/USD has taken only 14 days to move from $8,000 to $13,000 and no one escapes the fact that historical highs will be surpassed much sooner than anyone could have expected.
Above the current price, the first resistance level is at $14,000 (price congestion resistance), then the second at $17,090 (price congestion resistance) and the third one at $19,800 (historic high close). Above this price level, the BTC/USD pair will go up freely.
Below the current price, the first support level is at $11,280 (price congestion support), then the second at $10,650 (price congestion support) and the third one at $9,600 (price congestion support).
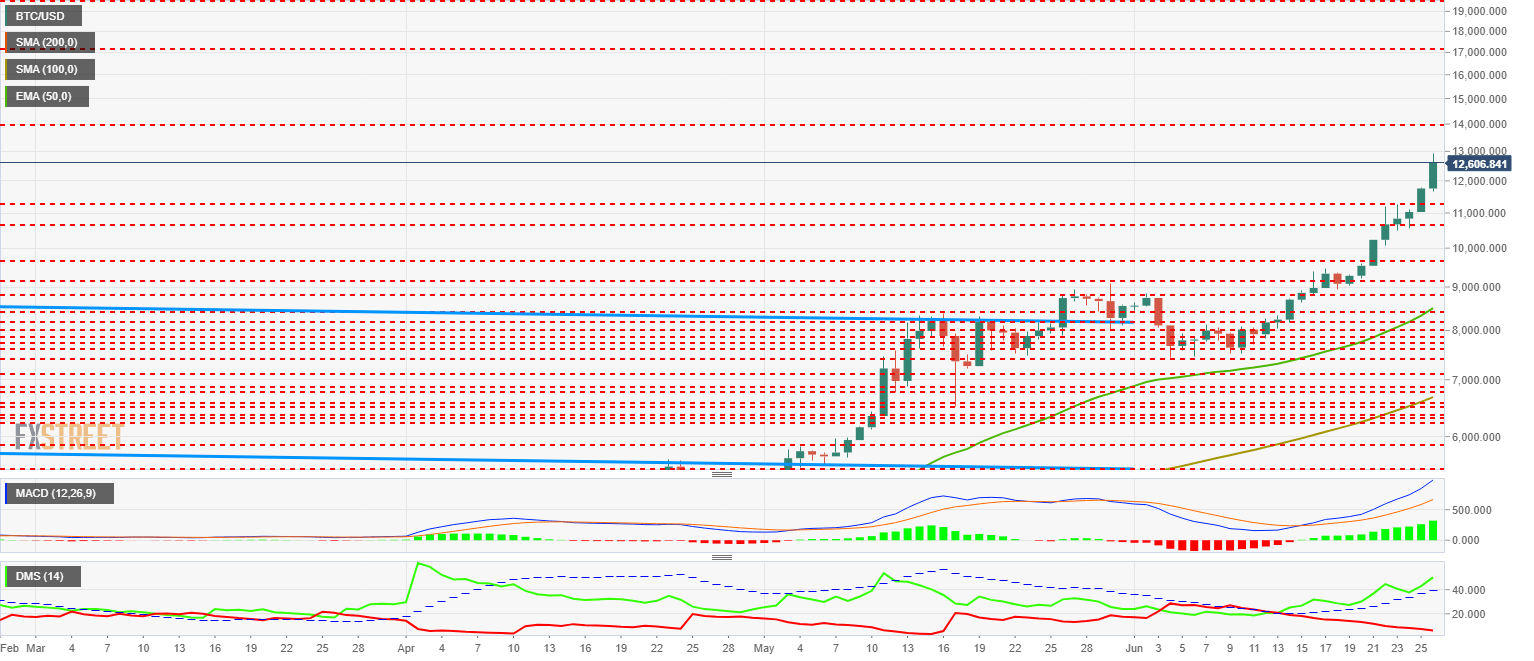
The MACD on the daily chart shows a spectacular profile that not even the most enthusiastic analyst would expect after the increases of these months. Both for inclination and opening between lines, the potential of improvements in the current swing is still huge. The $20,000 is not presented as something distant and improbable but rather as an inevitable and also very soon.
The DMI in the daily range also supports a scenario of bullish continuity that may suffer a correction given the extreme of the movement, but is irremediably bullish and will remain so for many days.
ETH/USD Daily Chart
The ETH/USD is currently trading at $330, an incredible level but one that is overshadowed by the magnitude of the Bitcoin rally. The Ethereum has its critical resistance at $465, which would represent what $9,150 has been for the BTC/USD pair. Above that level, Buterin's creature and friends will fly into the thousand.
Above the current price, the first resistance level is at $355 (price congestion resistance), then the second at $385 (price congestion resistance) and the third one at $465 (price congestion resistance).
Below the current price, the first level of support is at $320 (price congestion support), then the second is at $308 (price congestion support) and the third one at $290 (price congestion support).
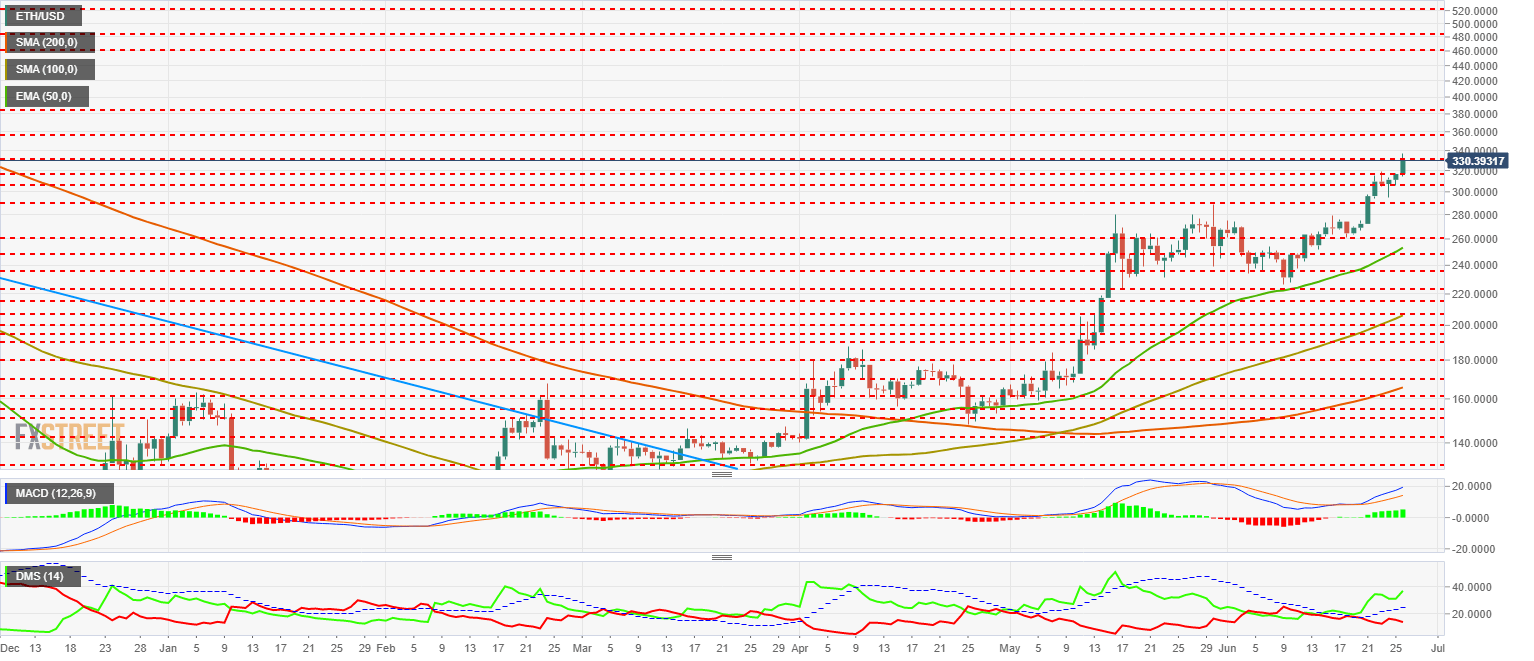
The MACD on the daily chart shows a bullish profile still in development, showing weakness in case sales appear but may develop a potential similar to Bitcoin's as the rises accelerate.
The DMI on the daily chart shows, here yes, an excellent bullish profile. Bulls shoot upwards and can continue to expand their dominance to overwhelming levels. Bears begin to give in to evidence but have a long way to go down before reaching extreme levels.
XRP/USD Daily Chart
The XRP/USD pair plays the "ugly duckling" and still doesn't join the bullish party where Ethereum and Bitcoin are. I don't doubt that sooner or later he will jump onto the dance floor, but for now, it's the disappointment of the sector.
Above the current price, the first level of resistance is at $0.504 (price congestion resistance), then the second at $0.527 (price congestion resistance) and the third one at $0.564 (price congestion resistance).
Below the current price, the first support level is $0.44 (double price congestion support), then the second at $0.426 (price congestion support) and the third at $0.413 (price congestion support and EMA50).
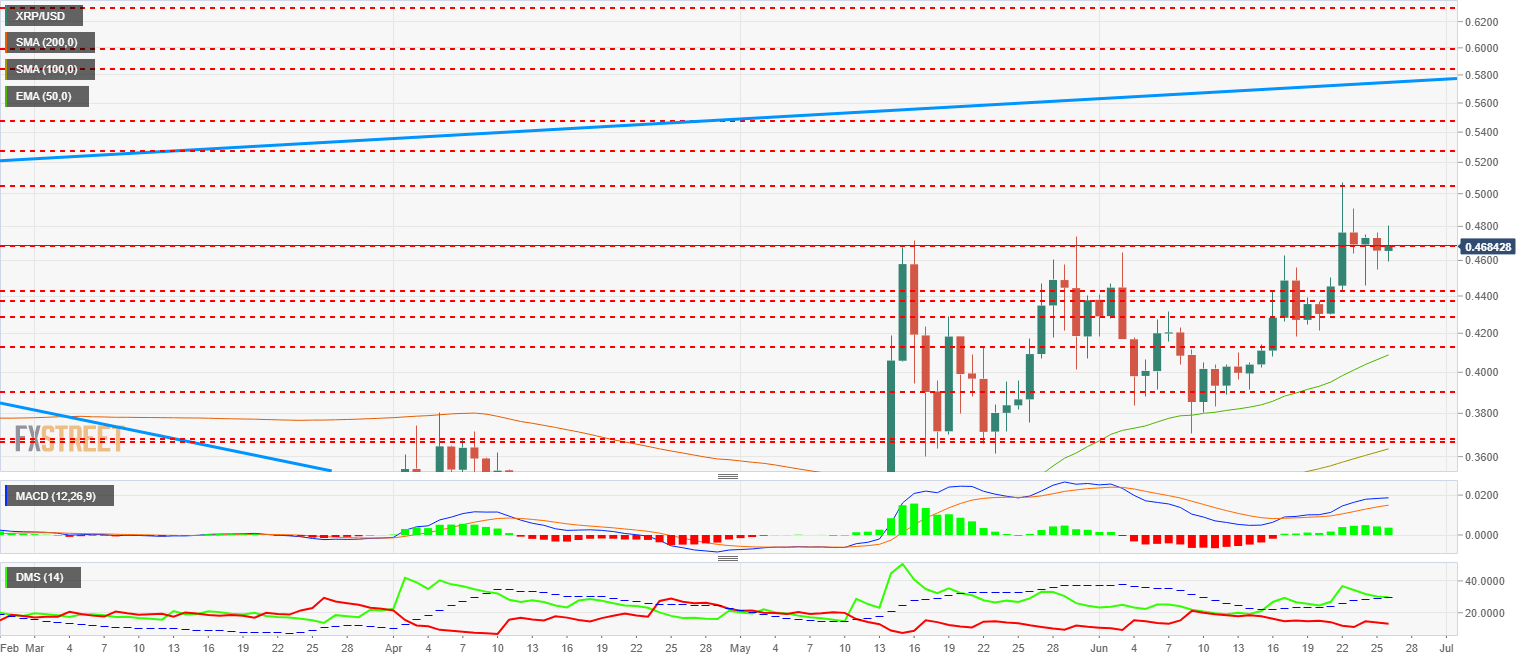
The MACD on the 4-hour chart shows a bullish but fragile profile if sales appear. If it evolves like Bitcoin, we can see a very bullish July month in the XRP.
The DMI on the daily chart shows how the bulls are playing in these hours survive above the ADX line. If they fail and lose track, we can see heavy falls. The bears are kept at low but not extreme levels, so they imply that they still have options to attack the leadership in the XRP/USD pair.
Get 24/7 Crypto updates in our social media channels: Give us a follow at @FXSCrypto and our FXStreet Crypto Trading Telegram channel
Author

Tomas Salles
FXStreet
Tomàs Sallés was born in Barcelona in 1972, he is a certified technical analyst after having completing specialized courses in Spain and Switzerland. He expanded his technical training following the guidance of great experts on the financial markets.


