Top 3 price prediction Bitcoin, Ethereum, Ripple: Wrecket time on Thanksgiving Day
- Bitcoin plays with anxiety and fear to steal the hands of the weakest players.
- Ethereum falls behind and it is off the leadership position.
- XRP continues to be the best bet in the short term, although not without danger.

Bitcoin dedicated a good part of yesterday to deceive traders.
After a morning session in which the price ran down, a sudden and sturdy turn to the rise activated the FOMO (Fear of Missing Out) mode in the psyche of many traders.
Even for a few hours, the price left the bearish zone and entered the bullish scenario. But the fairy tale was short-lived. The close of the session was finally in the bearish area.
Now there is a good group of traders positioned upwards, with slight losses, who have above them a stone wall. Below their positions, a lot of pain without a safety net.
And this pain can be used against the market itself. Any downward movement of the BTC/USD pair will feed on this pain, increase sales, with new sales there will be more pain and so on until the pain stock is exhausted.
Given the possibility that the market is so anxious to go up that it does not want to monetize traders' pain, a stop tight at $7,400 or $7,100 may be the best option.
ETH/BTC Daily Chart
ETH/BTC is currently trading at the price level of 0.0202 and it continues to be trapped between short and medium-term moving averages.
The technical aspect, in the short term, is neutral with a slight bearish bias.
Above the current price, the first resistance level is at 0.021, then the second at 0.022 and the third one at 0.023.
Below the current price, the first support level is at 0.020, then the second at 0.019 and the third one at 0.018.
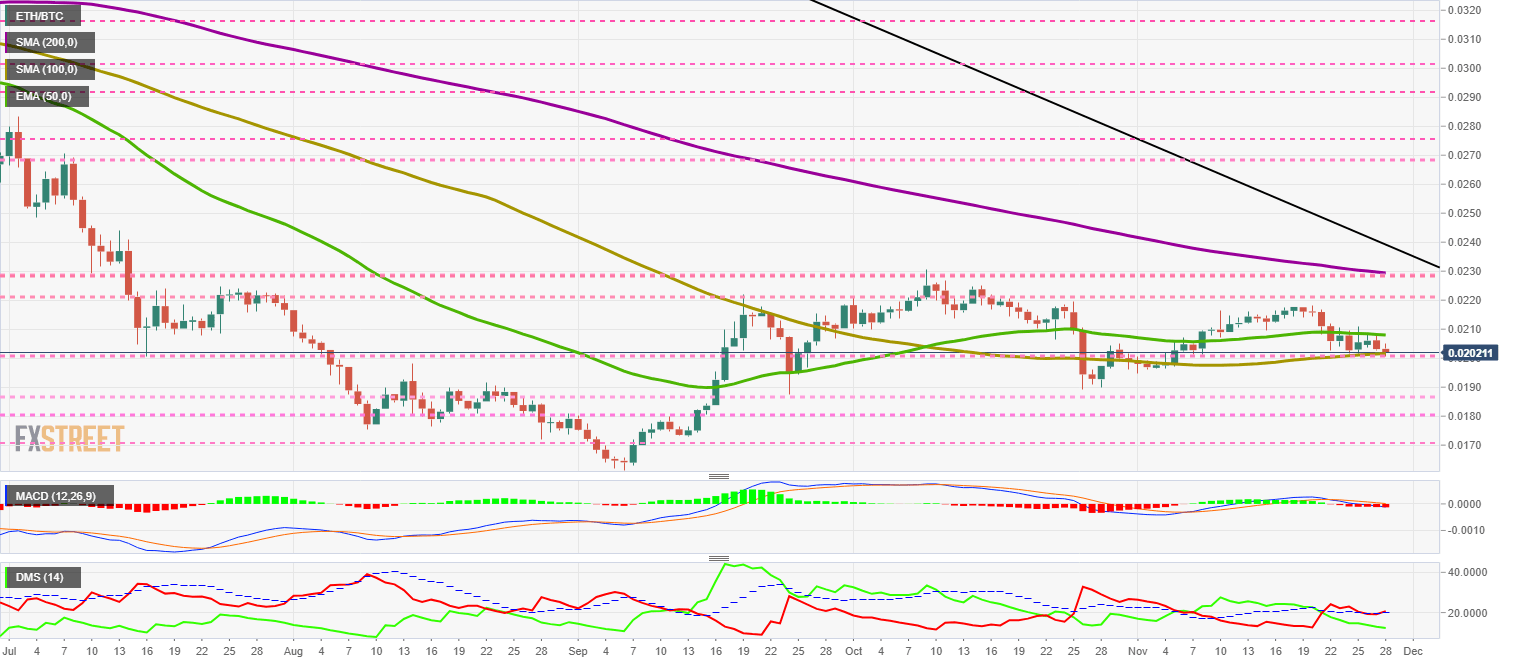
The MACD on the daily chart is set at zero and confirms the ETH/BTC pair's short term neutrality profile.
The DMI on the daily chart shows how the bears are trying to breach the ADX line again and regain momentum. The bulls do not react to the upside and give up disputing the leadership of the bears.
BTC/USD Daily Chart
The BTC/USD pair is currently trading at the $7.484 price level and is positioned right on the line between the bullish and bearish scenarios. Now, take any decision implies a significant risk except a short at $7,550 with a stop at $7,677.
Above the current price, the first resistance level is at $7,570, then the second at $7,600 and the third one at $7,750.
Below the current price, the first support level is at $7,400, then the second at $7,100 and the third one at $6,875.
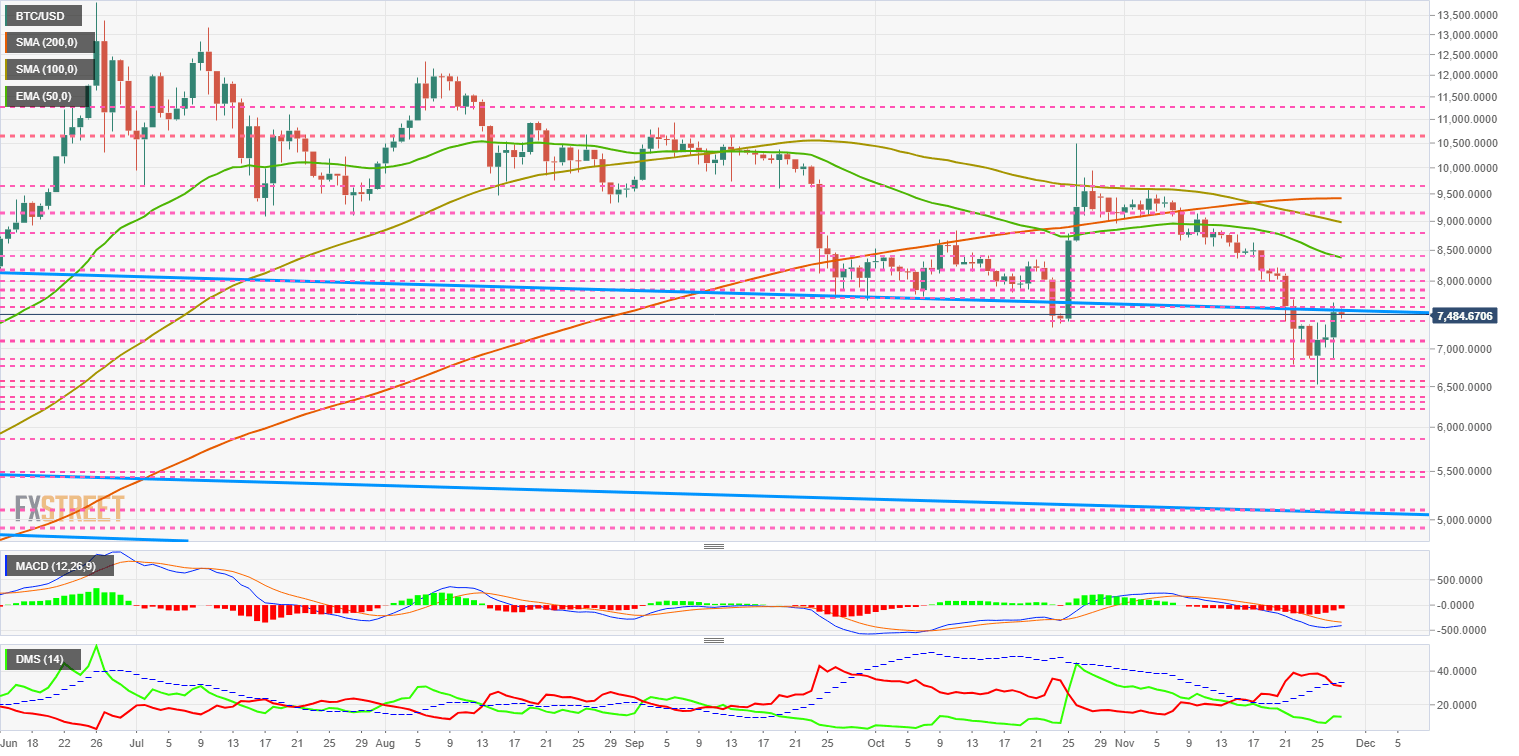
The MACD on the daily chart shows a profile that invites you to think of a bullish cross in the next few hours. The pattern of behavior indicates that it is very likely that the first attempt will fail in the effort.
The DMI on the daily chart confirms that bears are losing support for the ADX line and bulls are reacting upwards and heading for the cross with the bears.
.
ETH/USD Daily Chart
The ETH/USD pair is currently trading at the $151.1 price level after failing to cross price congestion resistance at $155. The technical development of the ETH/USD pair appears to be lagging behind the BTC/USD pair and is giving up the leadership of the cryptocurrencies segment to Bitcoin.
Above the current price, the first resistance level is at $155, then the second at $160 and the third one at $170.
Below the current price, the first support level is at $150, then the second at $140 and the third one at $130.
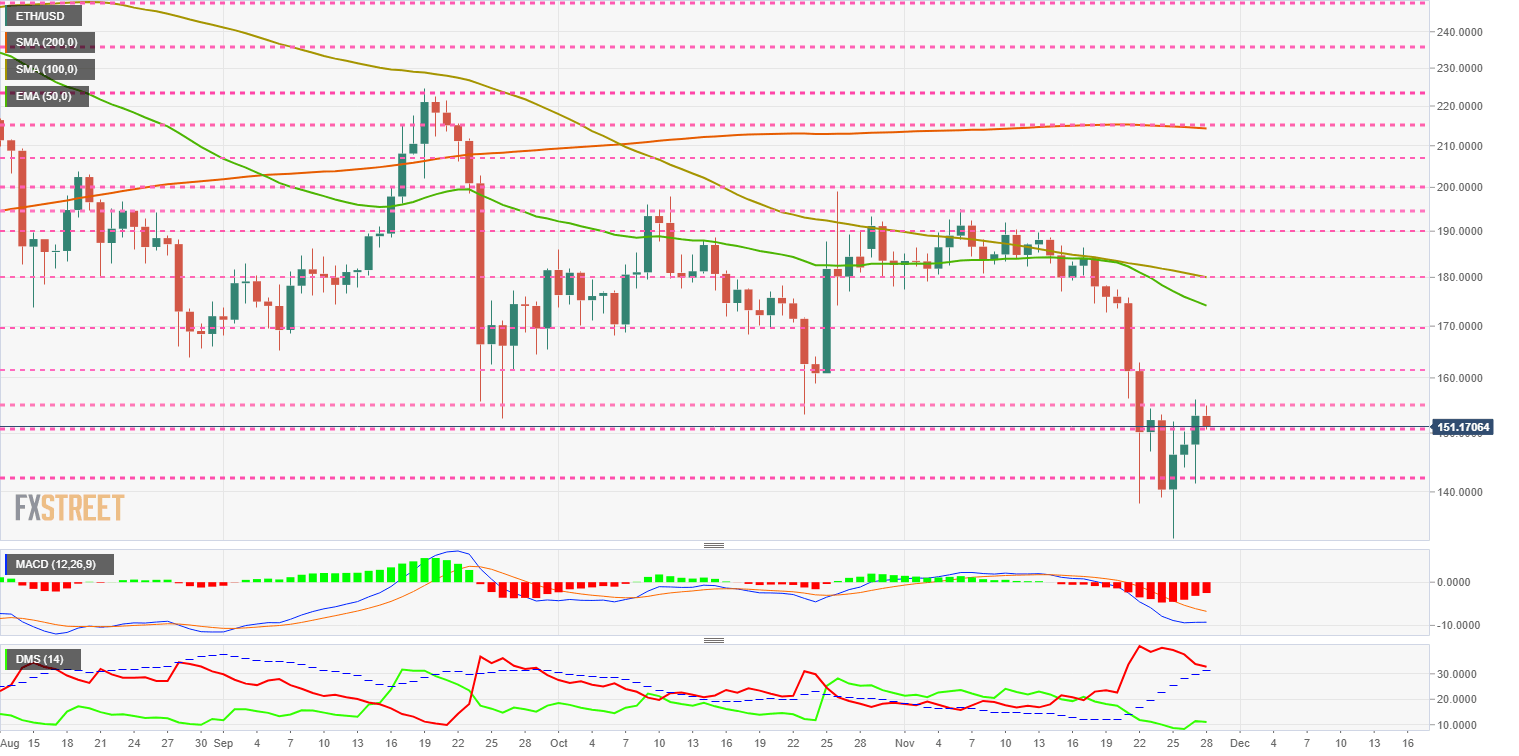
The MACD on the daily chart shows a bullish development. The current situation is far from a possible cross in the remainder of the week.
The DMI on the daily chart shows how the bears still move above the ADX line and therefore maintain control of the ETH/USD pair. The bears, who reacted yesterday, today are withdrawing and renege on any struggle for control.
XRP/USD Daily Chart
XRP/USD is currently trading at $0.2259 and is the only Top 3 that remains green. In yesterday's article, I already highlighted this possibility.
Above the current price, the first resistance level is at $0.24, then the second at $0.25 and the third one at $0.26.
Below the current price, the first support level is at $0.22, then the second at $0.19 and the third one at $0.17.
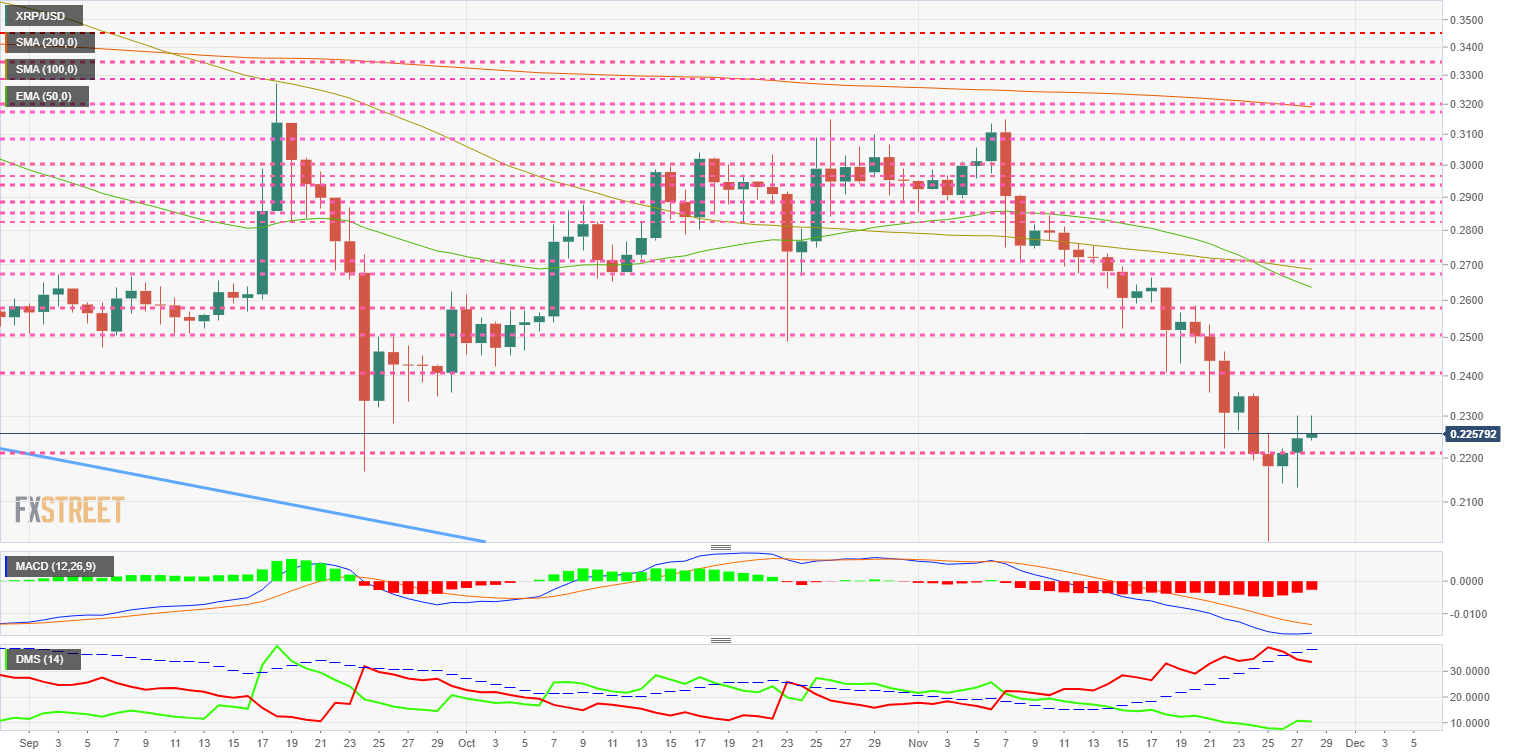
The MACD on the daily chart shows a favorable profile for a bullish cut, although the pattern of behavior suggests that the first attempt will fail.
The DMI on the daily chart confirms that the bears lose support for the ADX line and activate a leadership change pattern. The bulls responded yesterday, but today they seem to doubt the lack of visibility that there is today in the crypto market.
Get 24/7 Crypto updates in our social media channels: Give us a follow at @FXSCrypto and our FXStreet Crypto Trading Telegram channel
Author

Tomas Salles
FXStreet
Tomàs Sallés was born in Barcelona in 1972, he is a certified technical analyst after having completing specialized courses in Spain and Switzerland. He expanded his technical training following the guidance of great experts on the financial markets.


