Top 3 Price Prediction Bitcoin, Ethereum, Ripple: War for dominance still at play
- Bitcoin's dominance goal is at 60% in the medium term.
- Extreme mistrust is reflected in sentiment levels inappropriate to current price levels.
- Ripple is prone to sudden movements, but with no visibility in the direction.

The crypto board shows slight falls today after the good news that comes about the huge global challenge that is beating the COVID19.
This optimism relies on the possibility that a viable vaccine will be ready to test in the coming days, the 500M reconstruction programme announced by Angela Merkel and the return of oil demand from China.
This market improvement may be the perception of the investor, thus giving a role of safe-haven value to the previously beleaguered cryptocurrencies.
Technically, the charts explain other reasons for the current weakness.
On the one hand, the dispute for market dominance between Bitcoin and the Altcoin segment continues.
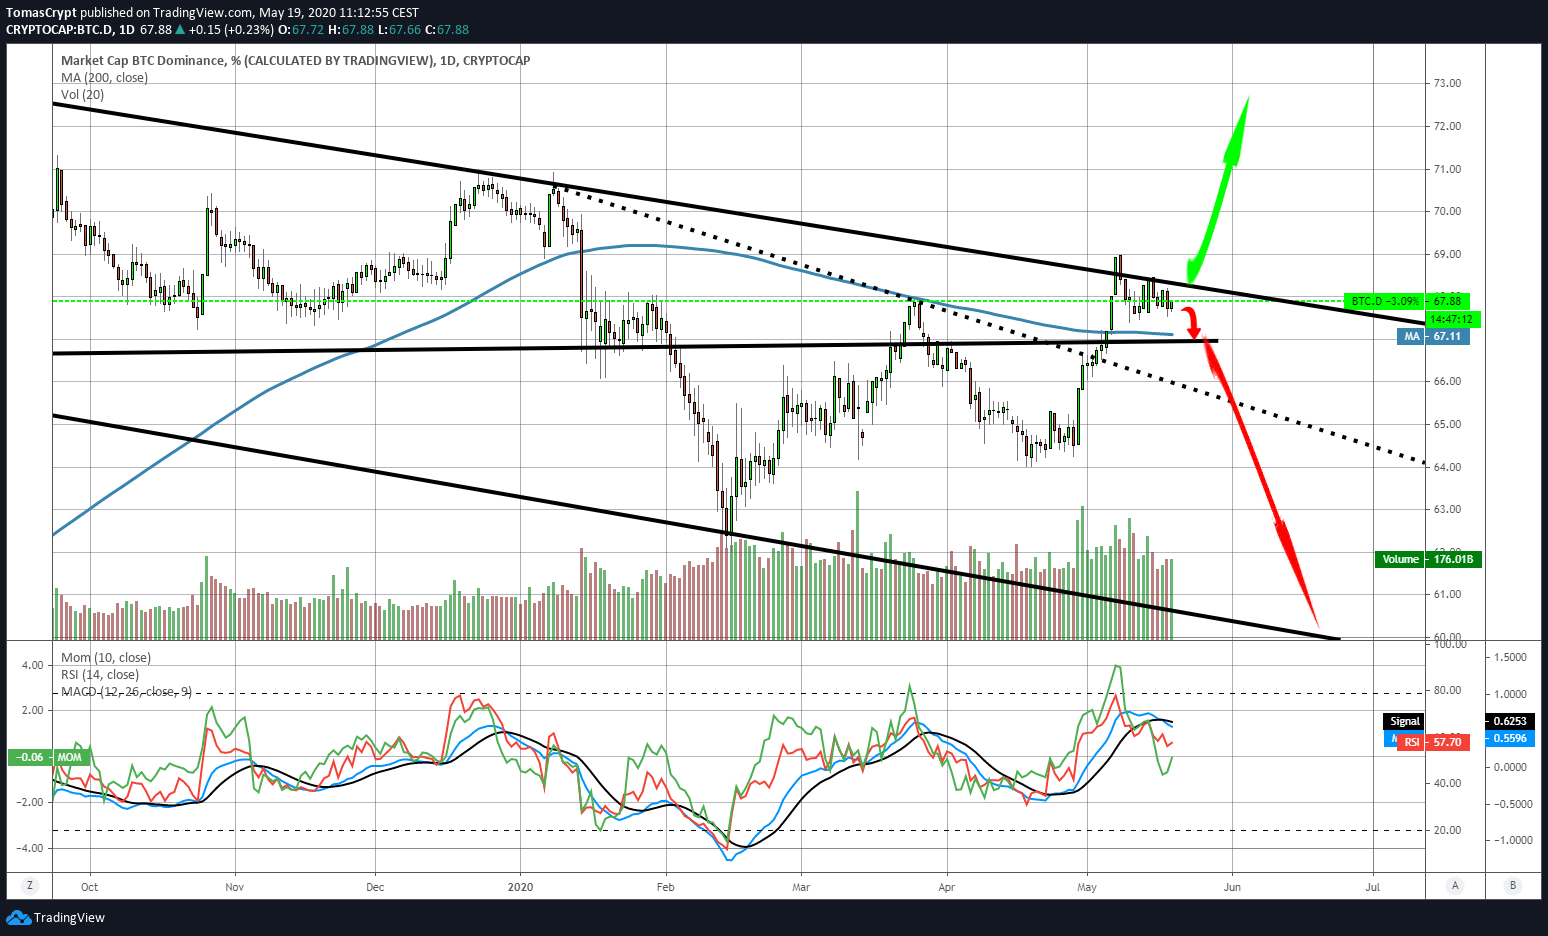
The Bitcoin dominance chart shows that the cryptocurrency leader will continue to lose market share. At the moment, Bitcoin controls 67.67% of the capitalization. Below the current level, there is support at the 67.11% level, but the current bearish channel leaves room for a much more significant drop to the 60% level.
Bitcoin's loss of market share does not imply a drop in price, but Altcoins would perform relatively better. Traders who use Altcoins as a lever to accumulate Bitcoin may have an excellent opportunity in the coming months.
Market sentiment is back at level 50 today, and faithfully reflects the distrust of the short-term future. The BTC/USD pair stalking the $10000 resistance level or the ETH/USD above $200 is not enough to bring some optimism to the surface.
This distrust is positive for the market, according to the law of contrarian sentiment, and implies that the market can hold off from areas of extreme optimism to very-high price levels.
ETH/BTC Daily Chart
The ETH/BTC pair is currently trading at the 0.0218 price level, and today's target is to consolidate this level as a support for the next resistance levels. The main moving averages extend to the 0.024 level, while the standard to beat – the recent relative high – is at 0.0278.
Above the current price, the first resistance level is at 0.0228, then the second at 0.024 and the third one at 0.0245.
Below the current price, the first support level is at 0.0217, then the second at 0.020 and the third one at 0.0186.
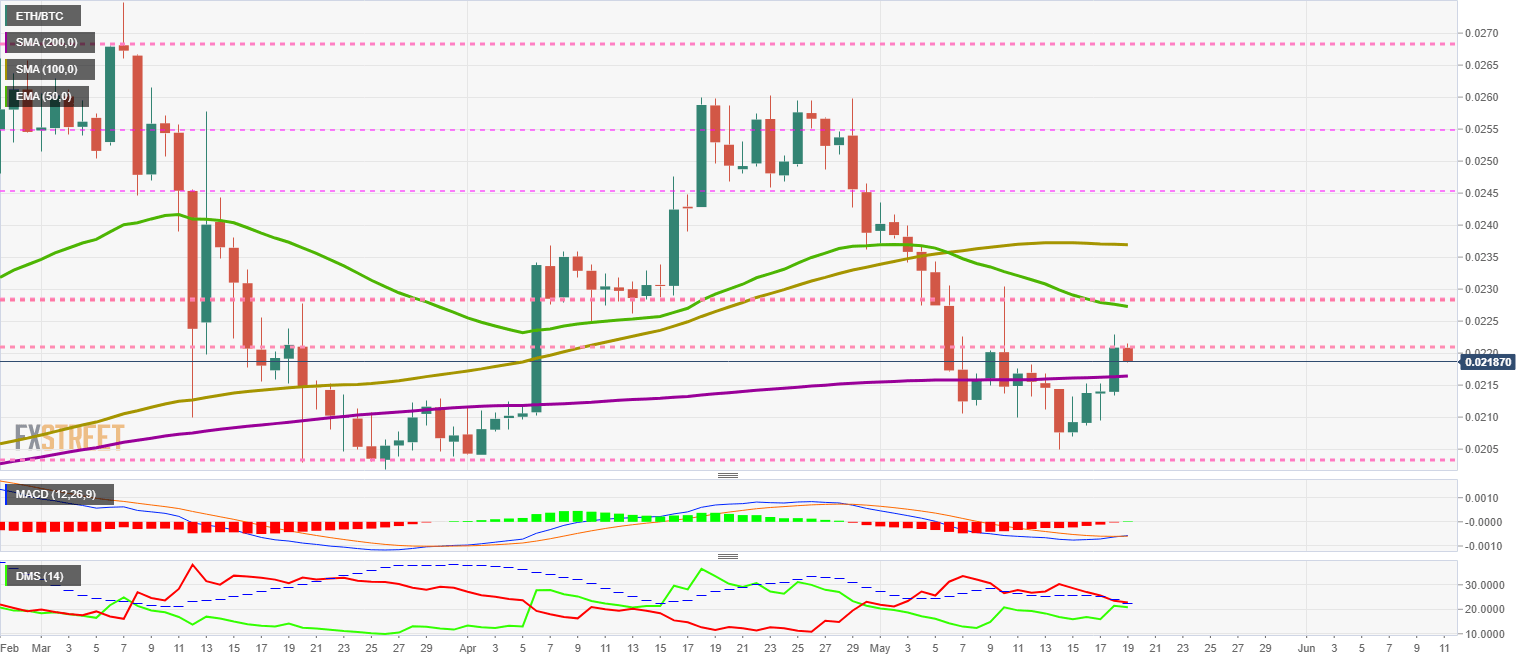
The MACD on the daily chart shows an incipient bullish cross that could reverse quickly. The situation is potentially bullish, but the upside needs to continue to consolidate the upward momentum.
The DMI on the daily chart shows bears resisting the threat of the bulls, which are rapidly approaching the level of the selling side. The resolution of this bullish bear battle is crucial in short to medium term.
BTC/USD Daily Chart
The BTC/USD pair is currently trading at the price level of $9777, and it's penalized by the failure to break above $10000. Major moving averages are moving below $8500, and the benchmark support level is at the $8000 price level.
Above the current price, the first resistance level is at $9600, then the second at $10000 and the third one at $10450.
Below the current price, the first support level is at $9150, then the second at $8825 and the third one at $8400.
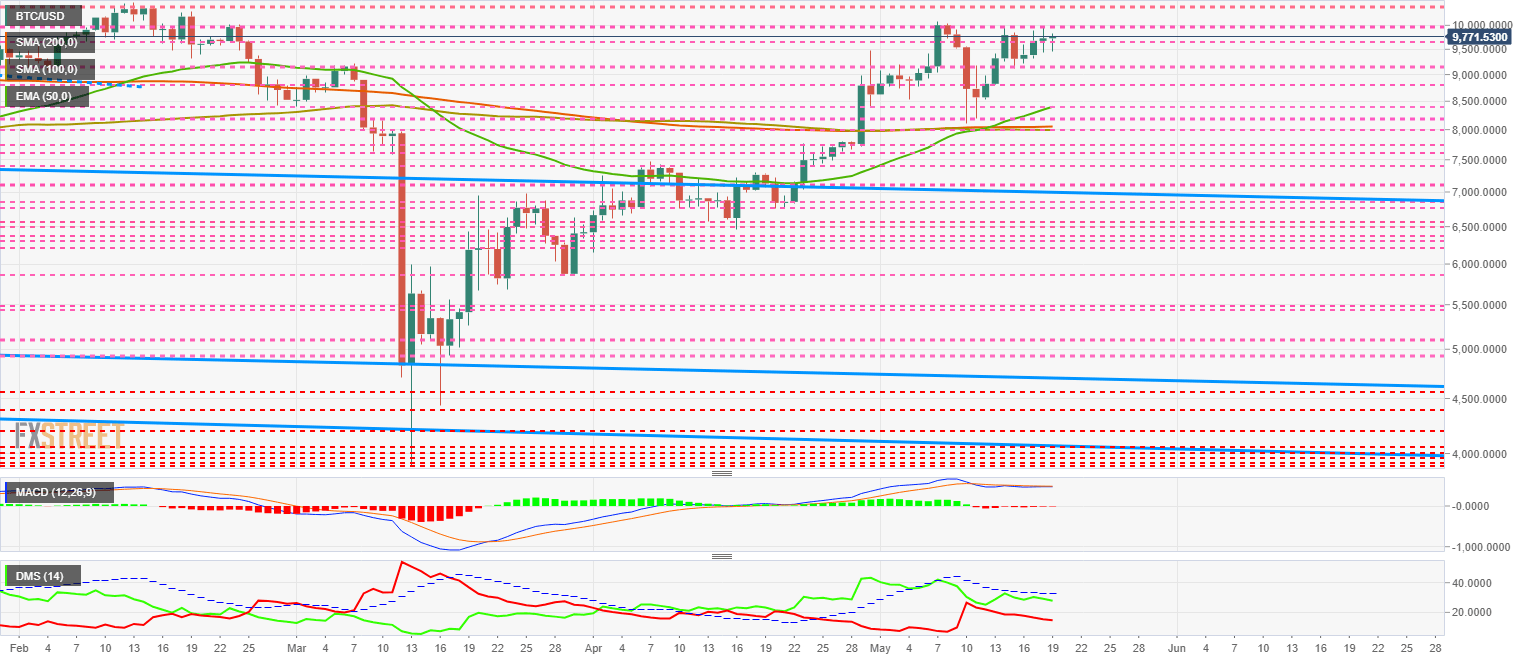
The MACD on the daily chart shows an outlier profile. The moving averages that make up this indicator are entirely flat, with no line separation, but remain at very favourable levels. An exit to this strange structure can lead to a sharp increase in volatility.
The DMI on the daily chart shows bulls losing strength, as well as bears also moving downwards.
ETH/USD Daily Chart
The ETH/USD pair is currently trading at the price level of $213 and is moving in the price line that signals the entry into a new short-term bullish scenario. A close above the $215.5 level would trigger many buy signals.
The major moving averages are very close and offer reliable support at the $190 price level.
Above the current price, the first resistance level is at $215.5, then the second at $225 and the third one at $230.
Below the current price, the first level of support is at $210, then the second at $200 and the third one at $195.
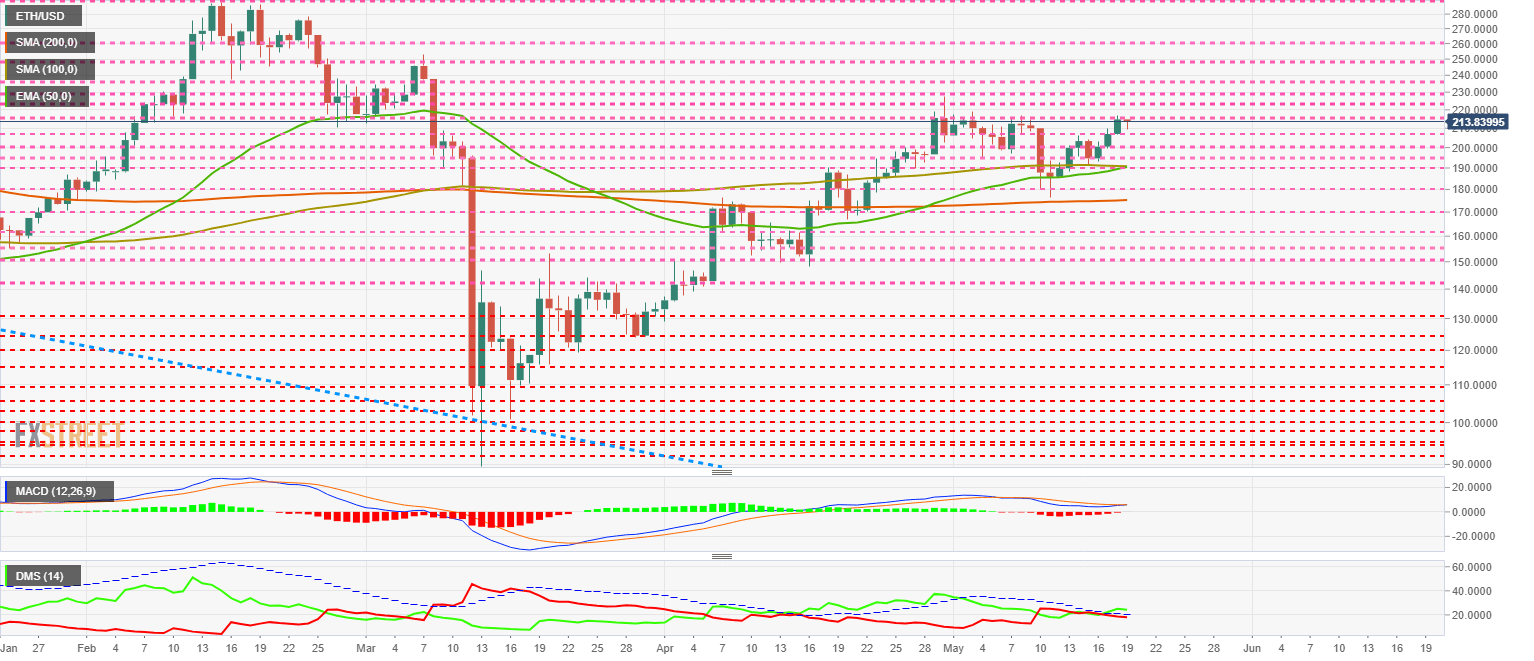
The MACD on the daily chart shows a similar structure to the first week of this month but with a reverse position. If it then resolved to fall, this time it should take the opposite path.
The DMI on the daily chart shows the bulls in control of the pair. Yesterday they triggered a solid bullish pattern by crossing the ADX line. They may test the same level in the next few hours, but if they don't breach the dotted line, the bullish pattern will remain active.
XRP/USD Daily Chart
The XRP/USD pair is currently trading at the price level of $0.205 while remaining in a narrow price range for another day. The 100-day and 200-day simple moving averages extend to the $0.223 price level. The critical support level is at the $0.20 level and below it a large gap that could quickly bring the price below the $0.16 level.
Above the current price, the first resistance level is at $0.209, then the second at $0.215 and the third one at $0.221.
Below the current price, the first level of support is at $0.20, then the second at $0.19 and the third one at $0.18.
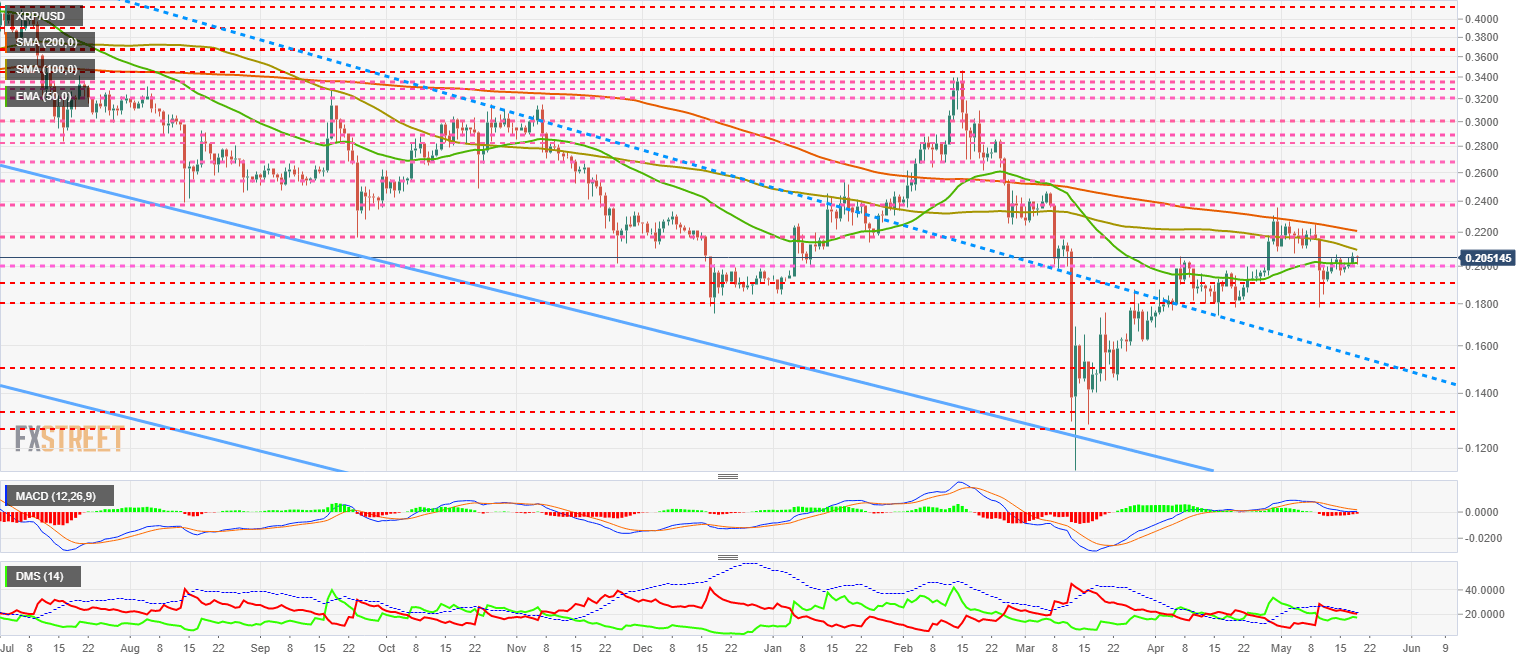
The MACD on the daily chart shows potential for a bullish move in the near term. The MACD on the daily chart shows upward potential in the short term. The moving averages have been looking for support at the neutral level, and it appears that they have found it for the time being.
The DMI on the daily chart shows the bears losing strength and moving very close to the bullish level. The current structure is conducive to violent breaks in the new price ranges.
Author

Tomas Salles
FXStreet
Tomàs Sallés was born in Barcelona in 1972, he is a certified technical analyst after having completing specialized courses in Spain and Switzerland. He expanded his technical training following the guidance of great experts on the financial markets.



