TOP 3 price prediction Bitcoin, Ethereum, Ripple: Volume in historical highs for Bitcoin with final bullish result
-
Last week was the heaviest BTC/USD trading week in Binance history.
-
The weekly and daily charts line up, greatly increasing the probabilities of a sustained upward movement.
-
Among the Alt Coins, there are also generalized increases in purchases.

I'm back from a fantastic holiday between beaches and mountains and have to catch up on the situation of Bitcoin, Ethereum, and Ripple. With the intention of catching up, I am starting today a three-part mini-series where I intend to cover from one to one the three main Cryptos.
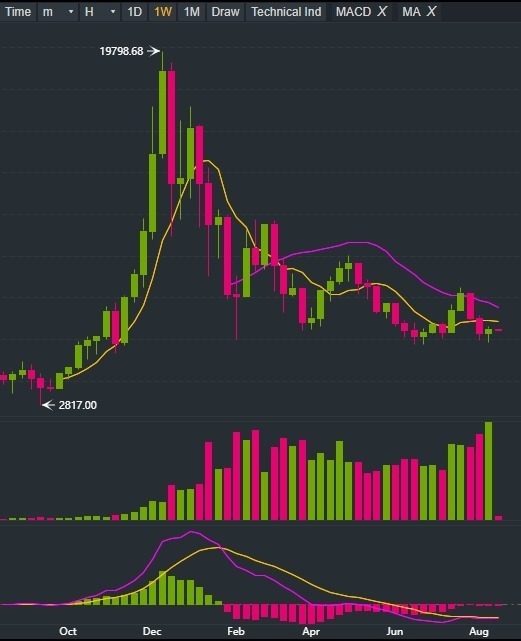
Starting this mini-series with Bitcoin, the preliminary weekly time frame analysis leaves a very important piece of data recording the maximum volume level ever seen in Binance on the BTC/USD. More than 378K Bitcoins were traded during the week leaving a huge bullish green bar on the chart.
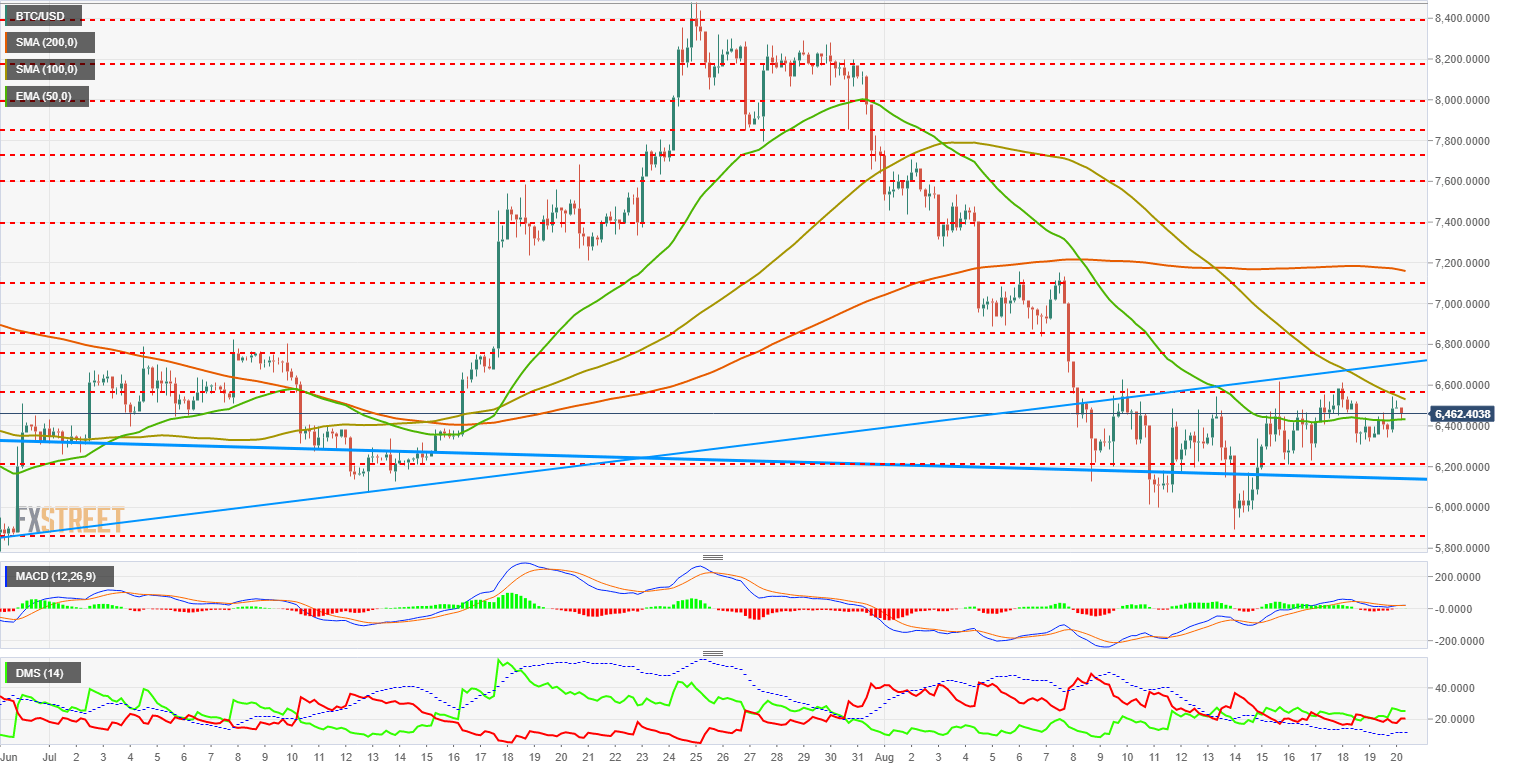
BTC/USD 240 Min
The BTC/USD is currently trading at $6,462, trapped between the EMA50 and the SMA100 after failing to conquer resistance due to price congestion at $6,560. Above this price level, the BTC/USD will find itself with a lost bullish trend line on August 8th, which is currently at $6,717. The recovery of this line is essential to take any bullish attempt for granted.
This will likely coincide with the congestion resistance level of the price which is slightly higher at $6,750.
From this point until the SMA200 at the $7,159 price level, the BTC/USD would only have a minor resistance at the $7,100 level.
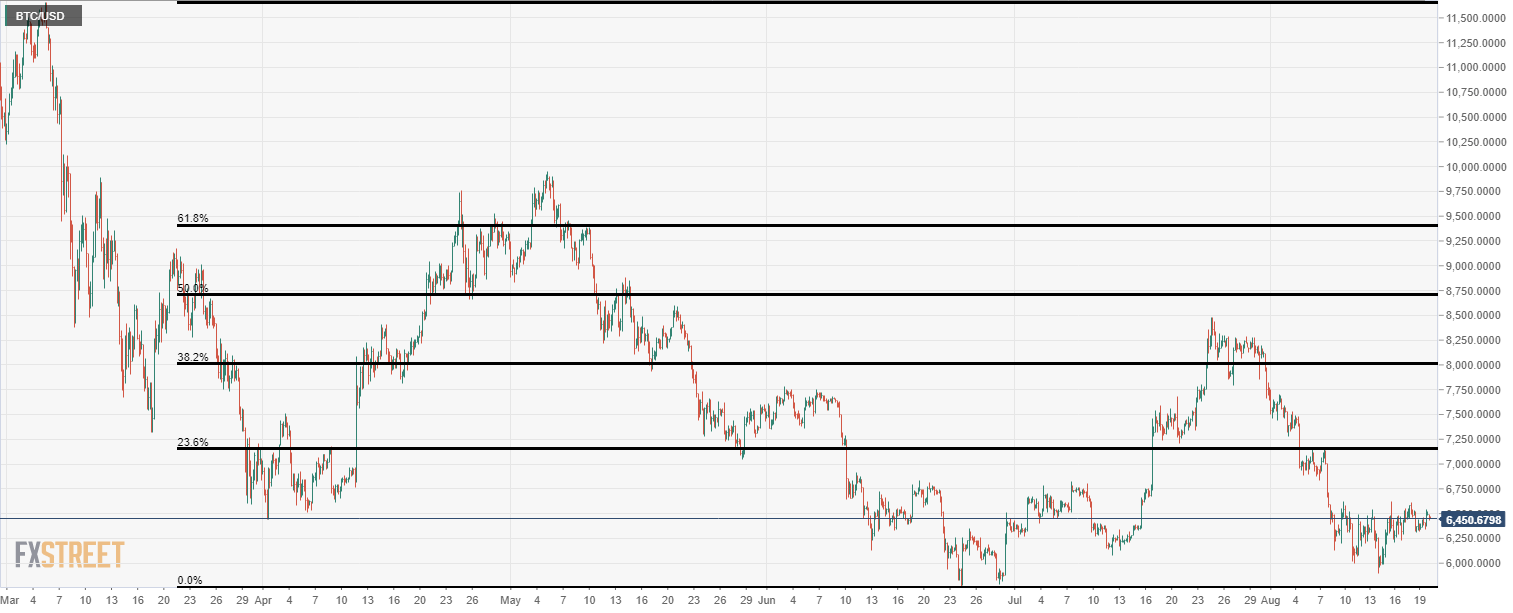
In the mid-term, the Fibonacci retracement tool marks as the first target the $7,152 price level (coinciding with a previous resistance level), followed by the $8,000 price level (38.2% retracement level) and thirdly the 50% retracement on the $8,725 price level. Reaching this last price level would cancel the downward trend that began last February.
The most recent benchmark at $5,895 is the level to watch for and a possible opening point for short positions. Until that signal level is reached, the support at the $6,200 price level first and the trend line at the bottom of the long-term bearish channel later remain as early attention levels. A close below the $5,770 price level would confirm the bearish continuation and cancel out any upward scenario. On the downside, the BTC/USD has taken a break with the recovery of the $6,450 price level but continues in a dangerous zone and any negative news could send Bitcoin into a long downward spiral that could take it to new annual lows.
The MACD on the weekly chart shows an indicator that has been set up for a bullish mid-term cross and has been working hard to shorten the time it takes to do so. The strong capital inflow seen in the markets over the past week has been vital in achieving this.
The MACD on the daily chart is also configured for a bullish cross on a daily basis.
The Directional Movement Index in the weekly range gives a slight advantage to sellers, without buyers showing enough activity to consider it a trend. The ADX is also lazy and remains below level 20, a condition for the presence of a clear trend movement.
The ADX is not able to impose an upward trend in its daily range either, but it has been increasing its strength as the selling forces have been decreasing.
In the short term, the range of 240 Min does show some buyers in control but without the ADX accompanying them.
Therefore, the most likely scenario is that of the beginning of a medium-term upward trend, which is likely to be lazy in its early stages while waiting for increases in the upward trend forces.
Author

Tomas Salles
FXStreet
Tomàs Sallés was born in Barcelona in 1972, he is a certified technical analyst after having completing specialized courses in Spain and Switzerland. He expanded his technical training following the guidance of great experts on the financial markets.


