Top 3 Price Prediction Bitcoin, Ethereum, Ripple: USDT overtakes Ripple and wakes up the XRP bulls
- Capital's flight to fiat anchors shakes the market and puts the XRP in need of an upward reaction.
- Bitcoin moves downwards and shows the way for a new market share distribution.
- Yesterday's selling hit the mid-term outlook and claim for bulls' action to avoid delaying rises until the summer.

Ripple loses the last place on the crypto market podium to USDT after yesterday's falls and the capital flight to the fiat market anchor offered by the US Dollar Tether.
The change in position is not due to a capital flight from the XRP, but rather the significant inflow of capital into the USDT from sales in the entire crypto universe.
Paradoxically, the Ripple is showing very positive signs at the beginning of the day. According to its dominance chart, it could be about to start a powerful upward leg in the race for market capitalization.
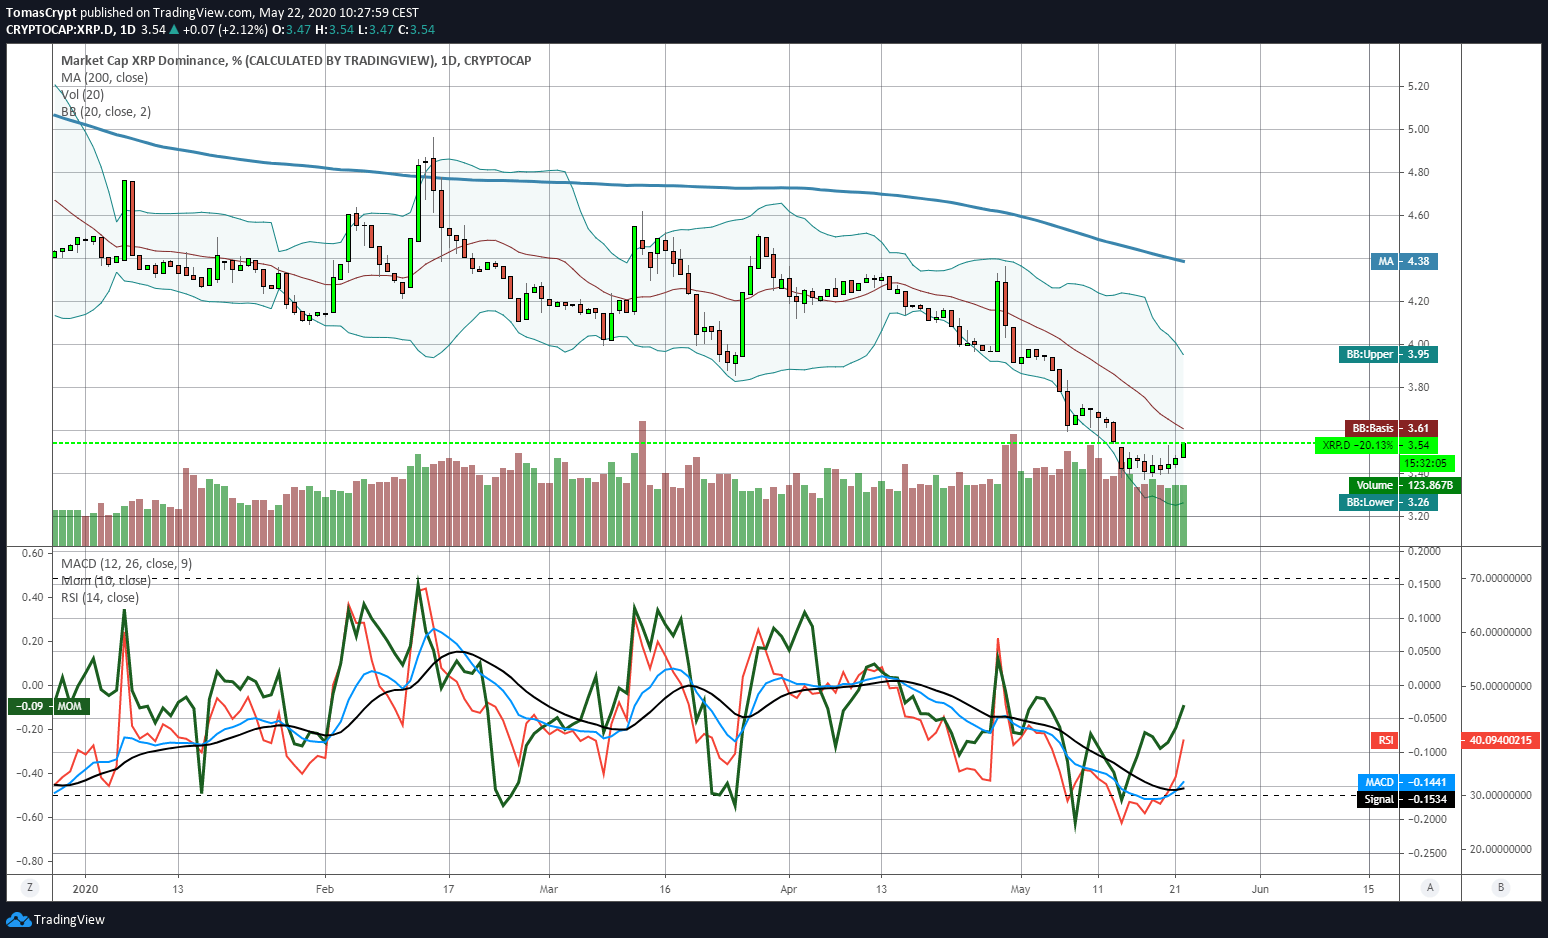
Currently, the Ripple's $8.8B market cap gives it a 3.54% of the overall crypto market value, which could rise to the 3.61% level today and the 3.95% level in the next few days.
The 200-day simple moving average is at the 4.38% level of dominance, and that would be the goal in short to medium term.
The USDT's advantage over Ripple in market cap is just over $200M, so Ripple is likely to regain its place in the Top 3 quickly.
The mid-afternoon sales along the crypto board had no significant technical consequences but confirmed that Bitcoin needs to come down for fresh money after failing at the $10000 resistance level.
The Bitcoin dominance graph indicates that the weakness of Bitcoin will continue in the short term. Support at the 67th market share level is the primary target, but a loss of that level would shift the medium-term target to the 60% dominance zone.
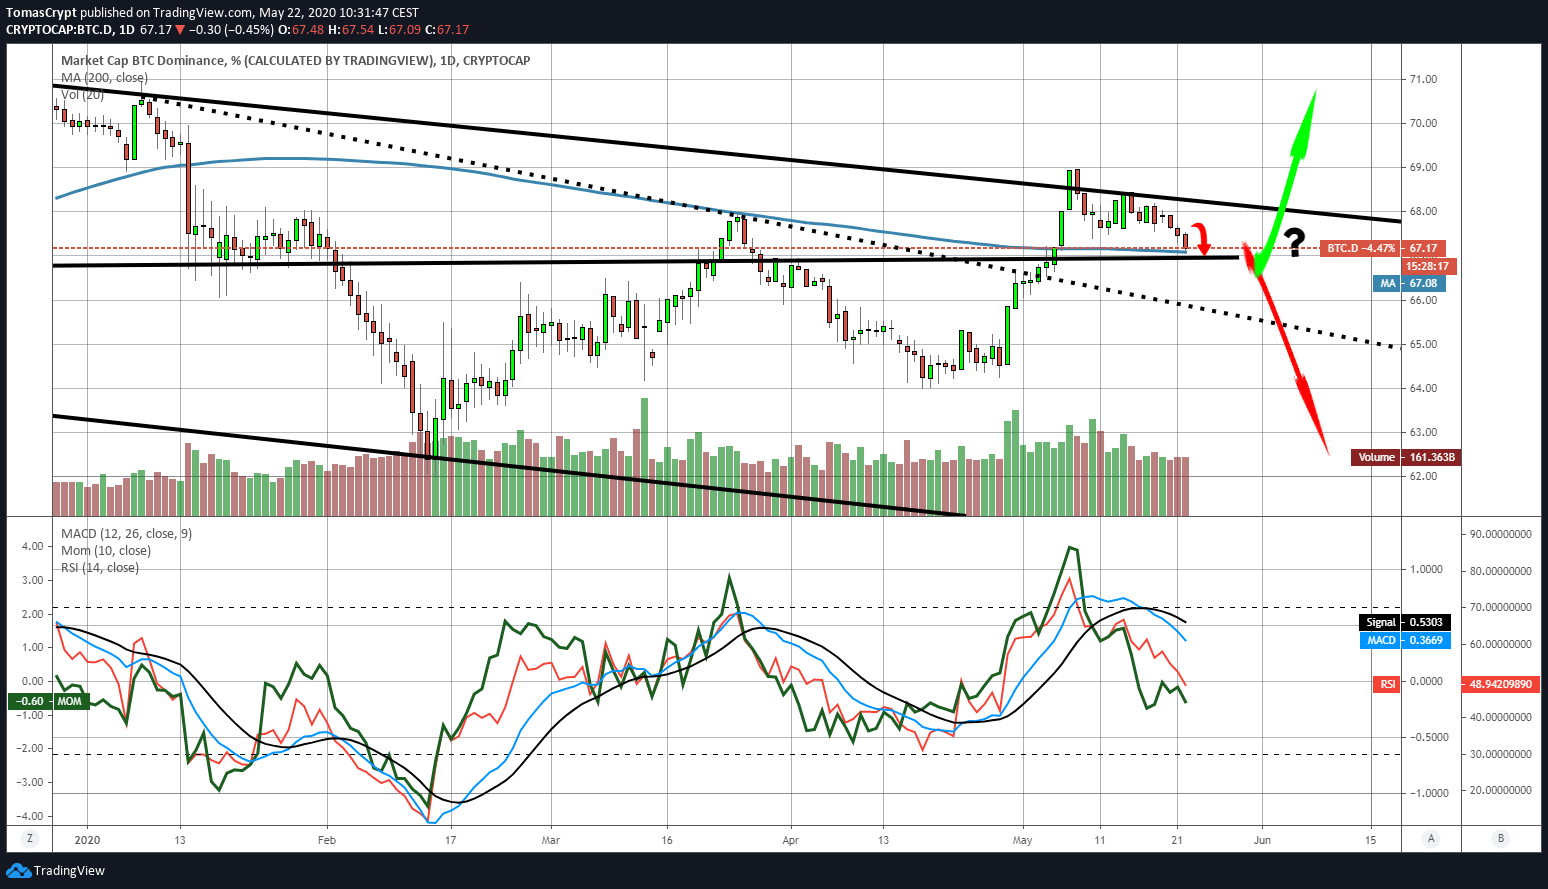
The impact of this move would be very bullish for the crypto segment even though if the process leads to a bearish leg, it would penalize the fiat currency valuations of the investment portfolios.
Market sentiment has collapsed from yesterday's falls and is moving back into the "fear" zone after only a few hours in the "neutral" area of the indicator prepared by alternative.me
ETH/BTC Daily Chart
The ETH/BTC pair is currently trading at the price level of 0.02219 and is once again attempting to break out of the price congestion resistance level at 0.0222 after four days of trying.
Above the current price, the first resistance level is at 0.0222, then the second at 0.0226 and the third one at 0.0236.
Below the current price, the first support level is at 0.0216, then the second at 0.0206 and the third one at 0.0188.
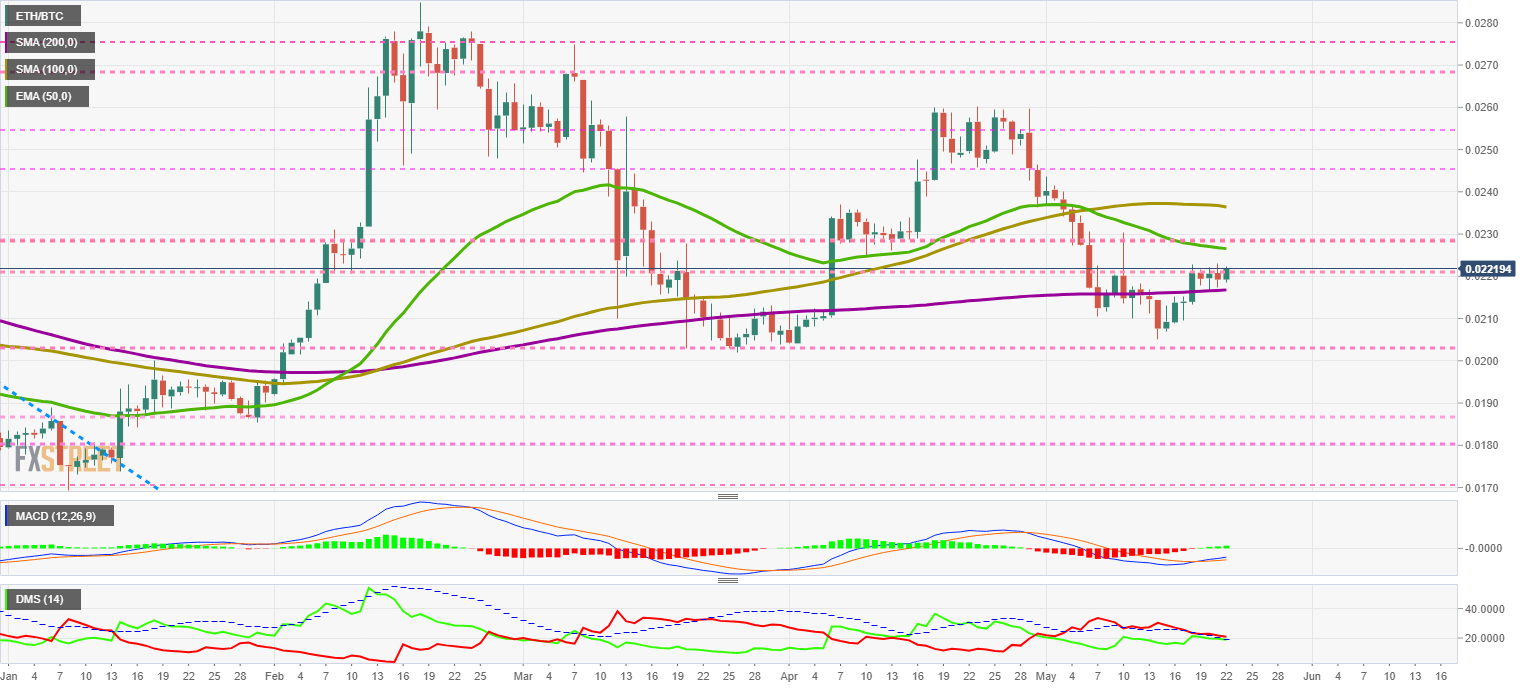
The MACD on the daily chart continues to cross the oversold territory but is not yet sufficiently steep to make a significant move upward in the coming hours.
The short-term DMI confirms the lack of upward momentum for the ETH/BTC pair. The bears are still in control, but with a small advantage, they could lose at any moment - and give a bullish signal that benefits the Ethereum over Bitcoin.
BTC/USD Daily Chart
The BTC/USD pair is currently trading at $9054 and is following the positive market trend in reaction to yesterday's declines. The moving averages are negative as the 100-day simple moving average loses its lateral profile and becomes bearish.
Only a bullish reaction in the next few hours from BTC/USD could prevent a move of the leading moving averages towards the $7500 level.
Above the current price, the first resistance level is at $9100, then the second at $9650 and the third one at $10,000.
Below the current price, the first support level is at $8800, then the second at $8400 and the third one at $8200.
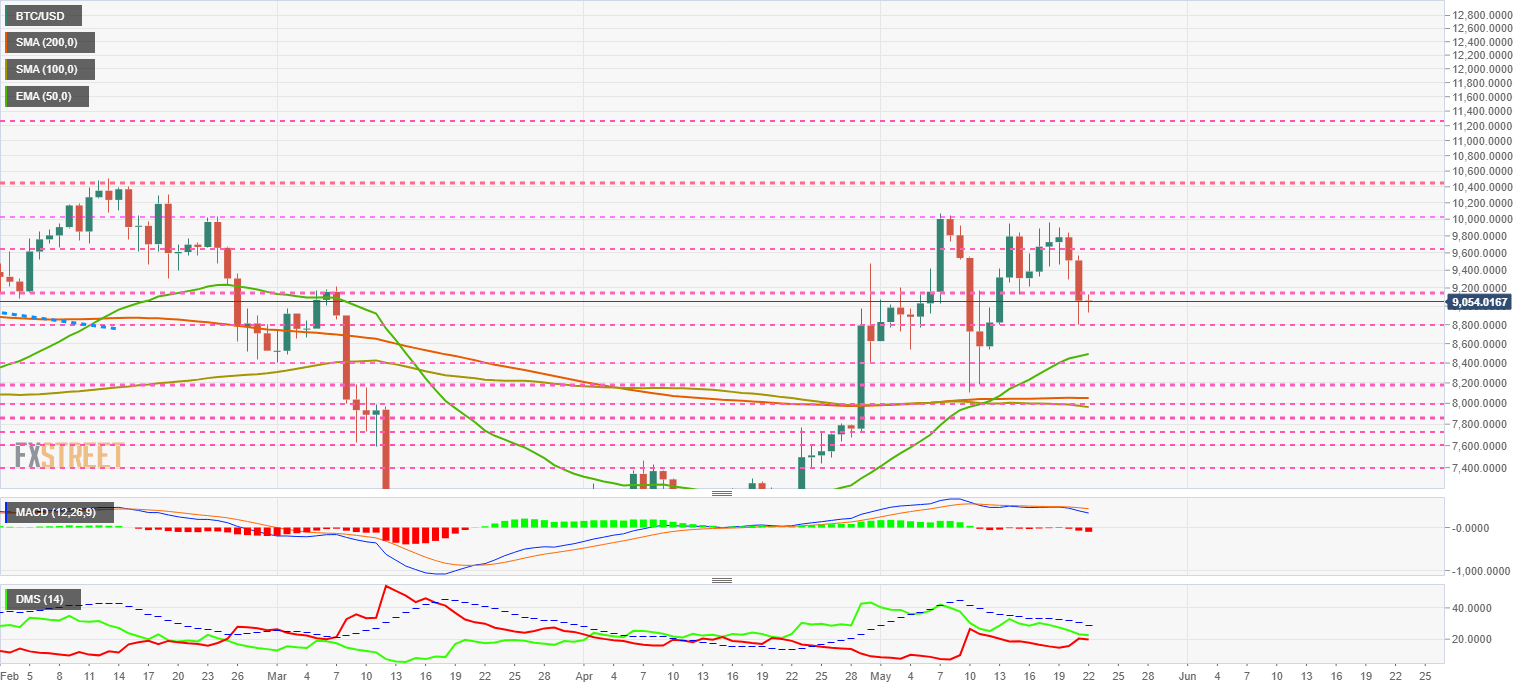
The MACD on the daily chart increases the bearish profile and projects more declines in the future. Considering the situation of the dominance charts, we can expect that in the short term, Bitcoin will fall, but the Altcoins will rise slightly or fall less than BTC.
The DMI on the daily chart shows the bulls leading the BTC/USD pair, but with the bears threatening to take over in the coming sessions.
ETH/USD Daily Chart
The ETH/USD pair is currently trading at the $201 price level and has regained a critical psychological level for Buterin's creature. Also, in the case of the Ethereum, we see the 200-day simple moving average losing its bullish profile and rapidly mutating into a bearish one.
Above the current price, the first resistance level is at $208, then the second at $215 and the third one at $225.
Below the current price, the first support level is at $200, then the second at $195 and the third one at $190.
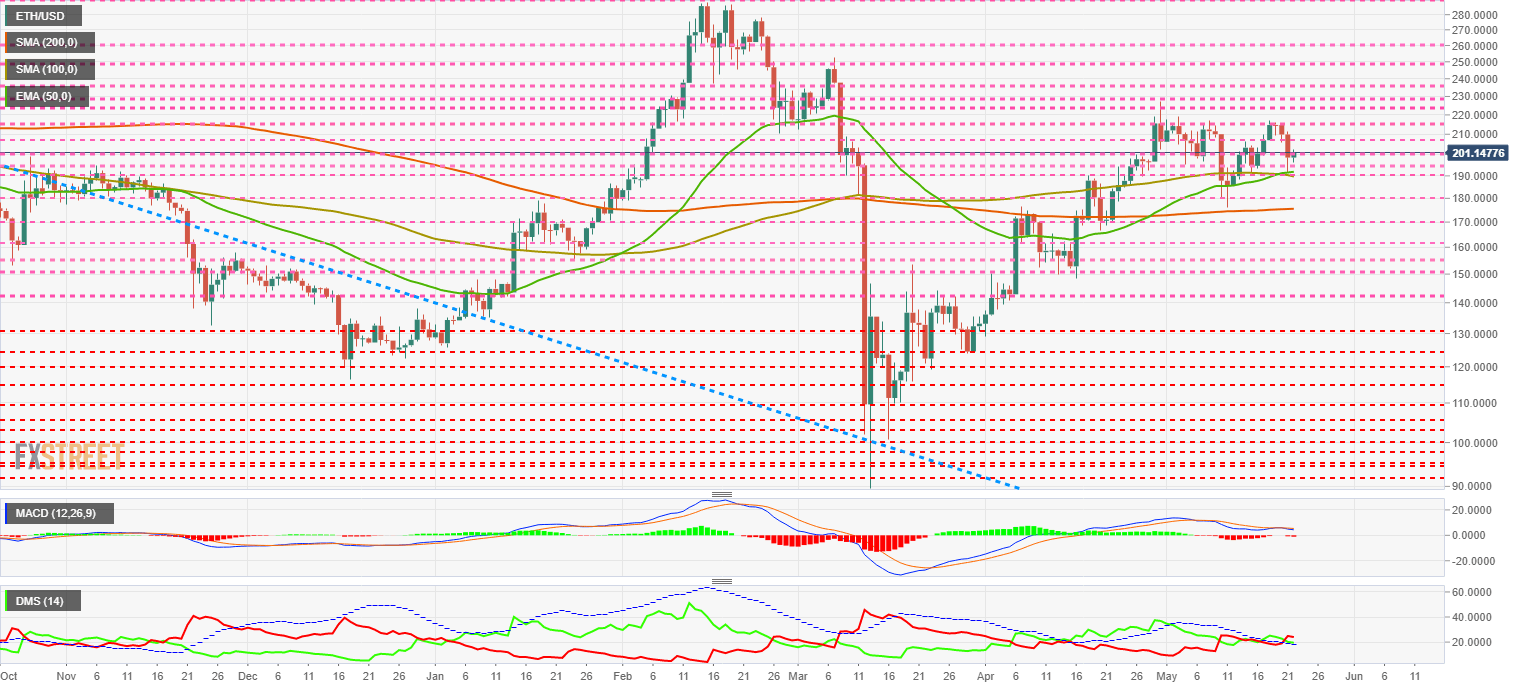
The MACD on the daily chart is in a dual position that can quickly move in all three market directions: up, down or sideways. So total uncertainty, or full possibilities, depending on the trader's mood.
The DMI on the daily chart shows bears leading with a small advantage over bulls. The buying side has it's favour moving above the ADX line, and if there are strong buys, they can quickly turn the situation around.
XRP/USD Daily Chart
The XRP/USD pair may surprise and move up sharply in the next sessions. The Ripple has been in a downward phase for months, and the degree of confidence towards the Ripple Ltd project is at its lowest.
The main moving averages are still tilted downwards and point to the $0.185 level.
Above the current price, the first resistance level is at $0.20, then the second at $0.24 and the third one at $0.245.
Below the current price, the first support level is at $0.19, then the second at $0.18 and the third one at $0.16.
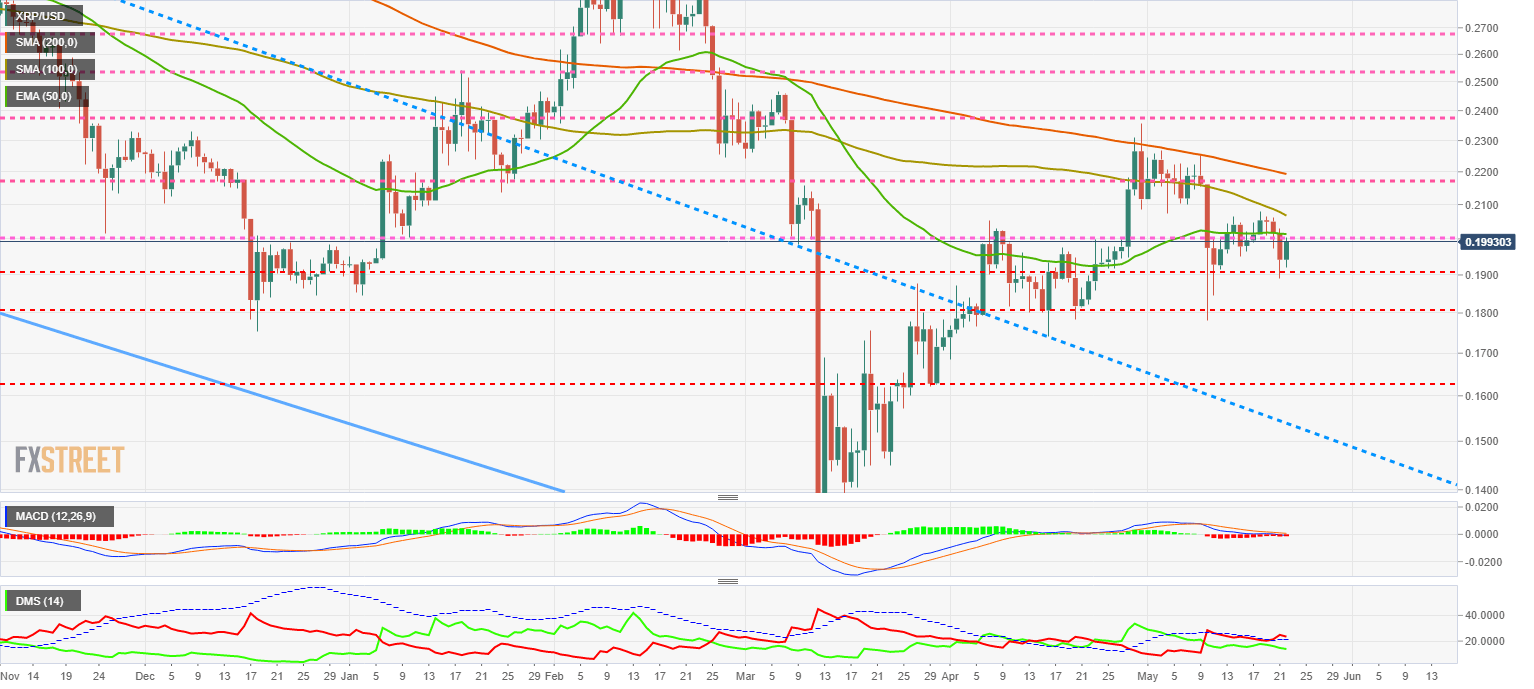
The MACD on the daily chart continues to have a completely flat profile which is supported by the neutral level of the indicator and could quickly bounce back upwards.
The DMI on the daily chart shows the bears controlling the pair with a significant advantage over the bulls. The buy-side is not optimistic in the short term and moves downwards for another day.
Author

Tomas Salles
FXStreet
Tomàs Sallés was born in Barcelona in 1972, he is a certified technical analyst after having completing specialized courses in Spain and Switzerland. He expanded his technical training following the guidance of great experts on the financial markets.


