Top 3 price prediction Bitcoin, Ethereum, Ripple: The calm before the storm
- Multiple government initiatives bring blockchain to the decision-making tables.
- Market freezes and reaches critical levels of low volatility.
- The odds of a violent exit are very high in the short term.

The strong push that the crypto ecosystem has been receiving in recent weeks is perhaps going unnoticed.
It seems that, after the announcement of the Libra project by Facebook, many governments realized that the moment of jumping into Blockchain was approaching.
The giant Facebook proposal lifted legislators and regulators from their comfortable chairs as they had to face a project backed by compelling companies. That was the first step to stop the cravings of Facebook.
Apparently, that immediately dusted studies and parked projects, and from then, many countries have presented initiatives to launch digital government coins.
Germany has been quick to transcribe the new European regulations that will allow its banks to offer services related to cryptocurrencies.
China, Turkey or Tunisia have already declared their intention to transition to digital coins. The European Union discusses this openly, and influential people in the United States claim that they are in favor of taking this path.
Many of these governments oppose decentralized cryptocurrencies projects, but they will do little in a global digital environment where legislators have little capacity for direct action.
The process seems unstoppable, which does not exclude painful moments. As the scrutiny over the different crypto projects increases, there will be a selection. Smaller projects with little adoption will disappear.
ETH/BTC Daily Chart
The ETH/BTC pair is currently trading at the 0.0202 price level, within a narrow daily price range that is taking the Average True Range (ATR) to never-before-seen levels.
The last time the ETH/BTC pair moved through similar levels was in April 2017, shortly before the pair began its biggest ever rise.
Above the current price, the first resistance level is at 0.0206, then the second at 0.022 and the third one at 0.023.
Below the current price, the first support level is at 0.020, then the second at 0.019 and the third one at 0.018.
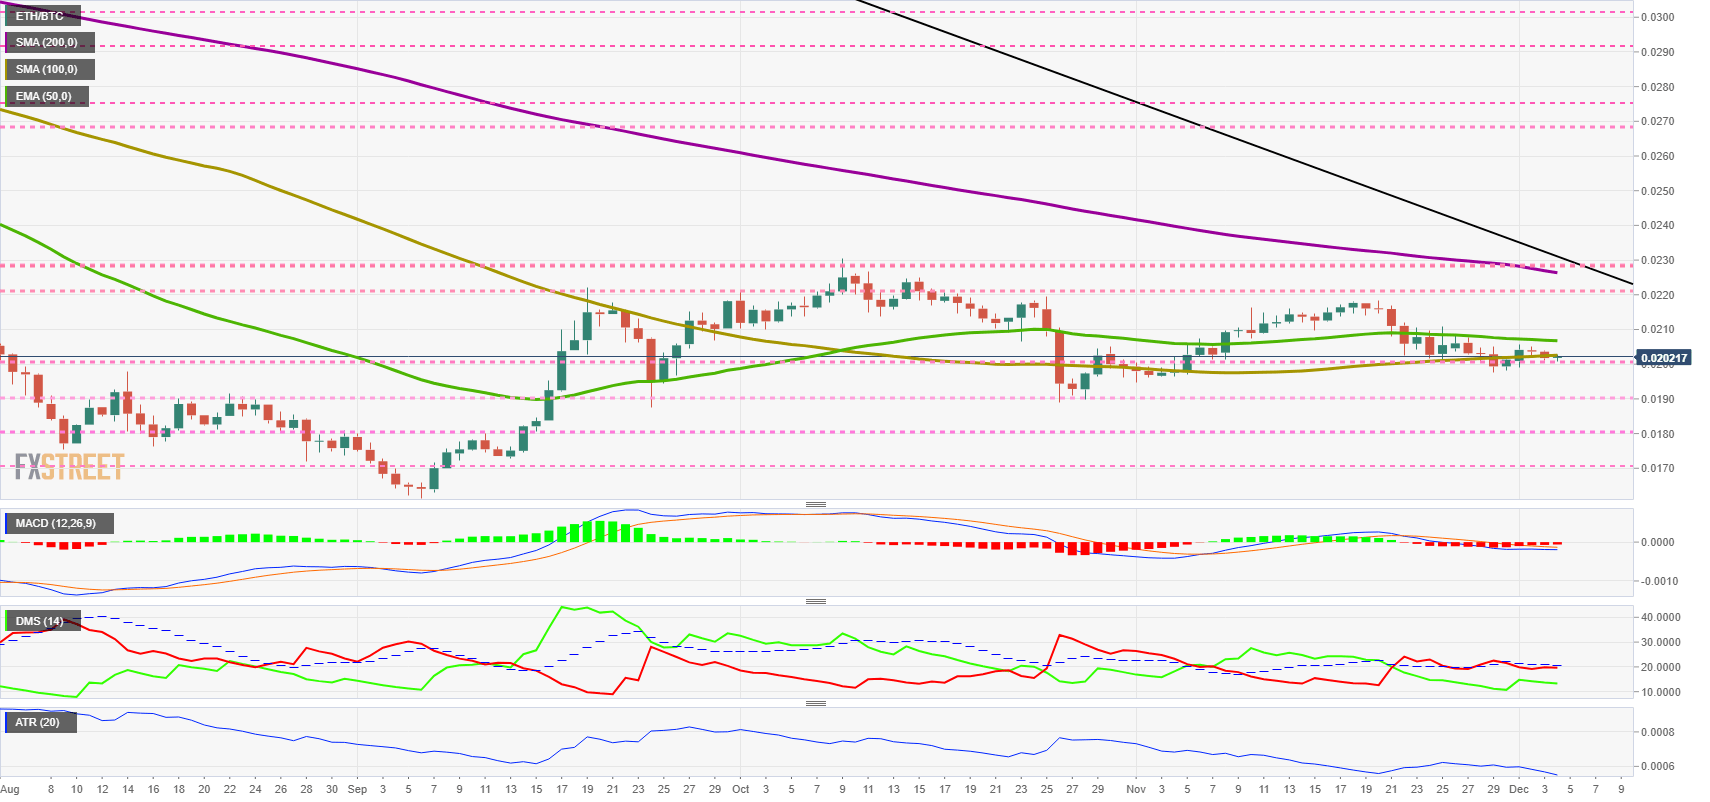
The DMI on the daily chart shows more movement than we can see in the price. Despite the low intraday range, bulls move higher. The bears, which tried to pass the ADX line again, are rejected downwards, continuing a pattern that should now lead to a change of leadership.
BTC/USD Daily Chart
The BTC/USD pair is currently trading at the $7,208 level and compresses between the $7,200 support level and the long term bearish channel ceiling at $7,300.
Above the current price, the first resistance level is at $7,300, then the second at $7,400 and the third one at $7,500.
Below the current price, the first support level is at $7,000, then the second at $6,850 and the third one at $6,750.
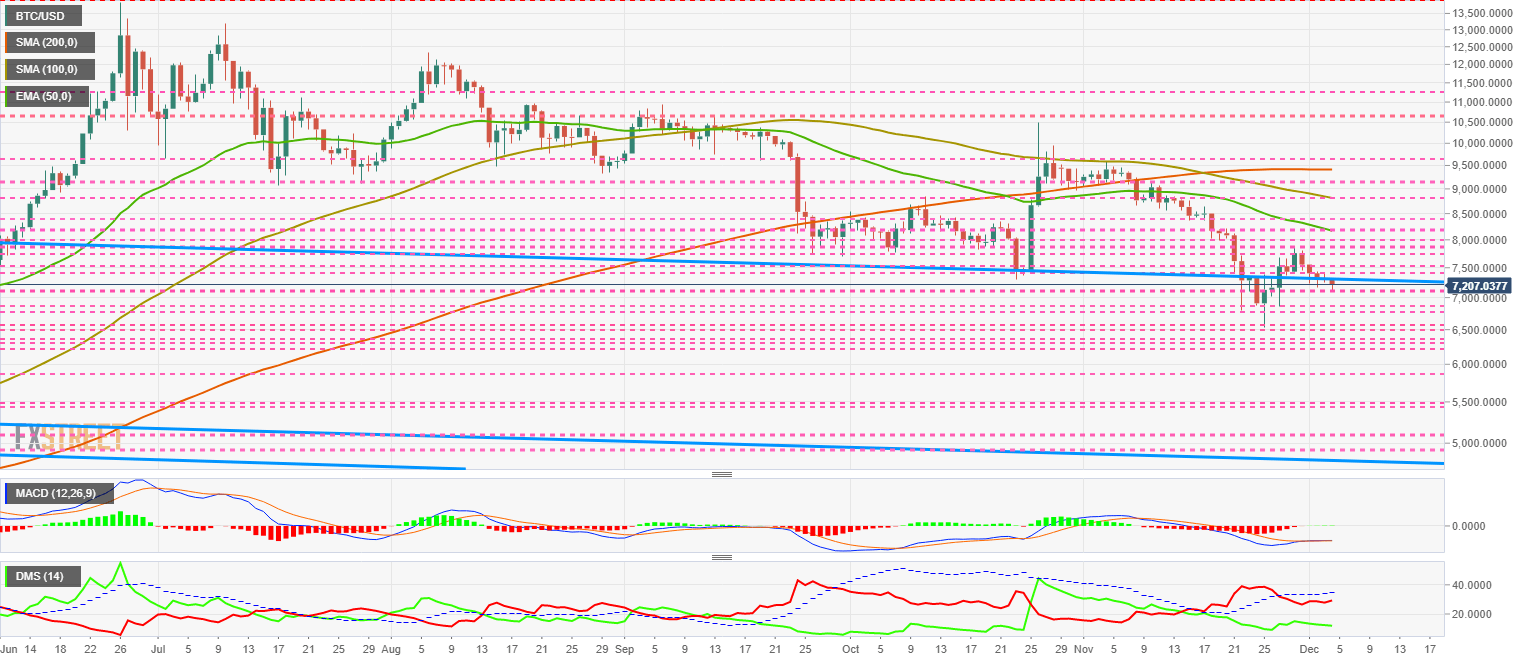
The MACD on the daily chart shows a precursor profile of an upcoming bullish cross. Statistically, the next significant move should be up.
The DMI on the daily chart shows the bears improving and trying to cross the ADX line up again. The bulls retreat and wait to see if the sellers get past the ADX line.
ETH/USD Daily Chart
ETH/USD is currently trading at the $146 price level and has chained five consecutive days of declines. The indicator structure proposes short term increases so that the current declines could be searches for better buy entry levels.
Above the current price, the first resistance level is at $150, then the second at $155 and the third one at $160.
Below the current price, the first support level is at $140, then the second at $130 and the third at $125.
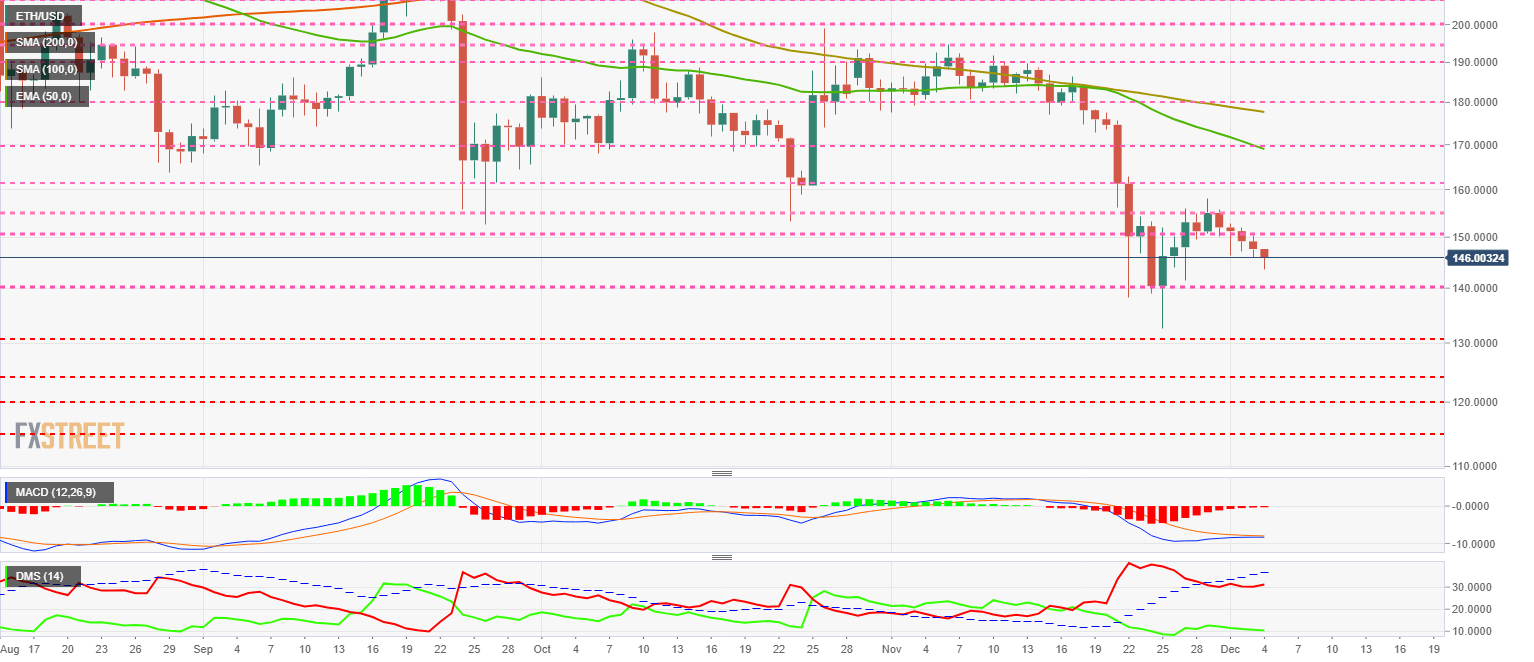
The MACD on the daily chart shows a profile similar to the one we have seen on the BTC/USD pair. The MACD on the daily chart shows a pattern similar to the one we have seen on the BTC/USD pair.
The DMI on the daily chart shows the bulls at minimum levels with no intention of competing with the bears for leadership. Sellers increase their strength and may try to break the ADX line again.
XRP/USD Daily Chart
The XRP/USD pair is currently trading at the $0.214 price level and is losing support at $0.22 again. The current situation is risky, as below this level, and up to $0.19, there is no reliable support.
Above the current price, the first resistance level is at $0.22, then the second at $0.24 and the third one at $0.253.
Below the current price, the first support level is at $0.19, then the second at $0.17 and the third one at $0.165.
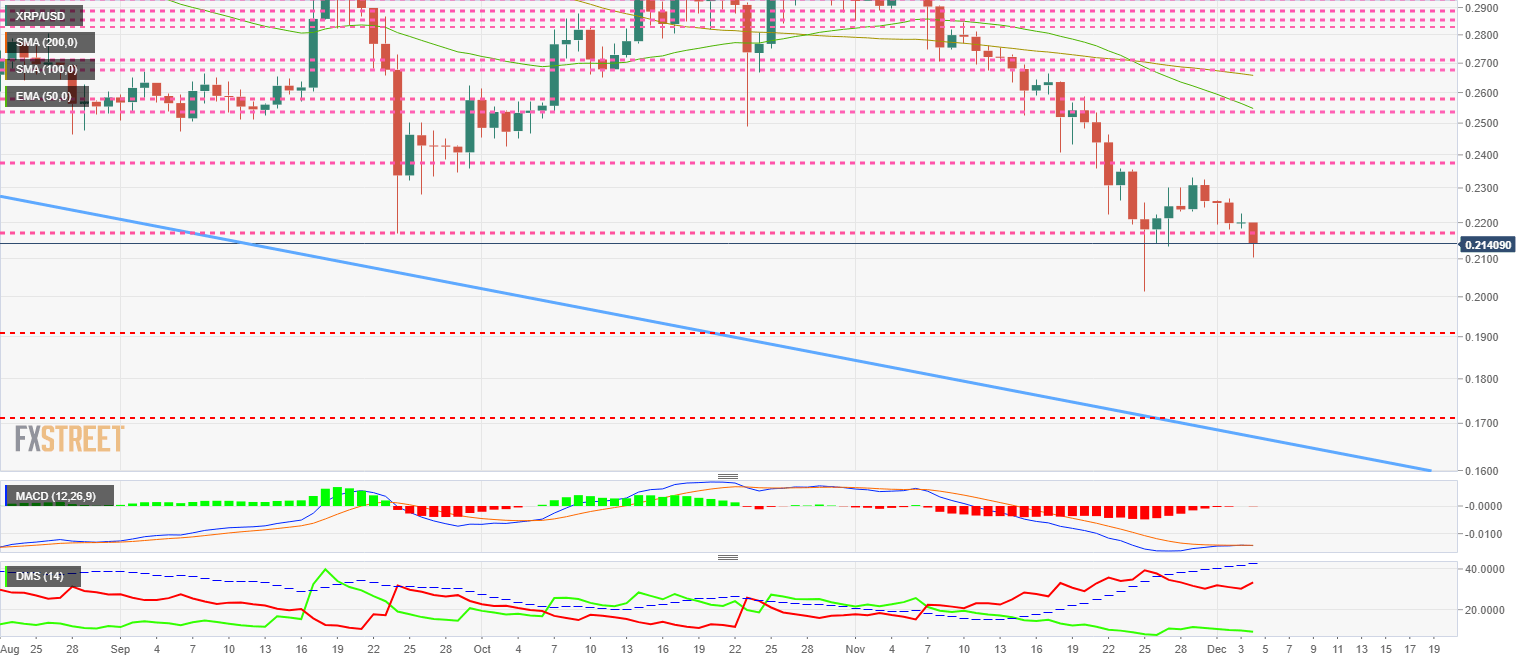
The MACD on the daily chart shows a profile suggesting upward movement in the short term.
The DMI on the daily chart shows bulls moving at deficient levels that do not usually hold for long. Bears increase their trend strength.
Get 24/7 Crypto updates in our social media channels: Give us a follow at @FXSCrypto and our FXStreet Crypto Trading Telegram channel
Author

Tomas Salles
FXStreet
Tomàs Sallés was born in Barcelona in 1972, he is a certified technical analyst after having completing specialized courses in Spain and Switzerland. He expanded his technical training following the guidance of great experts on the financial markets.


