Top 3 price prediction Bitcoin, Ethereum, Ripple: Rocketing to the moon
- Bitcoin is gold-linked to every risk-off shot.
- Ethereum and XRP are moving in phases that are not the same as those that Bitcoin is developing.
- The inflow of new money into Bitcoin is accelerating in the last few hours.

Geopolitical tension in the Middle East is rising in intensity, as is the fear of a new military escalation in a critical area for the global economy.
Capital seems to be moving towards assets considered safe such as gold or, perhaps, Bitcoin.
The net inflow of capital into the leading cryptocurrency amounts to $81.8 million in the last 24 hours, according to the CoinNess platform.
The amount is modest in absolute terms but represents 55% of the total for the last seven days, which amounts to +$181.7 million.
The market for cryptocurrencies is still relatively small, and even more so for tokens considered as a store of value.
Technically, the interest in the cryptocurrency market is in the ETH/BTC chart. The Ethereum suffered a severe setback yesterday and continues to suffer from the ultra long-term downward trend line.
ETH/BTC Daily Chart
ETH/BTC is currently trading at the price level of 0.01724 where it finds momentary ground in a price congestion support. The technical situation in this strategic pair is critical, and if it continues to move lower, we may see a mass migration of capital to Bitcoin.
Above the current price, the first resistance level is at 0.018, then the second at 0.0186 and the third one at 0.019.
Above the $0.18 level, ETH/BTC would be free of the long-term downward trend line oppression and the market would be able to move higher.
Below the current price, the first support level is at 0.017, then the second at 0.0162 and the third one at a distant 0.013, which could mean the end of the Ethereum as the eternal prince of the crypto ecosystem.
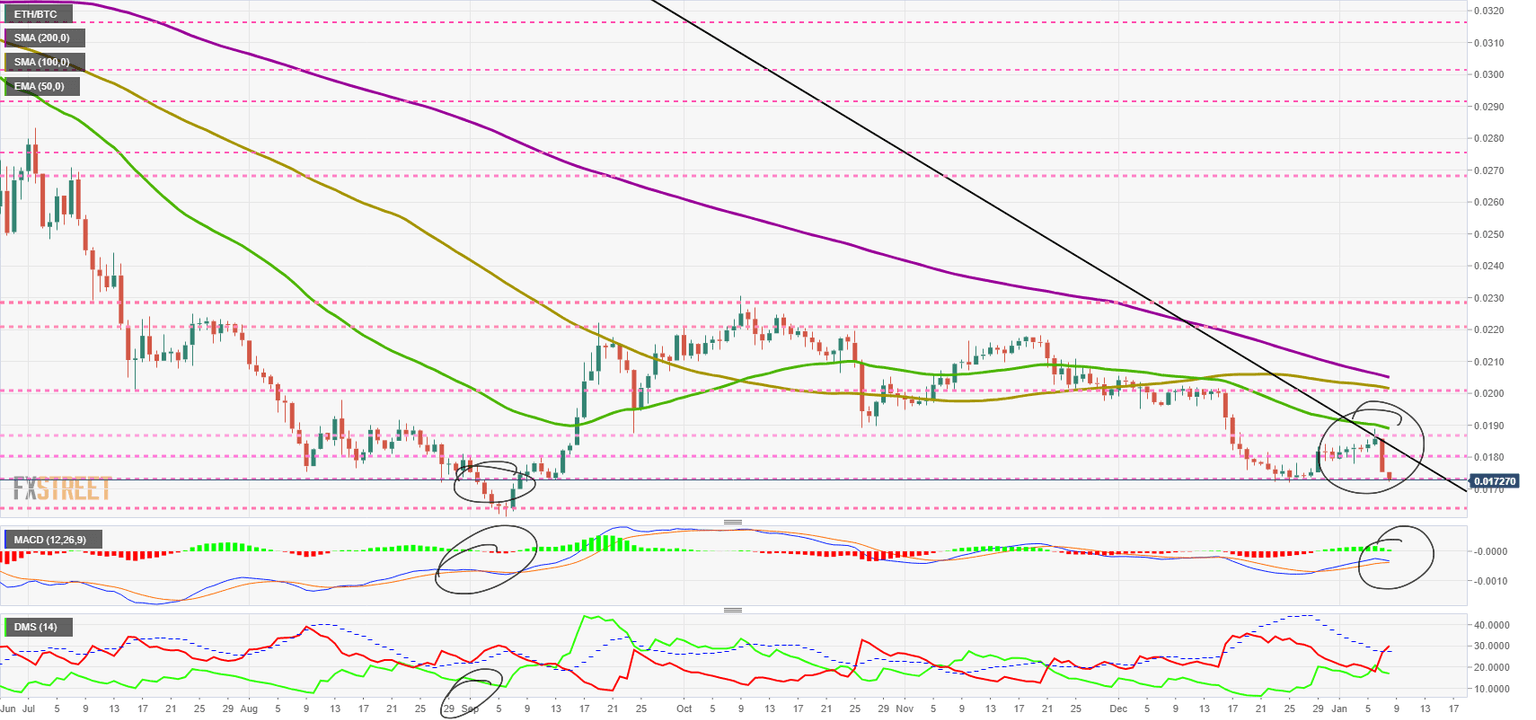
The MACD on the daily chart is about to cross over to the downside after two weeks of upward movement. The ETH/BTC pair has a habit of building up to this type of scenario and we saw a similar situation on September 5th and 6th.
The DMI on the daily chart shows how the bears were able to cross the ADX line higher yesterday, ending the previous bullish trend. The bulls are still holding on to their high levels, which may suggest that they are still confident of regaining the lead in the ETH/BTC pair.
BTC/USD Daily Chart
BTC/USD is currently trading at the $8300 price level after a price congestion resistance has halted the bullish move at the $8400 level.
The last three days record is a positive $1000, exceding both the 50-period exponential average and the 100-period simple average.
Above the current price, the first resistance level is at $8400, then the second at $8800 and the third one at $9150.
Below the current price, the first support level is at $8200; then the second is at $8000 and the third one at $7850.
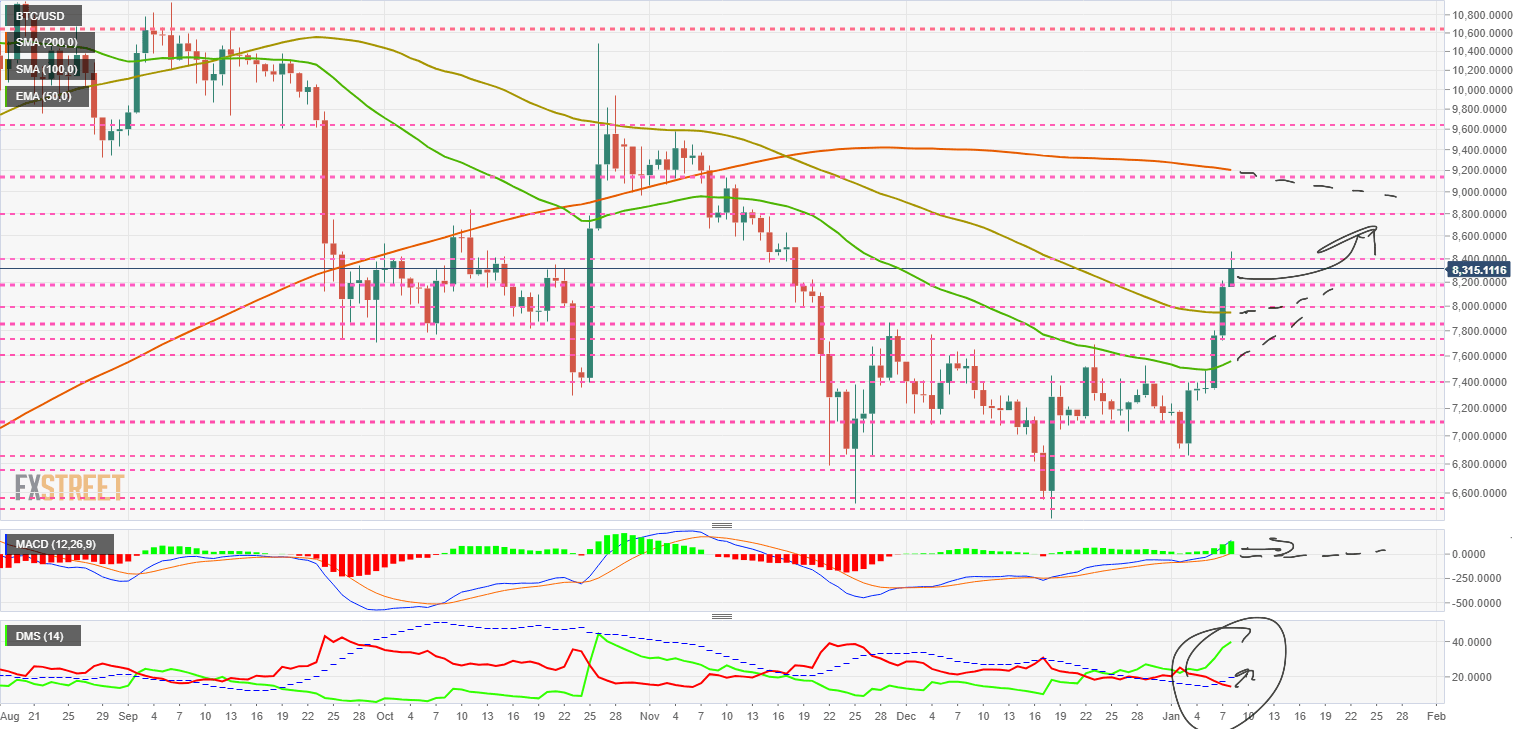
The MACD on the daily chart is improving the previous bullish profile and is beginning to show overbought in the short term. The difficulty we see in getting above the $8400 level may be the beginning of a small consolidation.
The DMI on the daily chart shows that bulls are moving at healthy trend levels, while bears are breaking through the ADX line and starting a bearish behavior pattern. According to this behavior pattern, it implies a bullish bounce from the bears in the next few days.
ETH/USD Daily Chart
ETH/USD is currently trading at the price level of $143.6 and is moving away from the session high of $147.3.
Above the current price, the first resistance level is at $150, then the second at $155 and the third one at $160.
Below the current price, the first support level is at $143, then the second at $140 and the third one at $134.5.
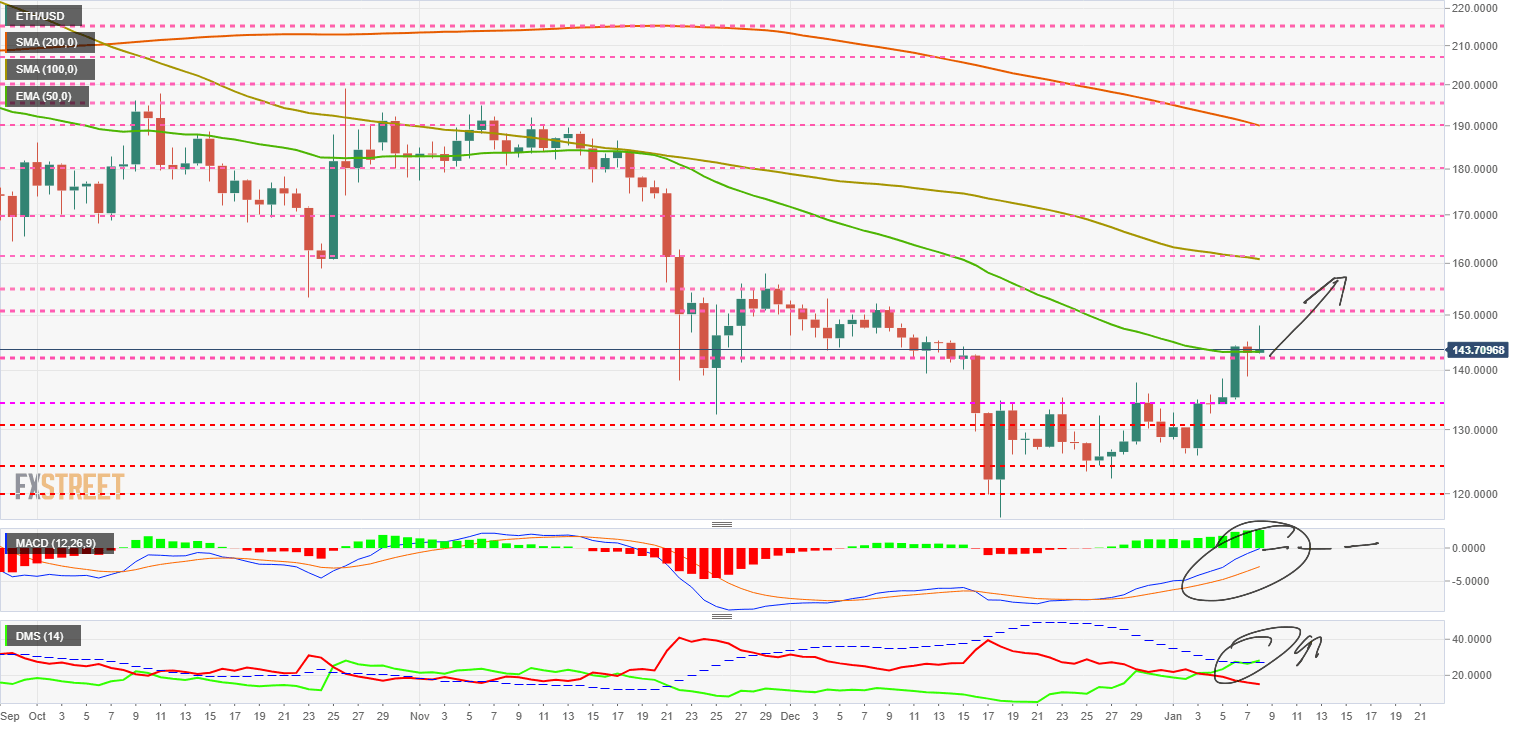
The MACD on the daily chart shows a very bullish profile but it is just below the level that separates the potentially bullish side from the bearish side. This delicate position could explain the weakness of Ethereum while Bitcoin is rising sharply.
The DMI on the daily chart shows the bulls just crossed the ADX line, a move that if confirmed, would open the door for large upward movements in the ETH/USD.
XRP/USD Daily Chart
The XRP/USD is currently trading at $0.212 and has two consecutive days of declines after the sharp rise seen on Monday. The market does not consider XRP as a value store, so on days when there are such motivations in the market, XRP usually makes it worse.
Above the current price, the first resistance level is at $0.216, then the second at $0.23 and the third one at $0.24.
Below the current price, the first support level is at $0.206, then the second at $0.195 and the third one at $0.187.
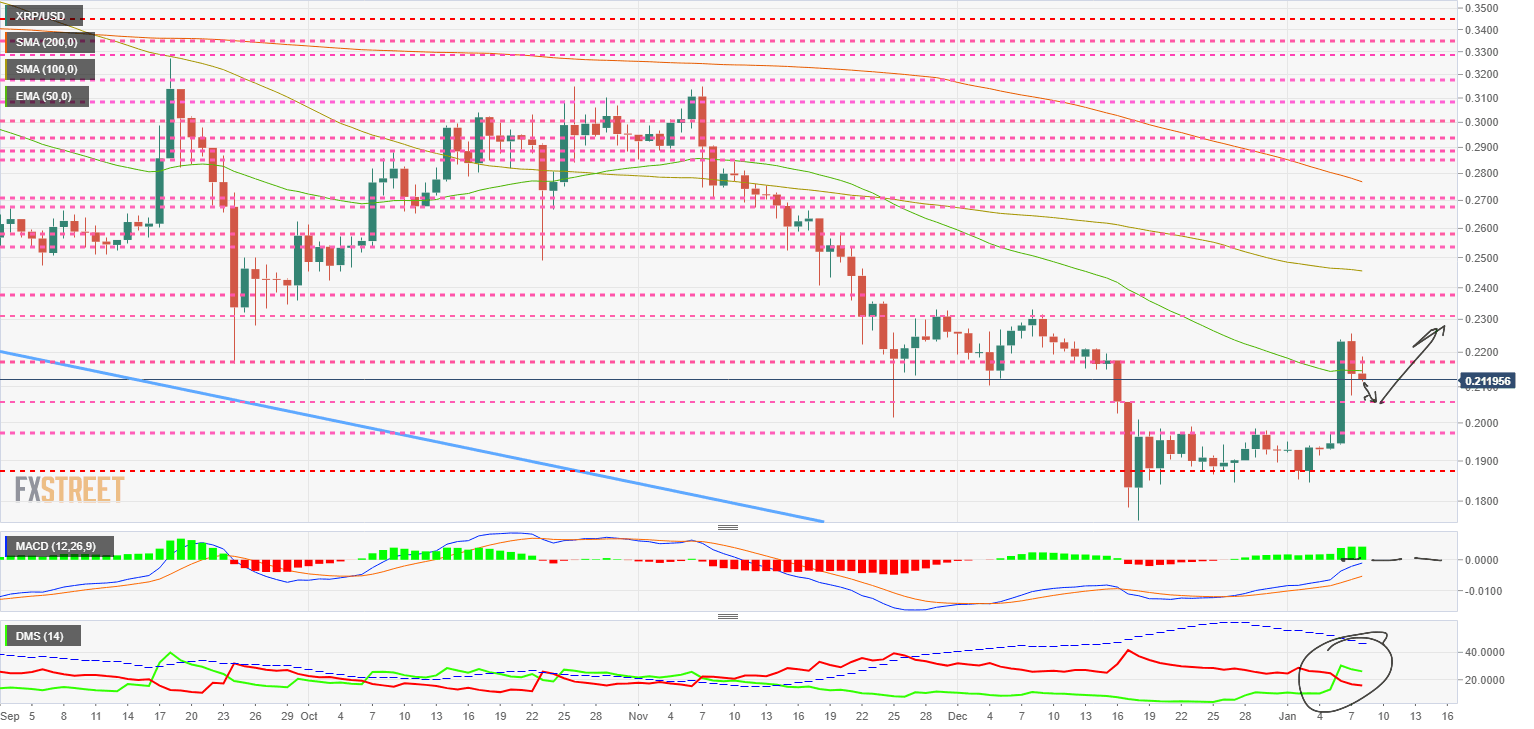
The MACD on the daily chart shows a fully bullish profile, which is not being affected by yesterday's and today's declines. The indicator's location, just below the neutral level, is an obstacle to the upward movement.
The DMI on the daily chart shows that the bulls are still in control of the XRP/USD pair, but that the declines of these two days are having an impact.
Get 24/7 Crypto updates in our social media channels: Give us a follow at @FXSCrypto and our FXStreet Crypto Trading Telegram channel
Author

Tomas Salles
FXStreet
Tomàs Sallés was born in Barcelona in 1972, he is a certified technical analyst after having completing specialized courses in Spain and Switzerland.


