Top 3 Price Prediction Bitcoin, Ethereum, Ripple: Risky games in the edge zone
- Today is a pull-back day which can define the course of the next few weeks.
- Technical setups point upwards in a challenging area potentially limiting the bullish development.
- Ripple's first upward attempt fails at opening European session.

Wednesday was a technically special day for Bitcoin, but this Thursday it is even more so.
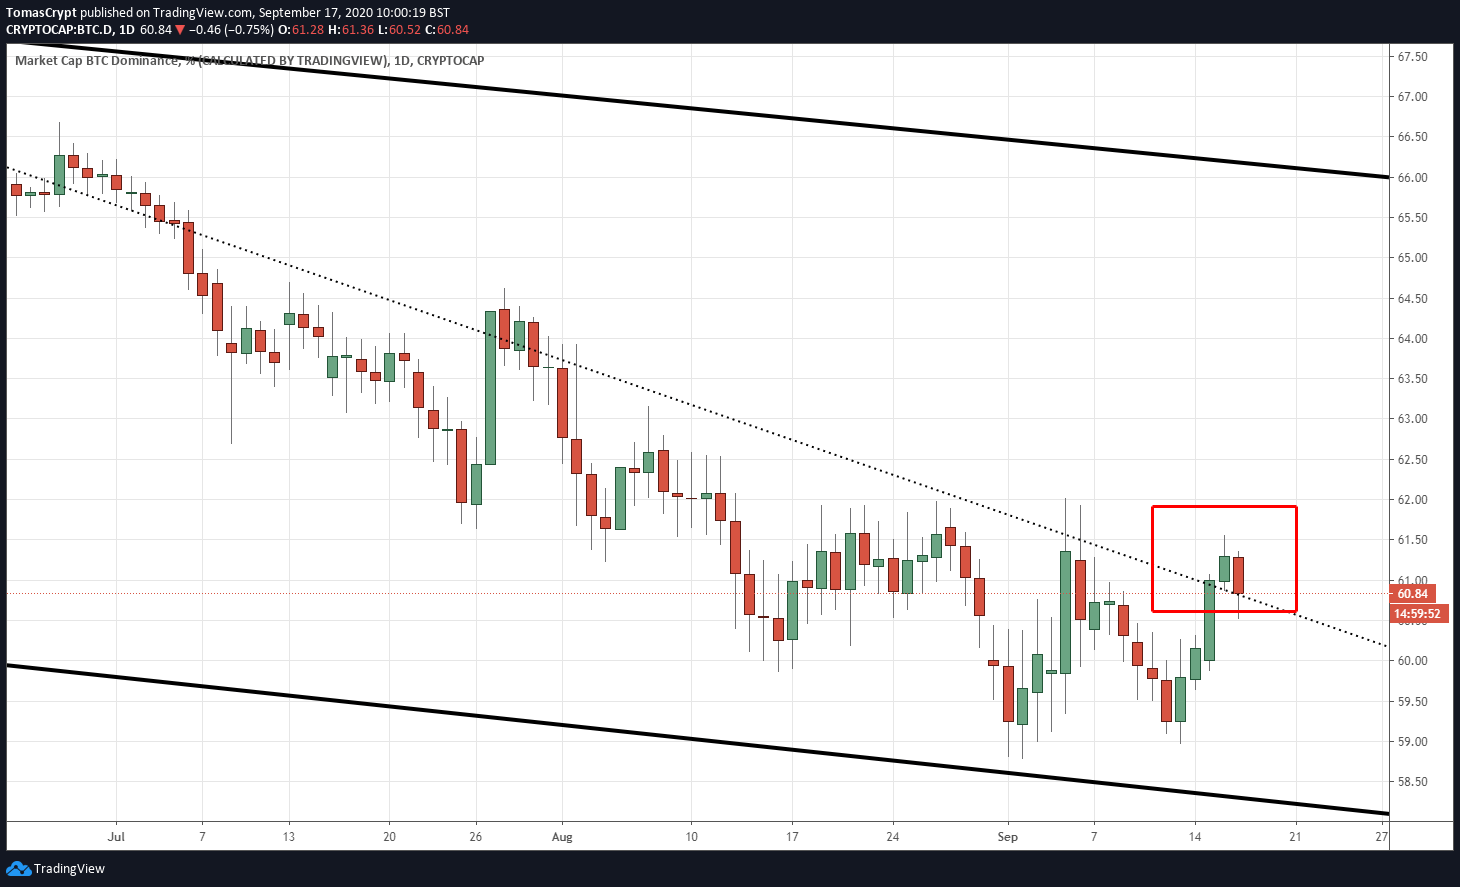
Bitcoin struck a significant blow in the war for dominance by breaking up key resistance on the way to regaining lost market share.
Now, it comes to the expected technical setback and the verification of whether the break is valid or will fail as occurred in late June or early August.
The Bitcoin dominance chart has no margin for the lower price zone, so you don't have much choice if you want to avoid the disaster of breaking a bearish channel through the lower support.
It seems clear to the market that Bitcoin has not reached the target despite yesterday's victory. The sentiment level is improving and is in the low range of the neutral zone with 48 points.
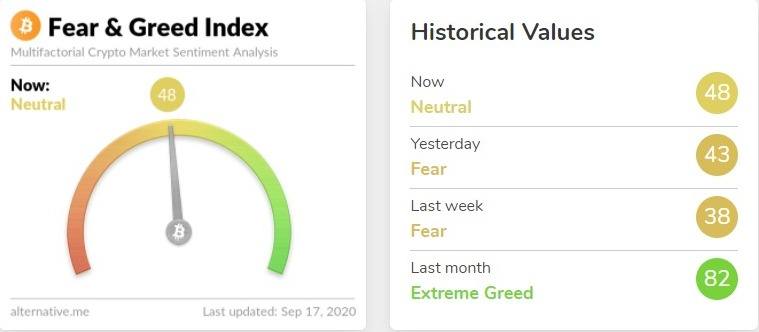
Source: alternative.me
ETH/BTC Daily Chart
The ETH/BTC pair is currently trading at 0.0349 and returning to the level it was at the beginning of the week.
Above the current price, the first resistance level is at 0.035, then the second at 0.036 and the third one at 0.0372.
Below the current price, the first support level is at 0.0344, then the second at 0.033 and the third one at 0.0315.
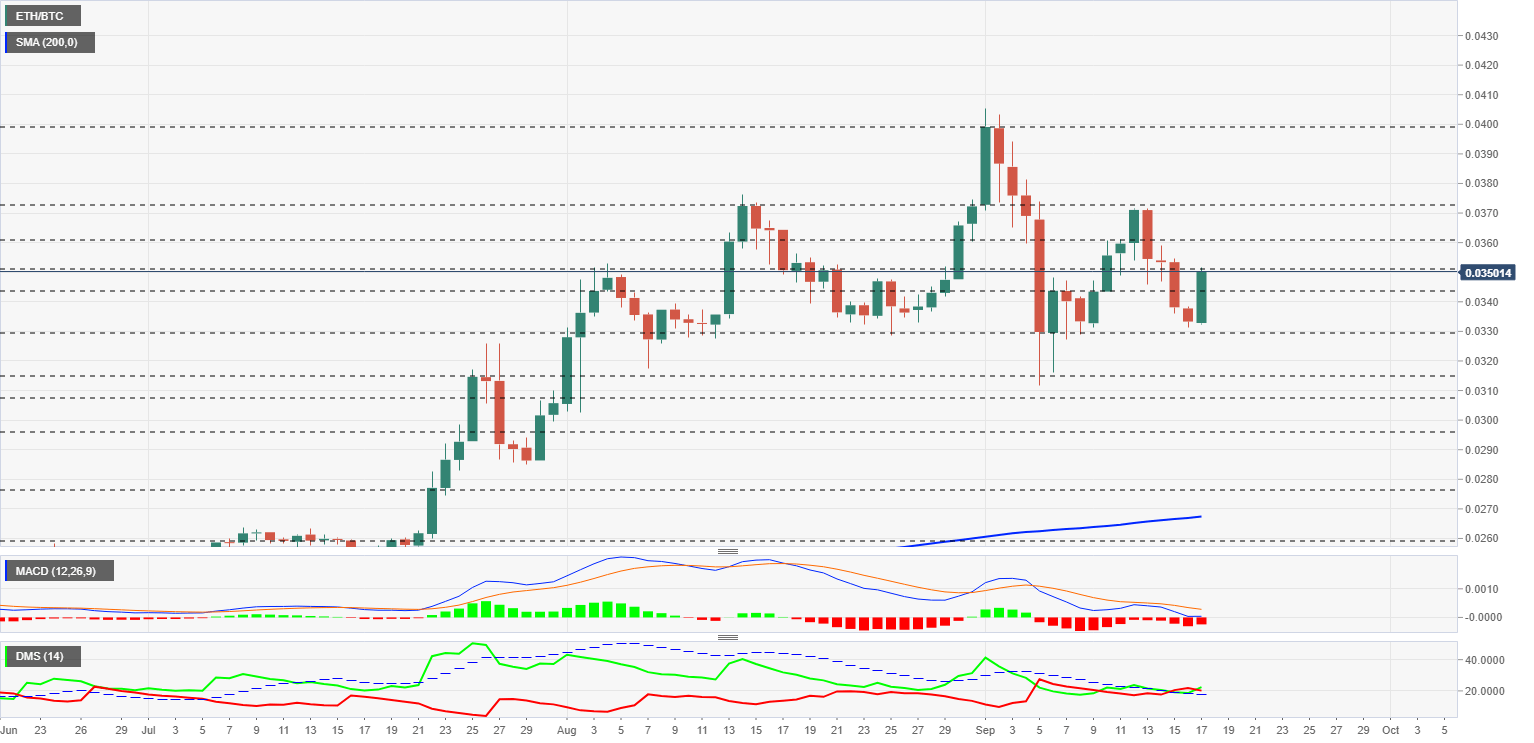
The MACD on the daily chart finds support at the neutral level of the indicator and draws strength for today's rally. A breakout of the zero level MACD would cause panic and Ethereum selling would accelerate.
The DMI on the daily chart shows the bulls momentarily leading the pair. The two sides of the market are moving above the ADX line, a position that will favor the speed of the price in the next move.
BTC/USD Daily Chart
The BTC/USD pair is currently trading at the price level of $10907 and is once again losing the price resistance level of $11000 gained yesterday. Technical indicators are favourable to the buy-side of BTC/USD, but the structure needs to develop.
Above the current price, the first resistance level is at $11100, then the second at $11370 and the third one at $11950.
Below the current price, the first support level is at $10450, then the second at $10235 and the third one at $9850.
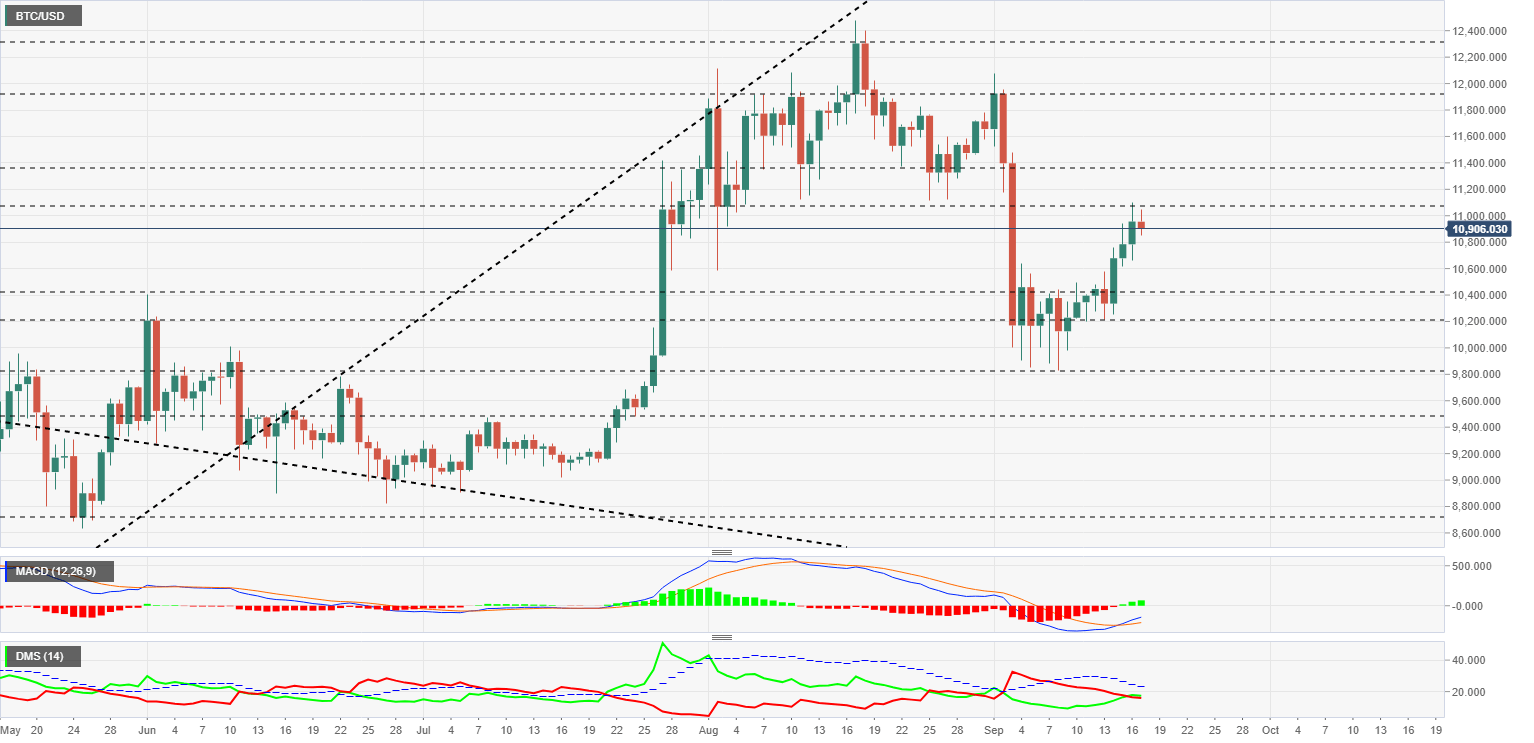
The MACD on the daily chart shows a bullish cross that is not as positive as it could be for the position regarding the neutral level. The moving averages that build up the indicator have little space to acquire the most appropriate profile for a successful crossing.
The DMI on the daily chart shows bulls with a small advantage over bears. The two sides of the market on the BTC/USD pair move below the ADX line, which will complicate any attempt to acquire trend strength.
ETH/USD Daily Chart
The ETH/USD pair is currently trading at the $381 price level and has been trading for eight consecutive days in a narrow range between the $390 and $360 price levels.
Above the current price, the first resistance level is at $390, then the second at $415 and the third one at $440.
Below the current price, the first support level is at $362, then the second at $318 and the third one at $290.
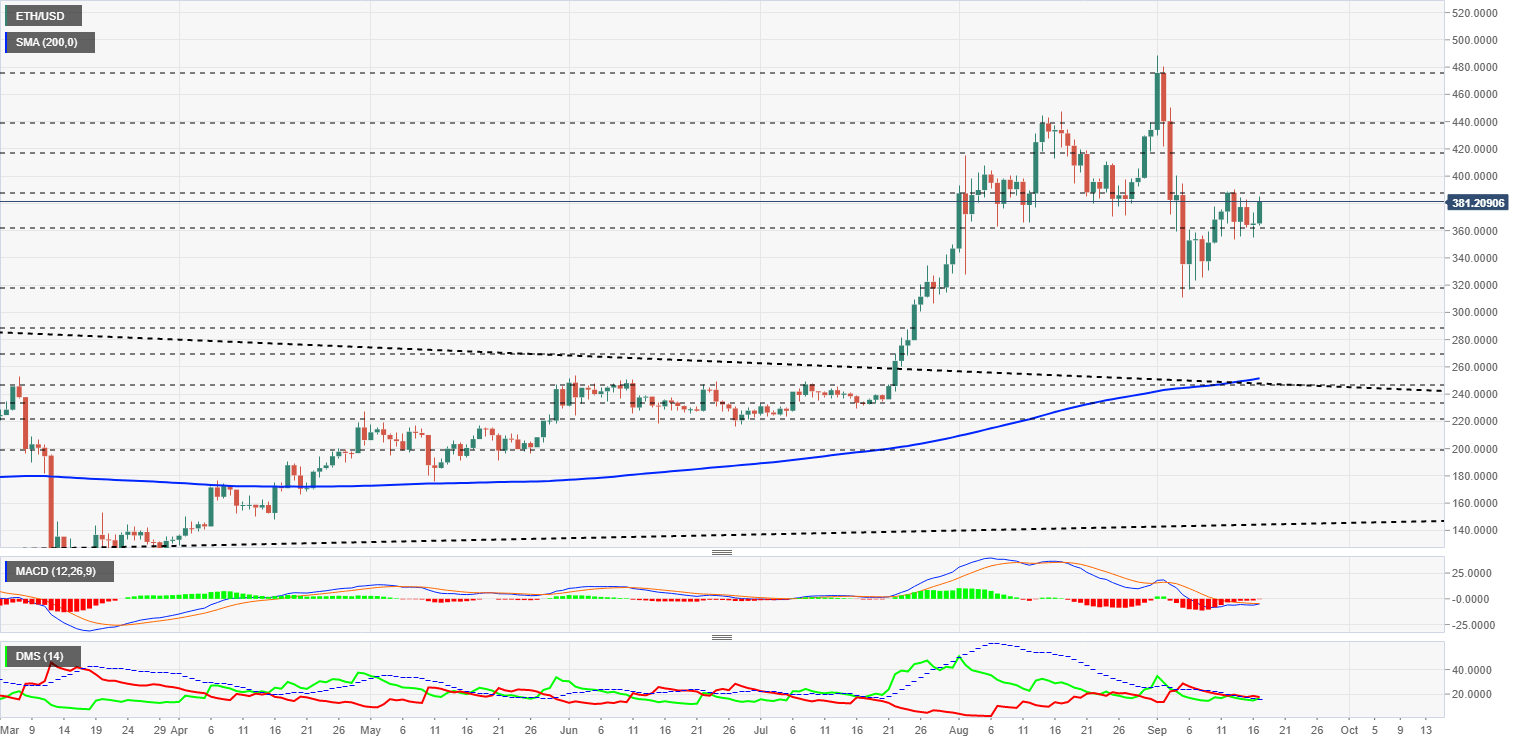
The MACD on the daily chart has a side profile that makes a possible bullish cross very difficult. The moving averages that make up the indicator move close to the level or indicator, leaving very little room to configure correctly for an optimal upward movement.
The DMI on the daily chart shows bears leading the ETH/USD pair by a few points. The two sides of the market are above the ADX line and make it easy for the winning side to gain trending strength.
XRP/USD Daily Chart
The XRP/USD pair is currently trading at the price level of $0.248 after an early morning failure at the price congestion resistance level of $0.255.
Above the current price, the first resistance level is at $0.255, then the second at $0.262 and the third one at $0.275.
Below the current price, the first support level is at $0.242, then the second at $0.235 and the third one at $0.229.
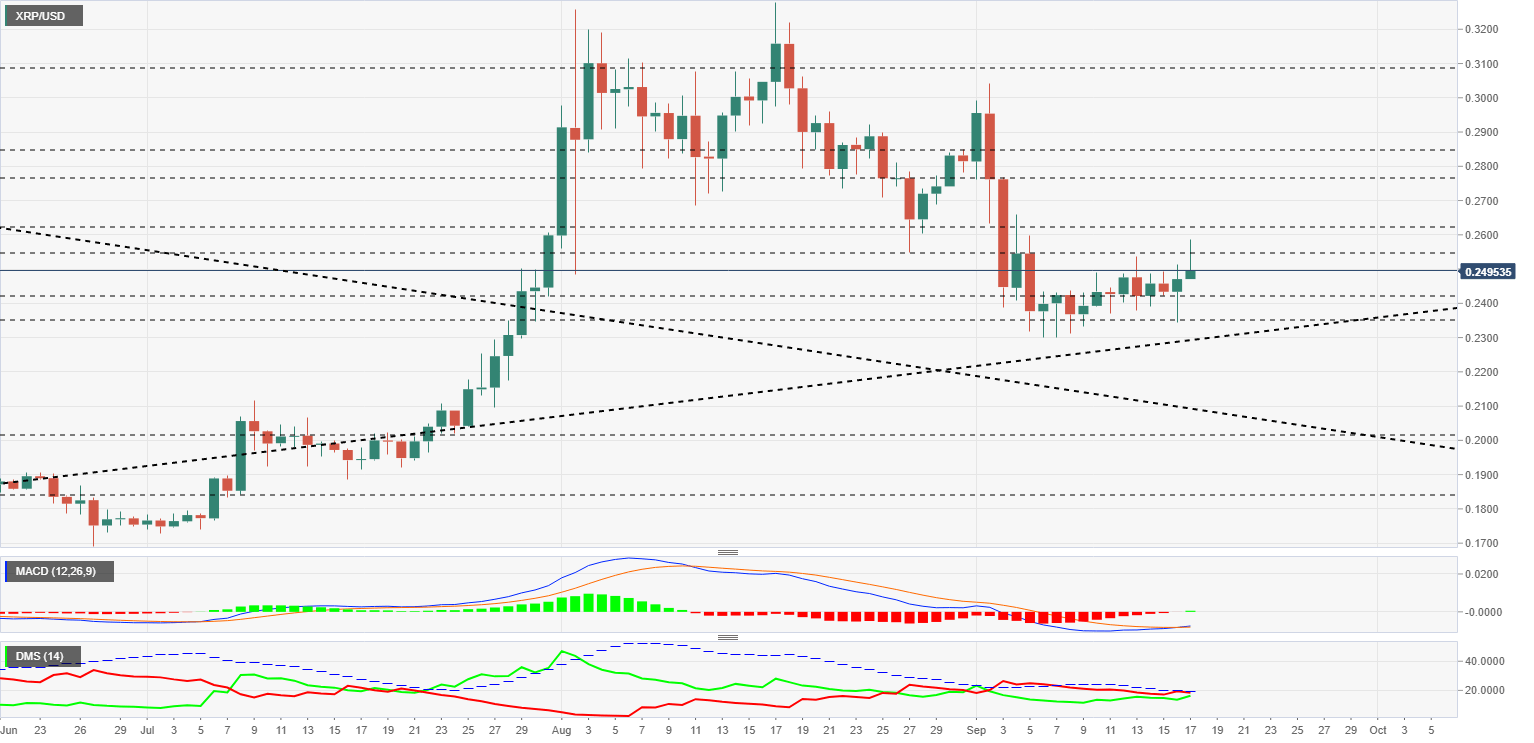
The MACD on the daily chart shows a full bullish cross, although in a very early stage. The position of the moving averages does not support a bullish cross to the positive side of the indicator.
The DMI on the daily chart shows both sides of the market compressed below the ADX line. This position may favour the winning side of this confrontation to enjoy a strong momentum after the moment of the technical breakout.
Author

Tomas Salles
FXStreet
Tomàs Sallés was born in Barcelona in 1972, he is a certified technical analyst after having completing specialized courses in Spain and Switzerland. He expanded his technical training following the guidance of great experts on the financial markets.