Top 3 Price Prediction Bitcoin, Ethereum, Ripple: Market share war shakes crypto market
- Bitcoin loses strength versus the altcoins, which are more resistant to falls.
- The market is once again feeling fear, according to sentiment indicators.
- The XRP, the last one to reach the market share battle, shows strong growth potential.

The cryptocurrencies market started the last week of May with significant drops that closed last week below the $9000 price level for Bitcoin.
Ethereum confirms the market's weakness in the short term as it closed yesterday at the price level of $195.5. Closing below the $200 level with such a small margin shows that the bulls are not in the business of defending the price structure to keep it up.
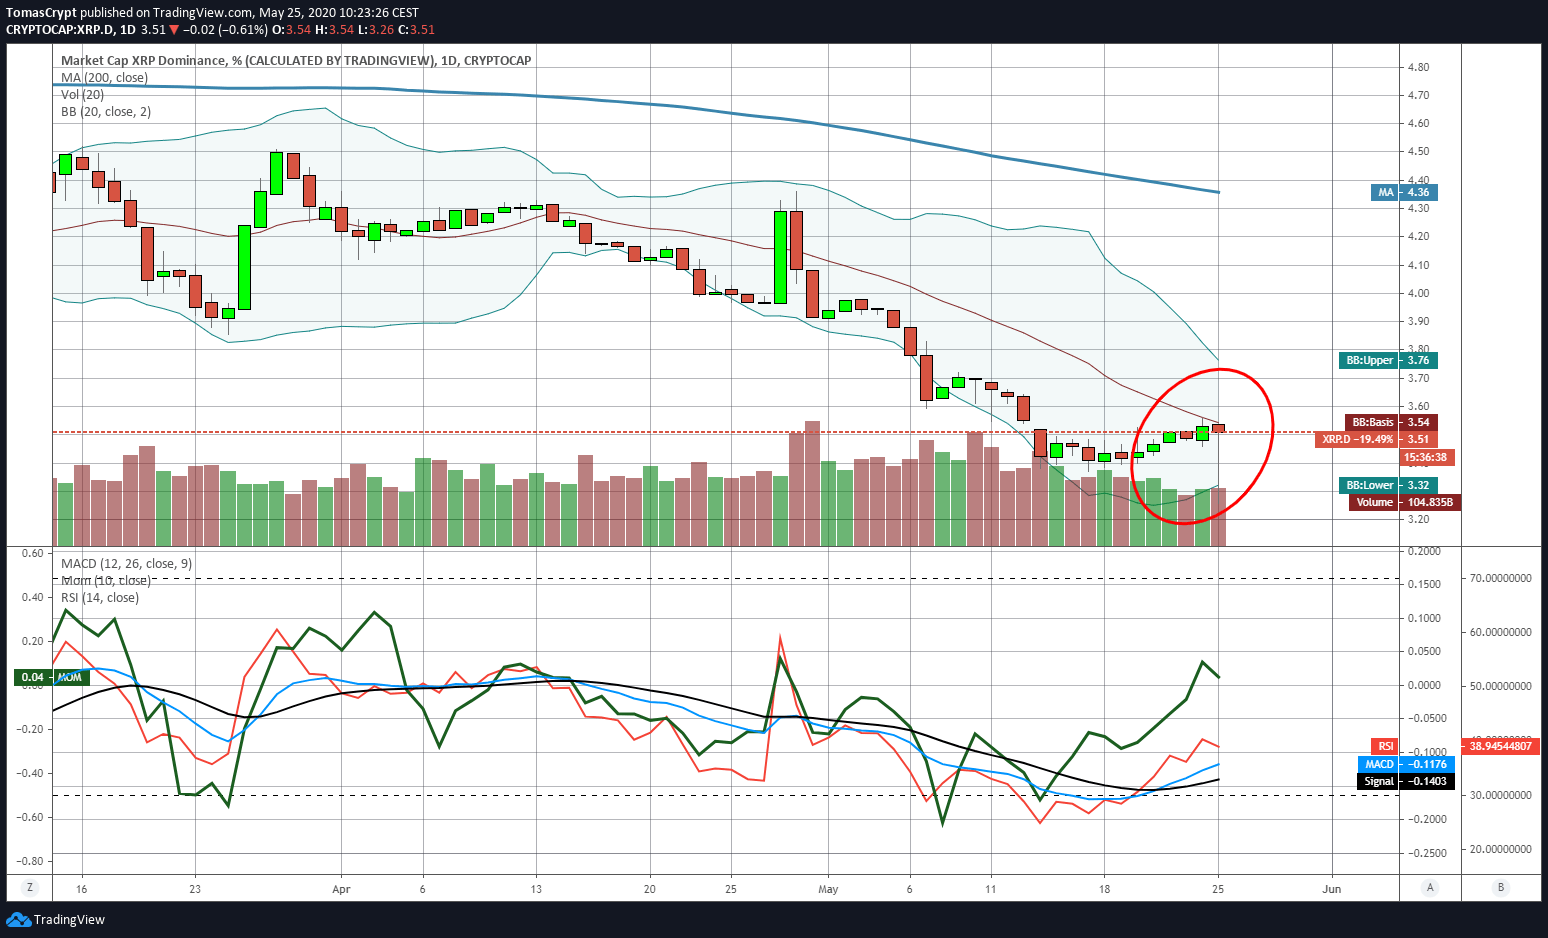
The dominance charts confirm the trend change initiated last week and Bitcoin continues to lose market share against Ethereum and other Altcoins.
XRP recovers the pace of improvement in market share in a significant way after a volatile session that has taken it to a new relative low at the 3.24% dominance level. The technical structure of the XRP dominance chart is strongly bullish. The short-term target is at 3.8%, and the medium-term target is at 4.3%.
The media focus is starting to focus on the future release of version 2.0 of the Ethereum network. The market expects a first test of the new version after the summer.
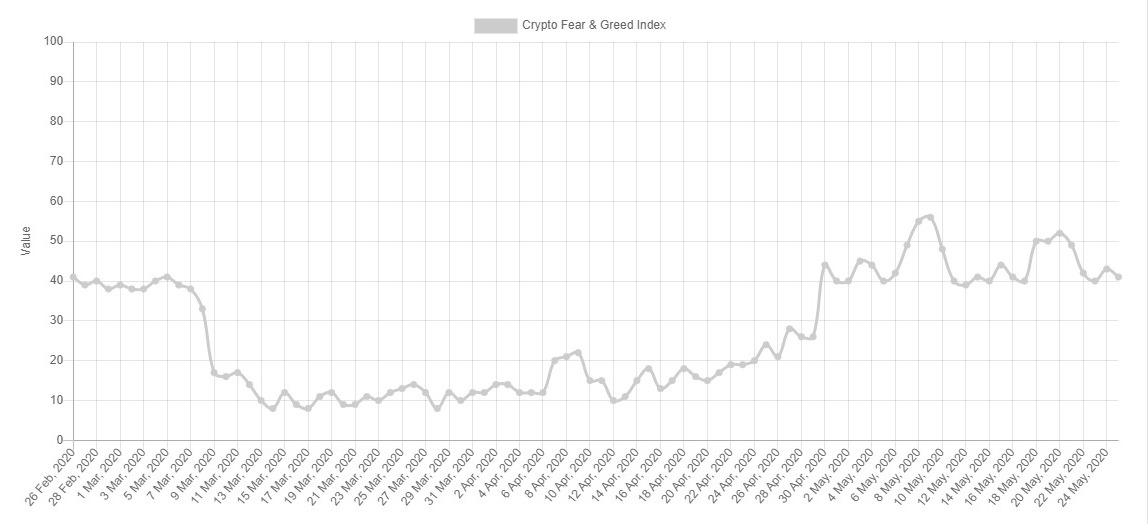
Source: alternative.me
Fear has again spread among crypto market participants, and today it drops to level 41 after reaching level 50 last week.
ETH/BTC Daily Chart
The ETH/BTC pair is rushing upwards and is already moving above the 50-day exponential moving average.
Above the current price, the first resistance level is at 0.0237, then the second at 0.024 and the third one at 0.0248.
Below the current price, the first support level is at 0.023, then the second at 0.022 and the third one at 0.0217.
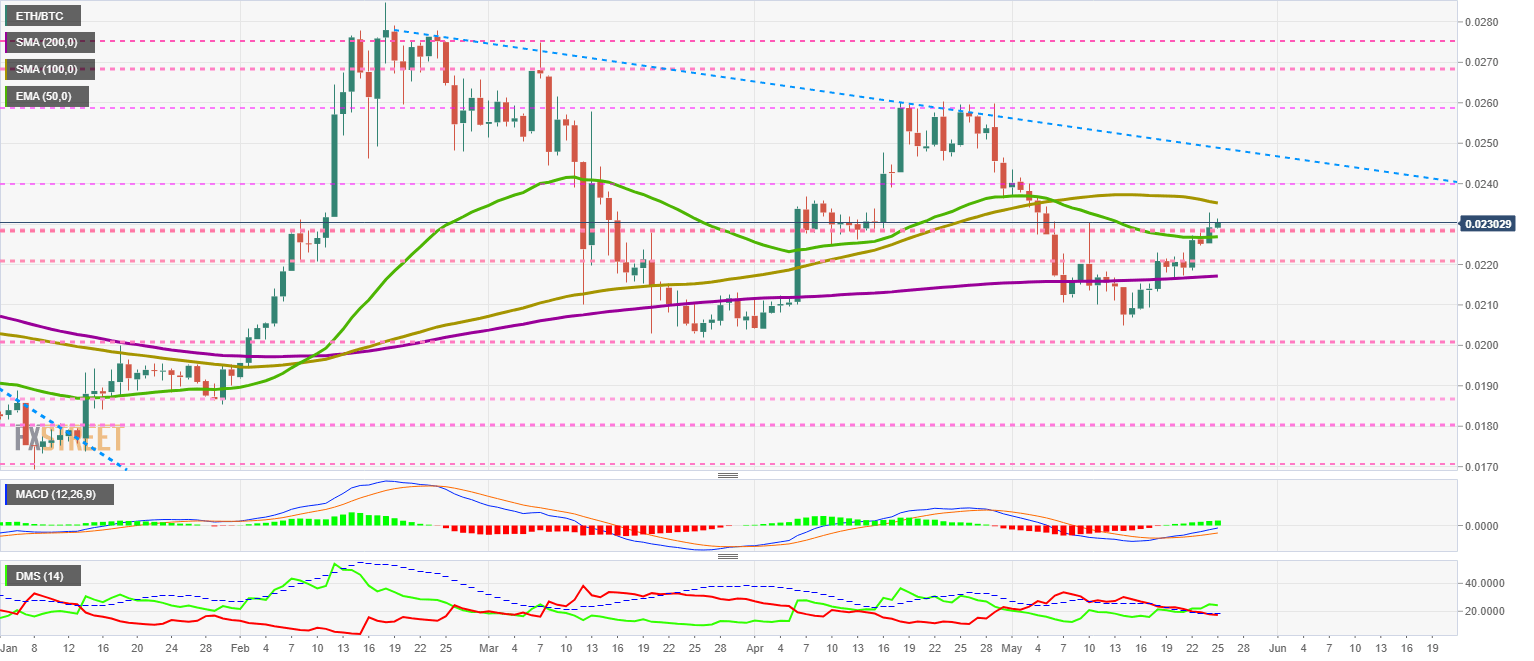
The MACD on the daily chart continues its upward trend and is approaching the neutral level of the indicator where resistance to the upward movement will increase.
The DMI on the daily chart shows the bulls controlling the ETH/BTC pair but without enough of a lead to rule out a change in direction.
BTC/USD Daily Chart
The BTC/USD pair is currently trading at the $8830 price level and is attempting to regain the $8800 price support level it lost at yesterday's close.
The 200-day simple moving average is leaning dangerously low and could be signalling continued downward movement towards the $7000-$7500 levels.
Above the current price, the first resistance level is at $9150, then the second at $9500 and the third one at $10,000.
Below the current price, the first support level is at $8550, then the second at $8150 and the third one at $8000.
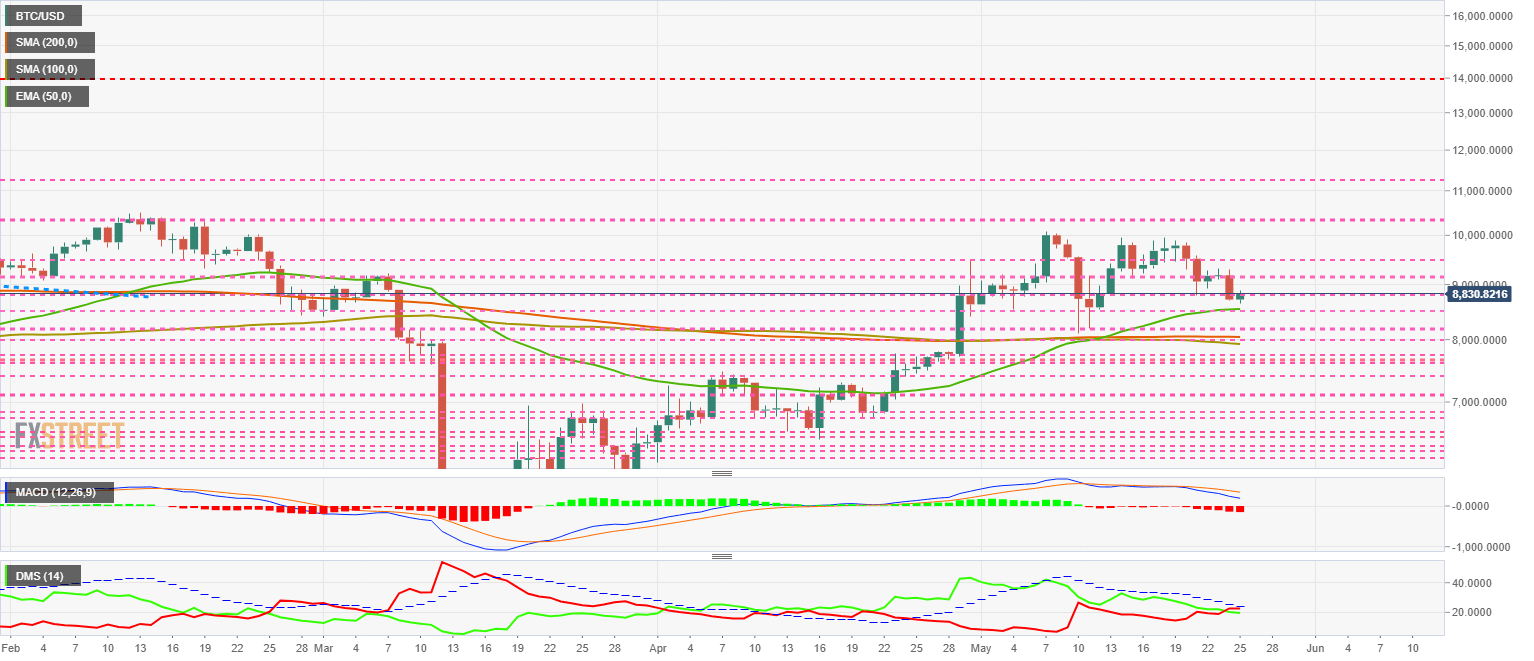
The MACD on the daily chart increases the bearish profile – both in slope and in the opening between the average lines.
The DMI on the daily chart shows bears gaining control of the pair momentarily. The bears are very close and may try to regain the lead over BTC/USD at any time.
ETH/USD Daily Chart
The ETH/USD pair is currently trading at $203.4. The weekly close at $199.5 is a dangerous sign of weakness that we should be aware of before we rush to buy.
Above the current price, the first resistance level is at $207.5, then the second at $215 and the third one at $225.
Below the current price, the first support level is at $200, then the second at $195 and the third one at $190.
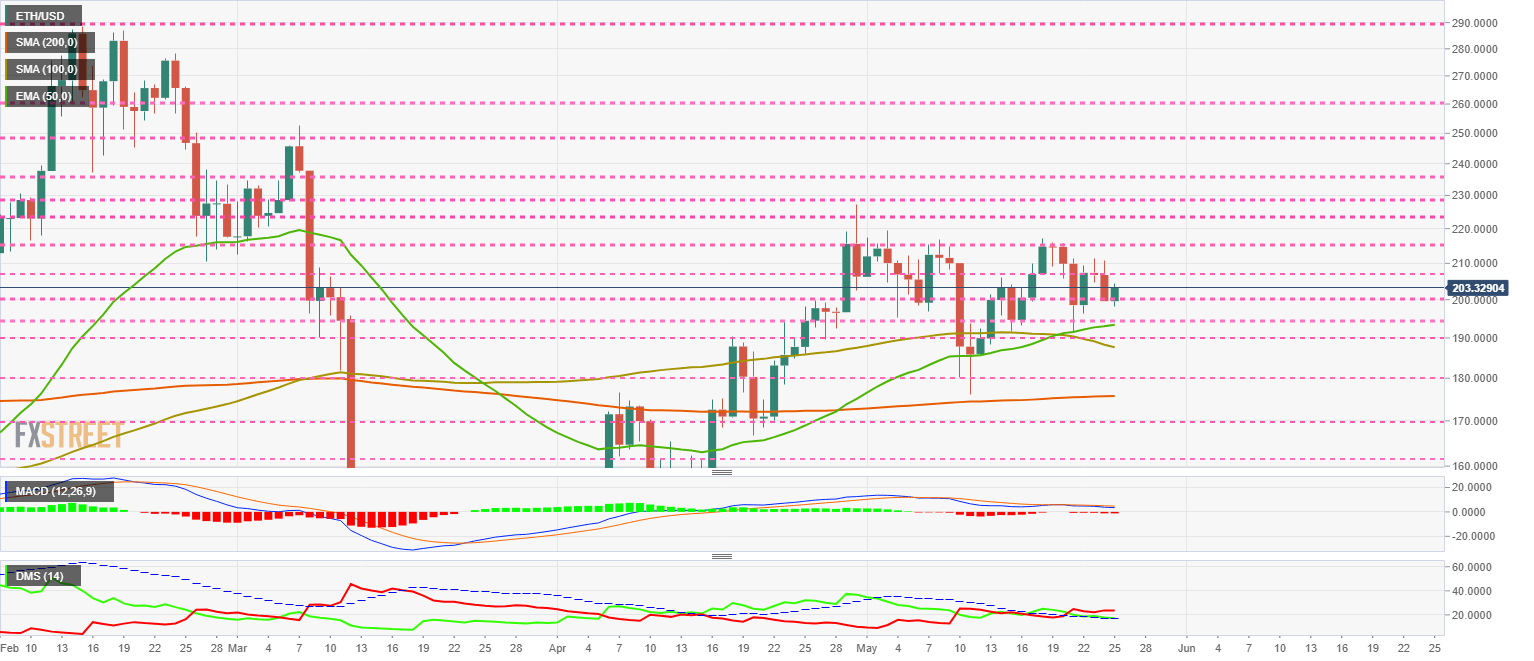
The MACD on the daily chart shows a slightly downward sloping side profile, open the door to an unexpected upward movement.
The DMI on the daily chart shows bears controlling the pair. The bulls are still above the ADX line, which would allow them to move up with little resistance.
XRP/USD Daily Chart
The XRP/USD pair is currently trading at the price level of $0.194. The technical structure denies the bullish potential it was hinting at during last Friday's session.
Above the current price, the first resistance level is at $0.20, then the second at $0.217 and the third one at $0.24.
Below the current price, the first support level is at $0.19, then the second at $0.18 and the third one at $0.162.
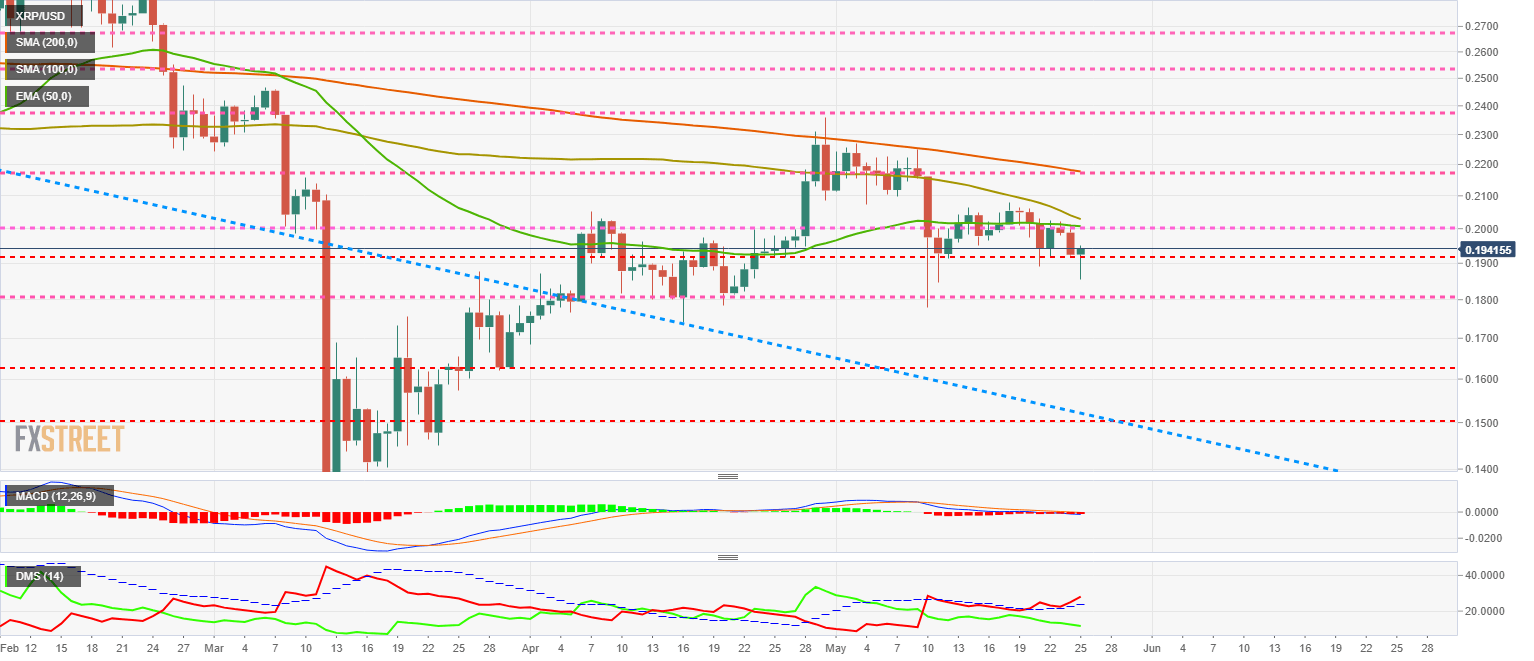
The MACD on the daily chart shows a completely flat profile and in the neutral zone of the indicator. This structure does not provide any visibility about the future development of the price.
The DMI on the daily chart shows the bears gaining strength and with a lot of advantage against a buying side that keeps losing levels constantly.
Author

Tomas Salles
FXStreet
Tomàs Sallés was born in Barcelona in 1972, he is a certified technical analyst after having completing specialized courses in Spain and Switzerland. He expanded his technical training following the guidance of great experts on the financial markets.


