Top 3 price prediction Bitcoin, Ethereum, Ripple: Market ready to launch, not knowing who will lead it
- The market hesitates between Bitcoin and Ethereum to lead the next bullish run.
- Ethereum will suffer heavy losses if not in command.
- Bullish clarity may call for terminal motivation bearish jerks.

All stories that are important enough to be told have moments of suspense that keep the audience on edge.
One of these stories is the intense and profound relationship between Ethereum and Bitcoin. The story approaches a moment of decision, where what happens can mark the future, not only of the relationship between the King and the Prince but of the global cryptocurrencies market.
The ETH/BTC pair went into the bearish mode in June 2017 when it reached a value of 0.15. Since then, the relationship has suffered from intense ups and downs until it is currently at its lowest level in the 0.020 range.
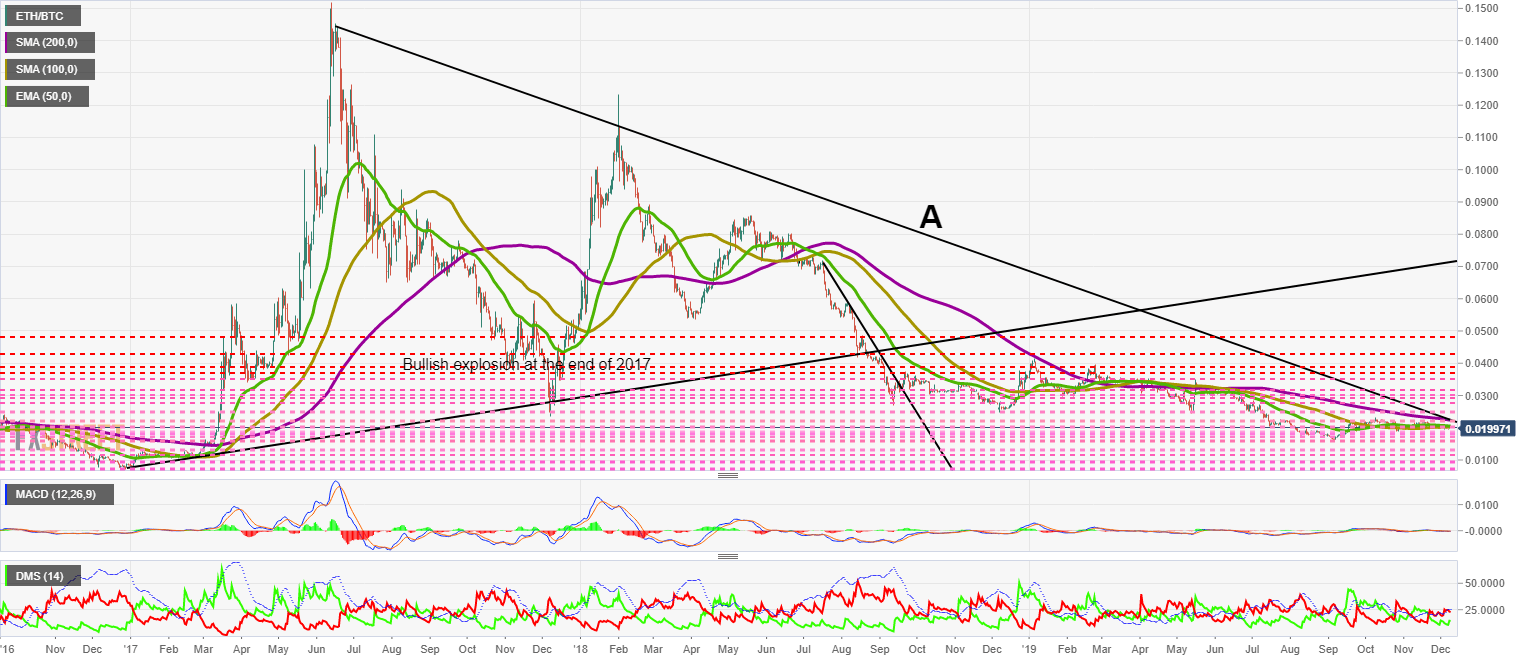
The current bearish trend line (A) has been thrown over the spot price and firmly pushes the price down. The hypothetical scenarios are simple, either exceed the trend line and survive or are crushed and take direction to the residual value of Ethereum concerning Bitcoin.
The market kept the hope that the implementation of the Istanbul update, part of the way to the PoS (Proof of Stake) protocol, would boost the bullish side of the pair, but it has not.
The ETH/BTC pair has margin until the end of the current month to define itself, although if volatility increases, we will be able to see the end of the story much earlier.
ETH/BTC Daily Chart
The ETH/BTC pair is currently trading at the 0.0199 price level and remains below the critical support level, crushing the patience of traders who know the importance of the 0.020 level.
Above the current price, the first resistance level is at 0.0205, then the second at 0.0223 and the third, already within a new scenario, at 0.025.
Below the current price, the first support level is at 0.019, then the second at 0.018 and the third one at 0.017.
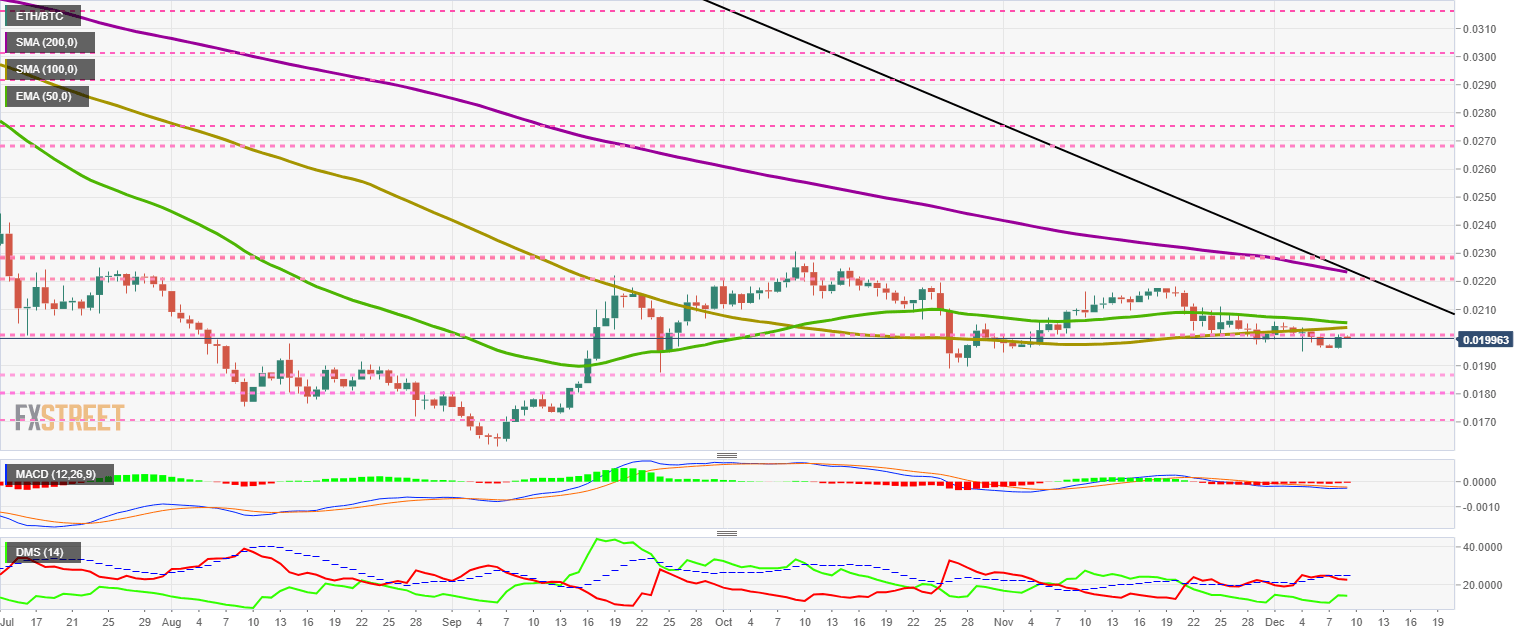
The MACD on the daily chart shows a flat profile, reflecting the pair's declining volatility. The last few sessions have gained some uptrend, but it is not moving to the price at the moment.
The DMI on the daily chart shows bears with a mild bullish trend, which bulls also replicate, although from a lower level of trend strength.
BTC/USD Daily Chart
BTC/USD is trading at the $7.469 price level, remaining in the same range as in the last two weeks. The main moving averages are in the $8,000 range, slightly downward inclined, adding downward pressure to the price.
Above the current price, the first resistance level is at $7,600, then the second at $7,725 and the third one at $7,850.
Below the current price, the first support level is at $7,400, then the second at $7,100 and the third one at $6,850.
The BTC/USD pair should not close below the third support level to avoid a more bearish scenario, with a target at the $5,000 level.
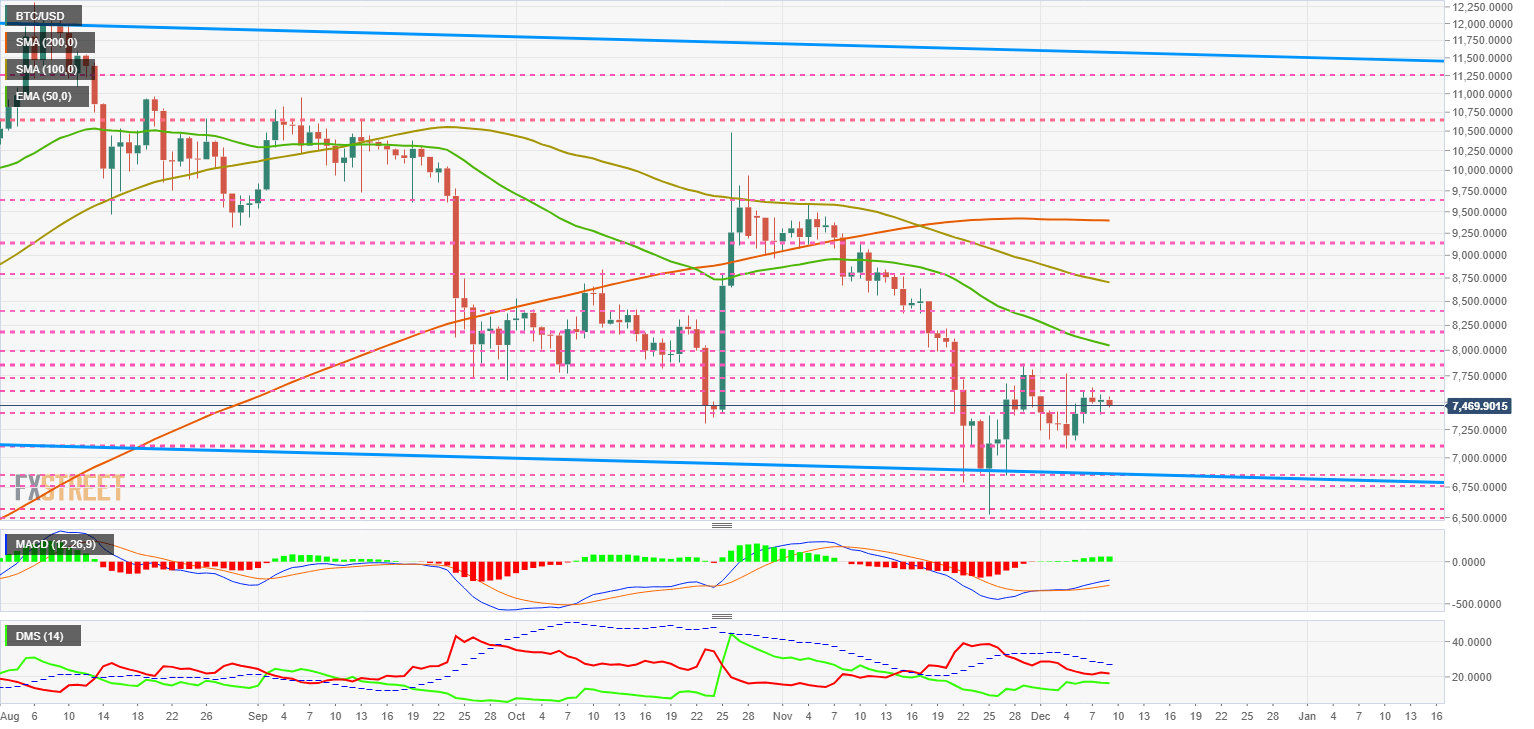
The MACD on the daily chart shows a strong bullish profile. A further price decline should be interpreted as a capitulation move, as it is improbable that a downward movement will spread over time.
The DMI on the daily chart shows how the bears continue to lose strength as the bulls gain it, and both are heading towards a cross point in the next few days.
ETH/USD Daily Chart
ETH/USD is currently trading at the $149.3 price level and maintains the tension between those who need to see the price above the $150 level.
The base of the current bullish channel is very close, and a further visit to the $135 level should not be ruled out.
Above the current price, the first resistance level is at $150, then the second at $155 and the third one at $150.
Below the current price, the first support level is at $140, then the second at $136 and the third one at $130. This third support level is already in another scenario that could bring the price back below $100.
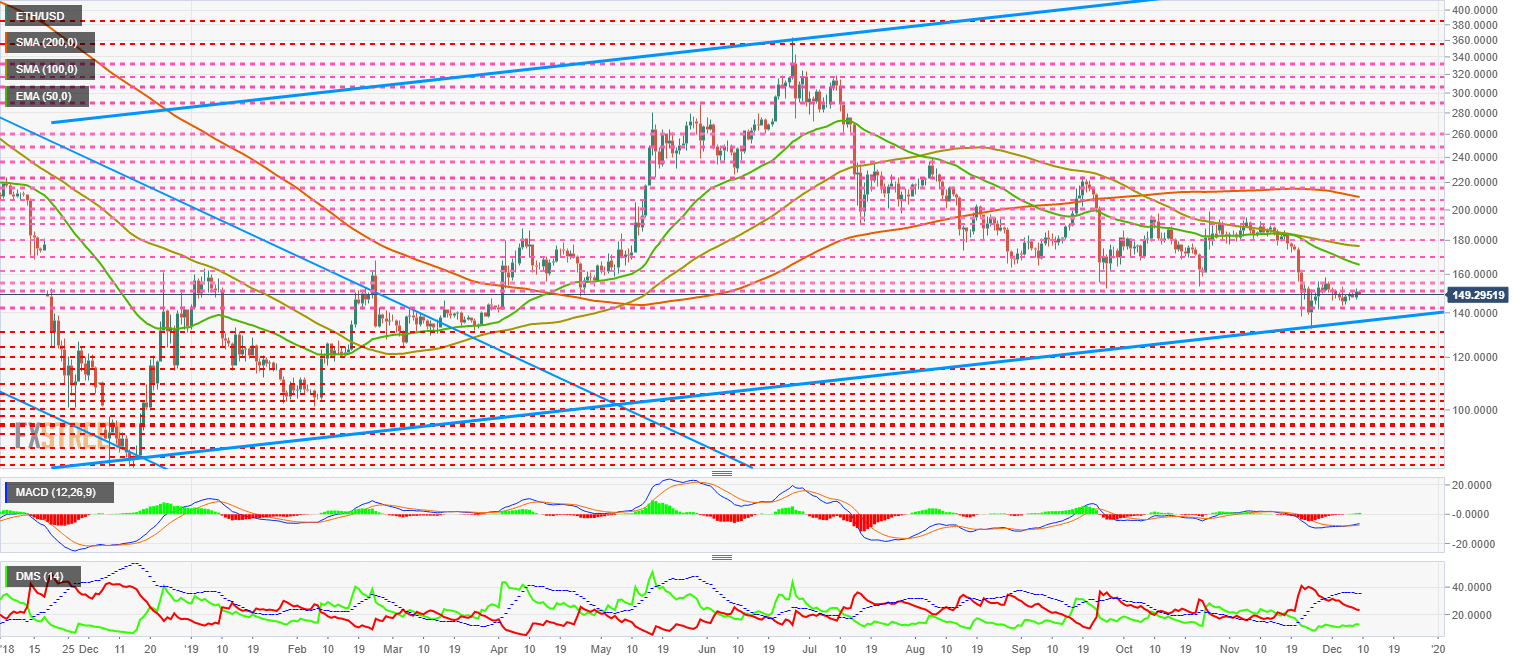
The DMI on the daily chart shows how the oos continue to lose strength as the bulls gradually gain strength. The encounter between both sides of the market will increase volatility and help define the scenarios in the medium term.
XRP/USD Daily Chart
XRP/USD is currently trading at the $0.227 price level and remains stuck above the base of the long-term bearish channel. The baseline is currently passing the $0.20 price level, and drilling of this level could trigger massive sales in the cryptocurrency of Ripple Ltd.
Above the current price, the first resistance level is at $0.237, then the second at $0.258 and the third one at $0.27.
Below the current price, the first support level is at $0.22, then the second at $0.20 and the third one at $0.19.
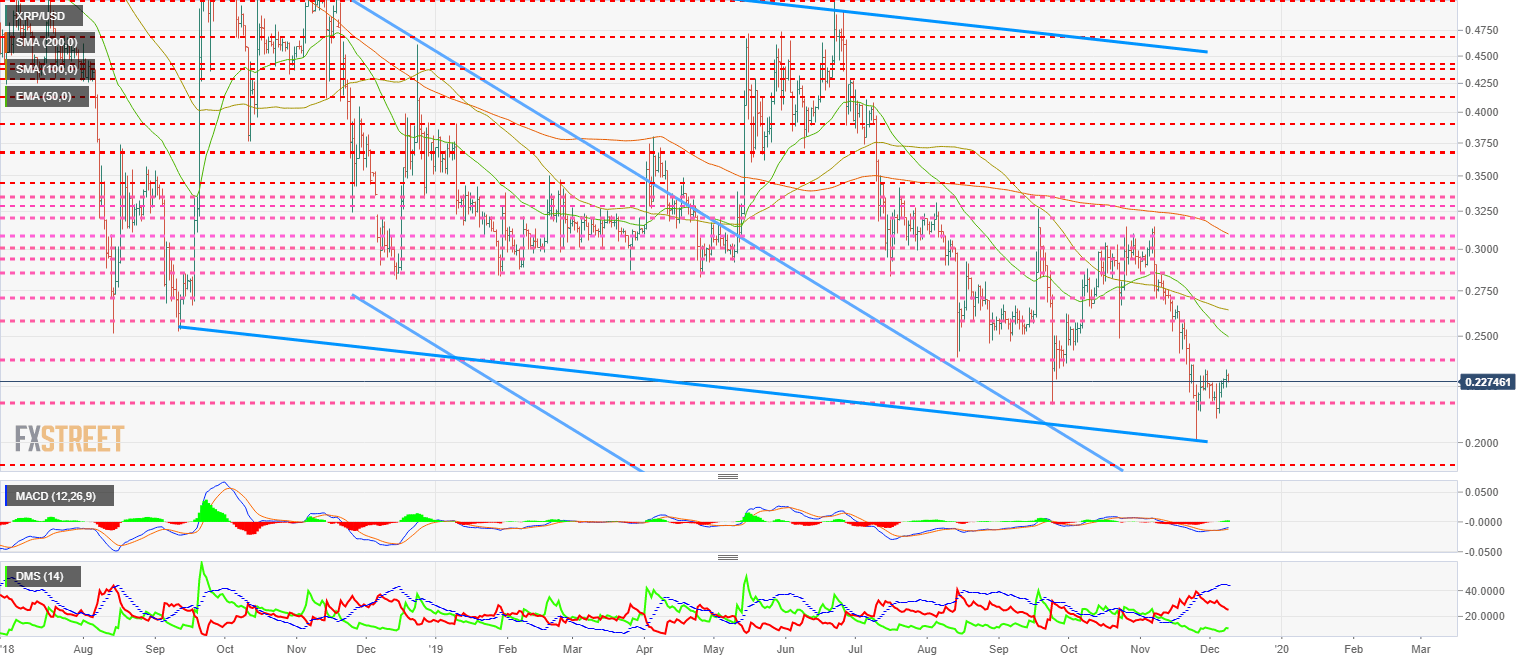
The MACD on the daily chart shows a perfect bullish cross in development. Any downward movement would be terminal bearish.
The DMI on the daily chart shows the bears losing strength at a faster rate than the bulls gain it. A meeting between the two sides of the market may not occur until the last few days of the year.
Get 24/7 Crypto updates in our social media channels: Give us a follow at @FXSCrypto and our FXStreet Crypto Trading Telegram channel
Author

Tomas Salles
FXStreet
Tomàs Sallés was born in Barcelona in 1972, he is a certified technical analyst after having completing specialized courses in Spain and Switzerland. He expanded his technical training following the guidance of great experts on the financial markets.


