Top 3 Price Prediction Bitcoin, Ethereum, Ripple: Last call for the Altcoin’s season
- Ethereum has a chance to reverse a downward trend lasting more than three years.
- The market points to slight falls in the price of the Top 3 cryptos.
- Ripple takes the concept of "sideways shift" to a higher level.

The end of the week is approaching and the crypto market is even more extreme than it has been for days.
The dominance charts show a window of opportunity for Ethereum to break the downward trend of its market quota level.
It won't be easy for Ethereum to achieve this breakout, as the technical indicators are on the verge of losing the last bullish breath and the prices against the US dollar are pointing to declines in the coming sessions.
Although the valuations against fiduciary currencies do not enter into play in the fight for dominance of the crypto universe, an environment of falling prices is not the best way to achieve such an important milestone for Ether.
Ethereum has been losing market share since the summer of 2017 when it held 30% of the global value of the crypto board.
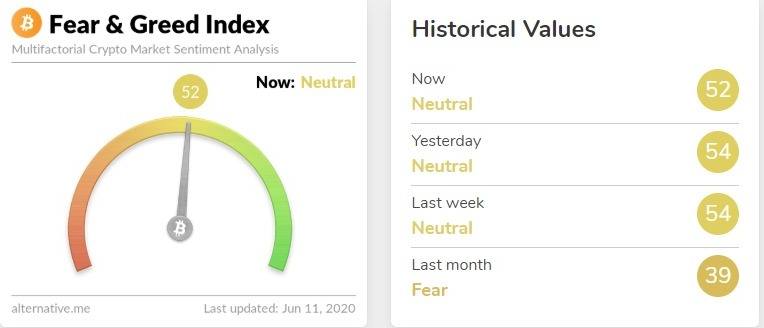
The sentiment level of the crypto market reflects this "frontier" situation and has moved into a neutral zone for another day. The indicator prepared by the alternative.me site marks 52, which is considered a neutral positioning.
The ETH/BTC pair also perfectly reflects the current situation, as Bitcoin's main rival in the dominance dispute is precisely the Ethereum.
ETH/BTC Daily Chart
The ETH/BTC pair is currently trading at the price level of 0.02513. The downward resistance is at 0.0254 but needs a breakout of 0.026 at the daily bar close to confirm the breakout.
Above the current price, the first resistance level is at 0.0254, then the second at 0.026 and the third one at 0.0276.
Below the current price, the first support level is at 0.0248, then the second at 0.0235 and the third one at 0.0225.
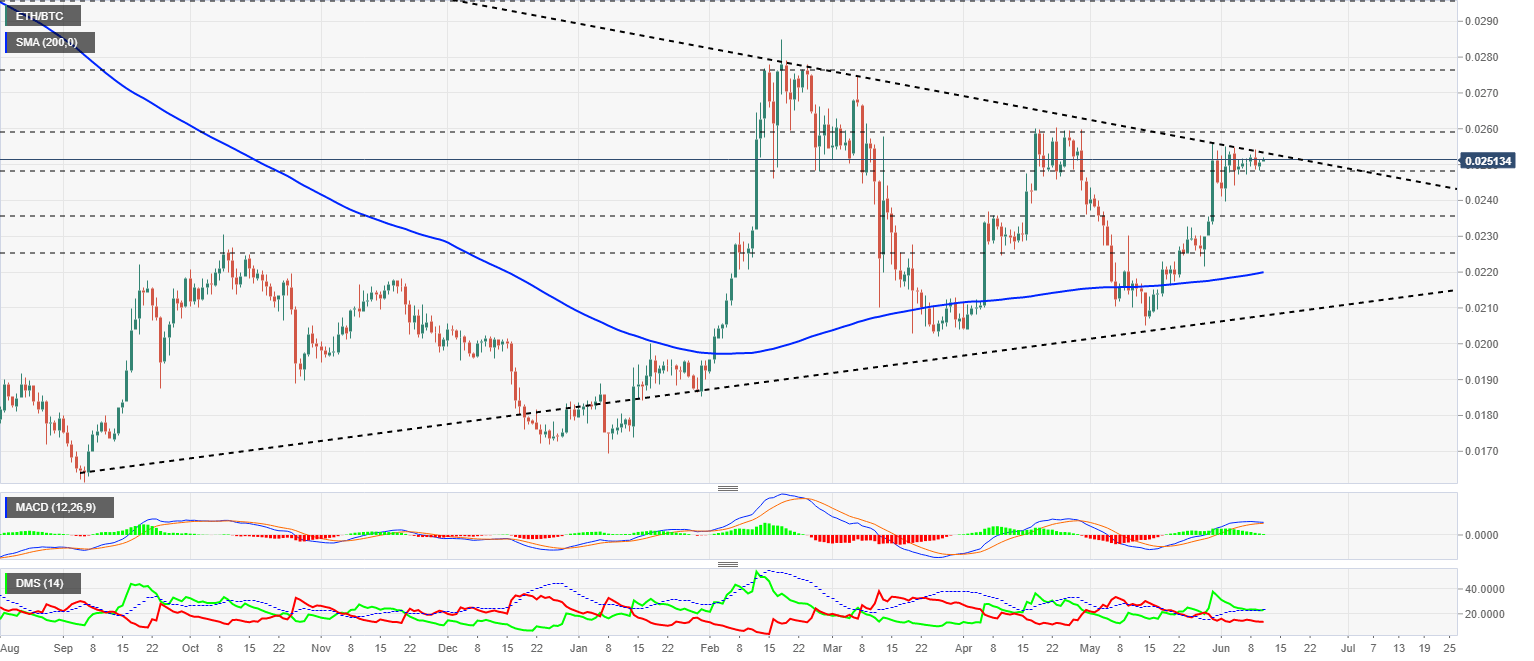
The MACD on the daily chart continues to play with a possible bearish cross, which seems inevitable and plays against Ethereum's aspirations.
The DMI on the daily chart plays the last hopeful card for Ether and tries to bounce upwards after three days by sliding above the ADX line.
BTC/USD Daily Chart
The BTC/USD pair is currently trading at $9820 and is pointing towards the $9450 levels for support. The current structure suggests that if sales finally do appear, the process will be short-lived.
Above the current price, the first resistance level is at $10450, then the second at $11360 and the third one at $12850.
Below the current price, the first support level is at $9500, then the second at $9350 and the third one at $8730.
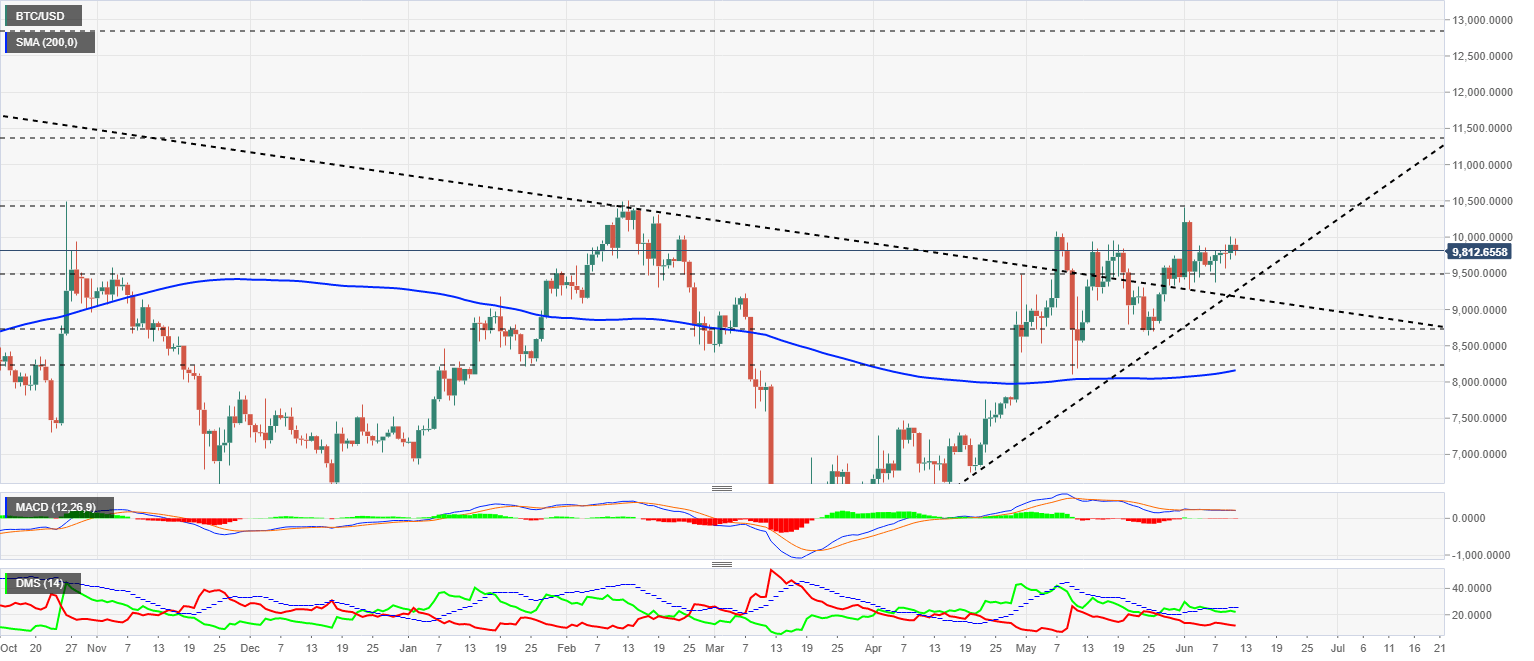
The MACD on the daily chart enters a deep coma and continues for another day without giving any valid information in the short term.
The DMI on the daily chart shows the bulls losing some strength, although the bears are doing the same, the weak leadership of the buying side is not in danger at the moment.
ETH/USD Daily Chart
The ETH/USD pair is currently trading at $246.7 and is facing significant resistance at $267, where the long-term downward trend line meets price congestion resistance. Above that level, the uptrend would be powerful, and we could see the $300 level very quickly.
Above the current price, the first resistance level is at $267, then the second at $285 and the third one at $317.
Below the current price, the first support level is at $245, then the second at $233 and the third one at $222.5.
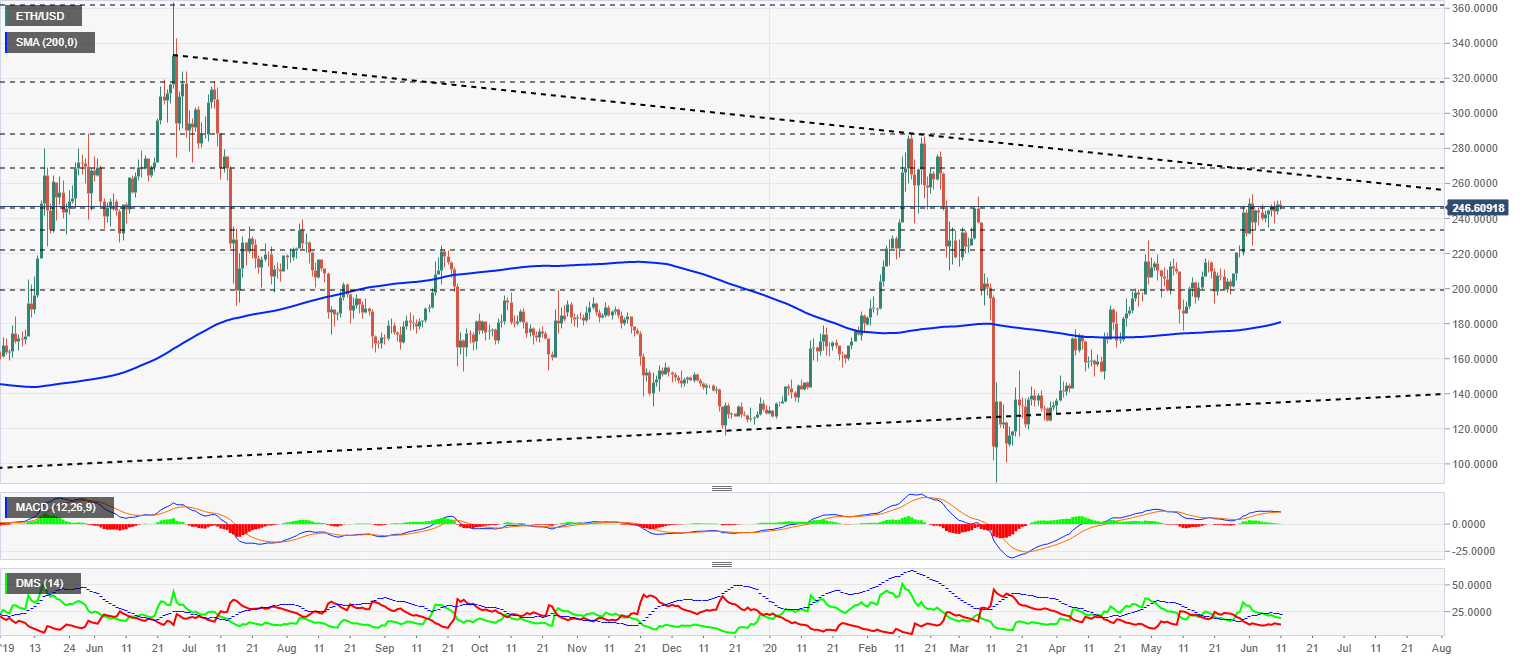
The MACD on the daily chart enters a dormant position and draws a horizontal line. In June 2019, the MACD drew a similar structure, and in just a fortnight the price went from $260 to $365.
The DMI on the daily chart shows the bulls losing strength quickly. Luckily for the buying side, the bears also lose momentum and give the bulls a break.
XRP/USD Daily Chart
The XRP/USD pair is currently trading at the price level of $0.2015, extending this long period of lethargy that has lasted more than a month by one day.
Above the current price, the first resistance level is at $0.213, then the second at $0.235 and the third one at $0.262.
Below the current price, the first support level is at $0.20, then the second at $0.185 and the third one at $0.163.
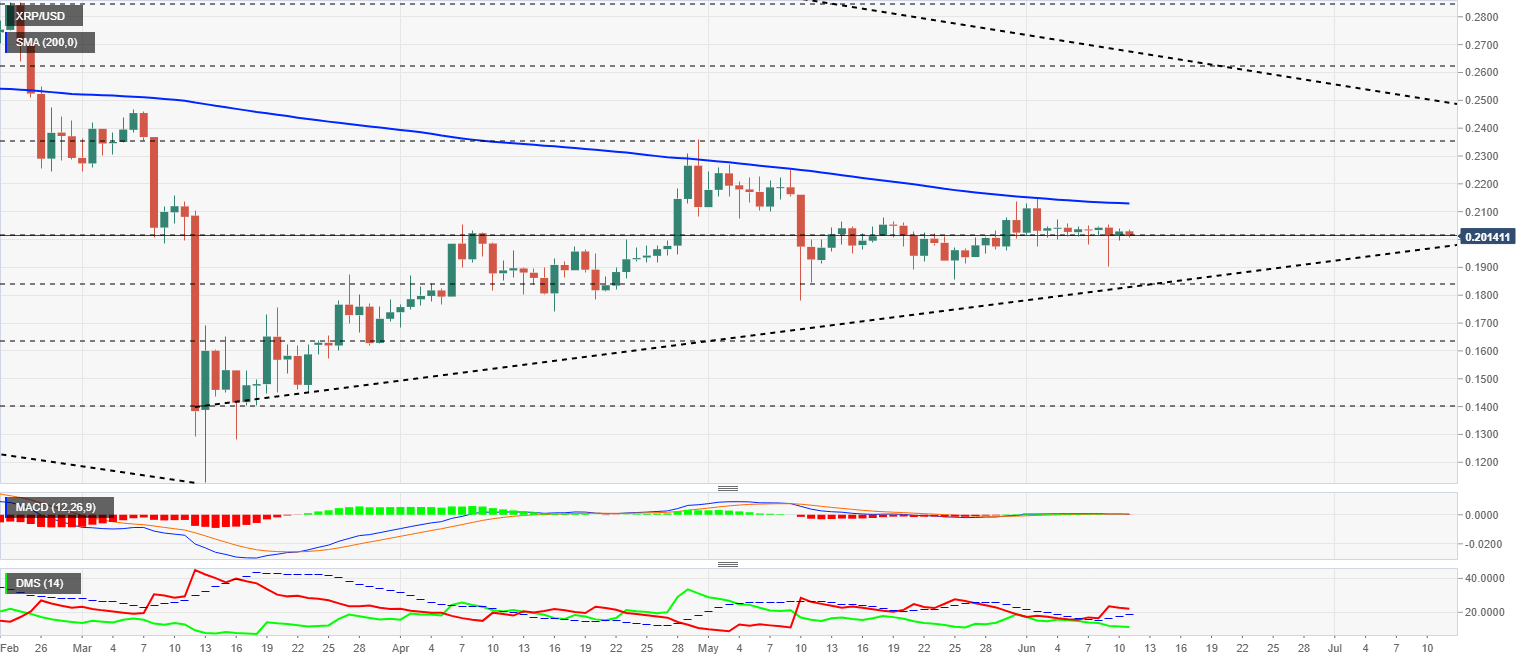
The MACD on the daily chart shows that there is nothing to tell, no clear direction and the only evidence of the tense waiting for the market to decide to move.
The DMI on the daily chart shows the bears losing strength, but without undoing the bearish pattern, they activated by breaking the ADX line. The bulls show no interest in retaking control of the XRP/USD pair.
Author

Tomas Salles
FXStreet
Tomàs Sallés was born in Barcelona in 1972, he is a certified technical analyst after having completing specialized courses in Spain and Switzerland. He expanded his technical training following the guidance of great experts on the financial markets.


