Top 3 Price Prediction Bitcoin, Ethereum, Ripple: Institutional demand mounts as crypto market nears $2 trillion
- Bitcoin price successfully defended a key support level on the daily chart and aims for new all-time highs.
- Ethereum price has established a new all-time high at $2,150 in the past 24 hours.
- Ripple price has experienced a massive 60% explosion in the past two days.

The cryptocurrency market recovered from the dip on March 25 and has hit a new all-time high in market capitalization at $1.99 trillion. Ethereum has been outperforming Bitcoin lately, but the biggest winner has been XRP. Surprisingly, the digital asset had a massive 60% rally after Brad Garlinghouse, CEO of Ripple, said he is hopeful thanks to the new SEC administration.
Bitcoin price resumes daily uptrend, aiming for new all-time high
Bitcoin had a significant correction from the previous all-time high of $61,844 formed on March 13. The flagship cryptocurrency lost 18.5% of its value in the next two weeks, creating a local bottom of 50,427 on March 25.
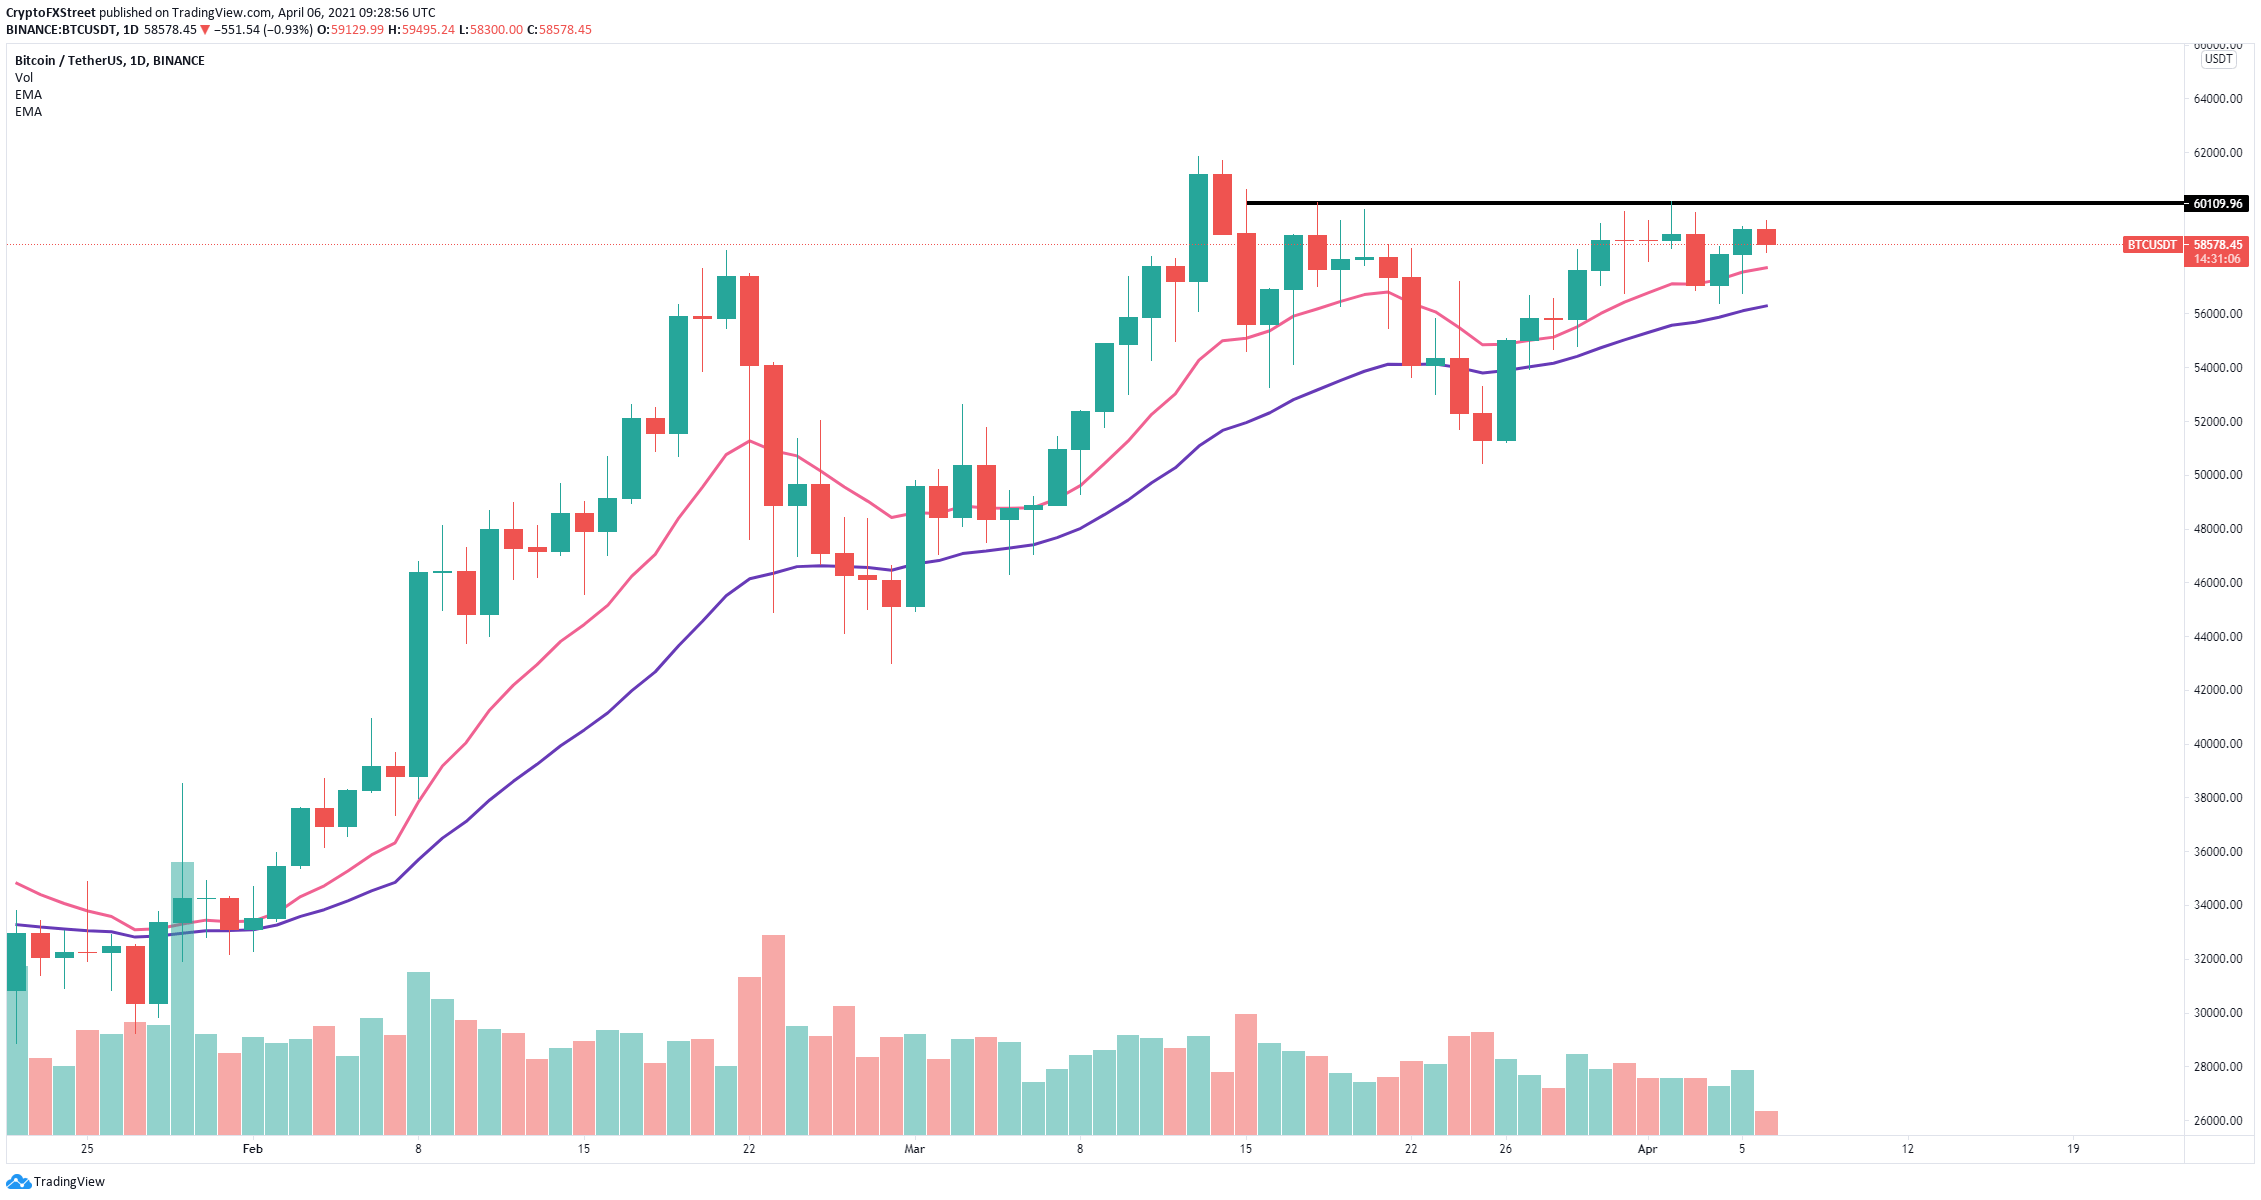
BTC/USD daily chart
However, the digital asset managed to bounce back up, recovering the 12 and 26 EMA support levels. In the past four days, Bitcoin bulls have defended the 12 EMA and are ready for a new leg up above the key resistance level of $60,218 toward the previous all-time high.
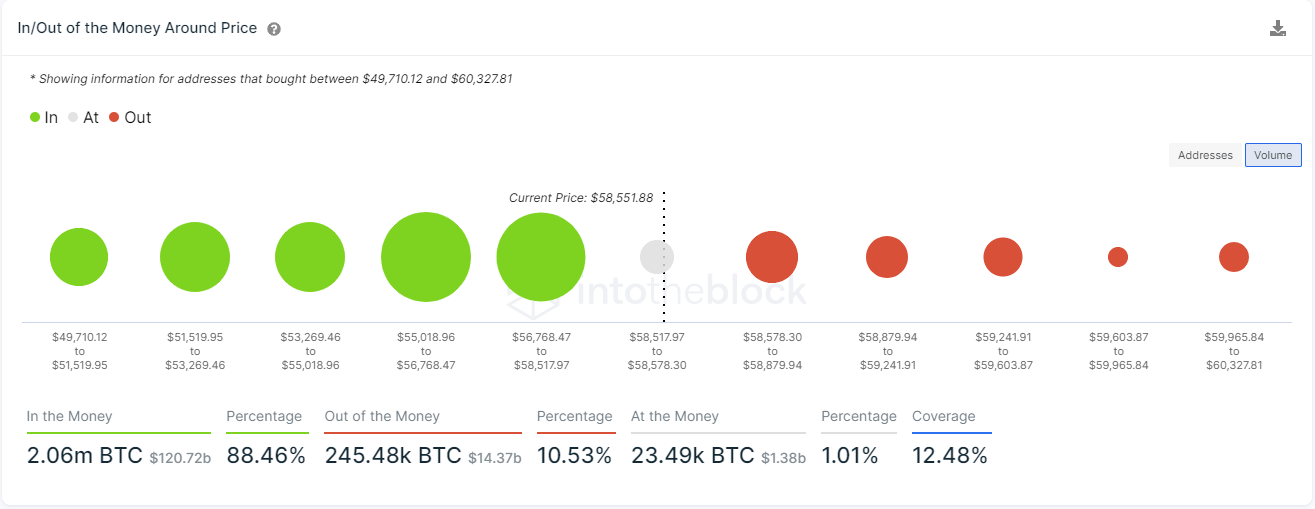
BTC IOMAP chart
The In/Out of the Money Around Price (IOMAP) model shows a ton of support between $58,518 and $55,019, where 3.1 million addresses purchased over 1.2 million BTC. This range will absorb a lot of short-term selling pressure.
Additionally, there is far weaker resistance above $58,500, which indicates that bulls have the upper hand, and it will be easier to push the Bitcoin price toward $60,218 and ultimately to a new all-time high.
However, losing this great support area would quickly drive the Bitcoin price toward $50,000 as there are no other significant support points below.
Ethereum price hits new all-time high as 14 million ETH are locked away
One of the biggest strengths of Ethereum is the fact that a large majority of coins are locked away from exchanges. The ETH2 deposit contract holds more than 3.7 million ETH worth around $7.8 billion at the time of writing.
The number of ETH locked in DeFi hit 10.7 million, which means that 14.4 million ETH are locked away and cannot be sold currently. This number represents $30 billion worth of ETH, which is around 13% of the total circulating supply.
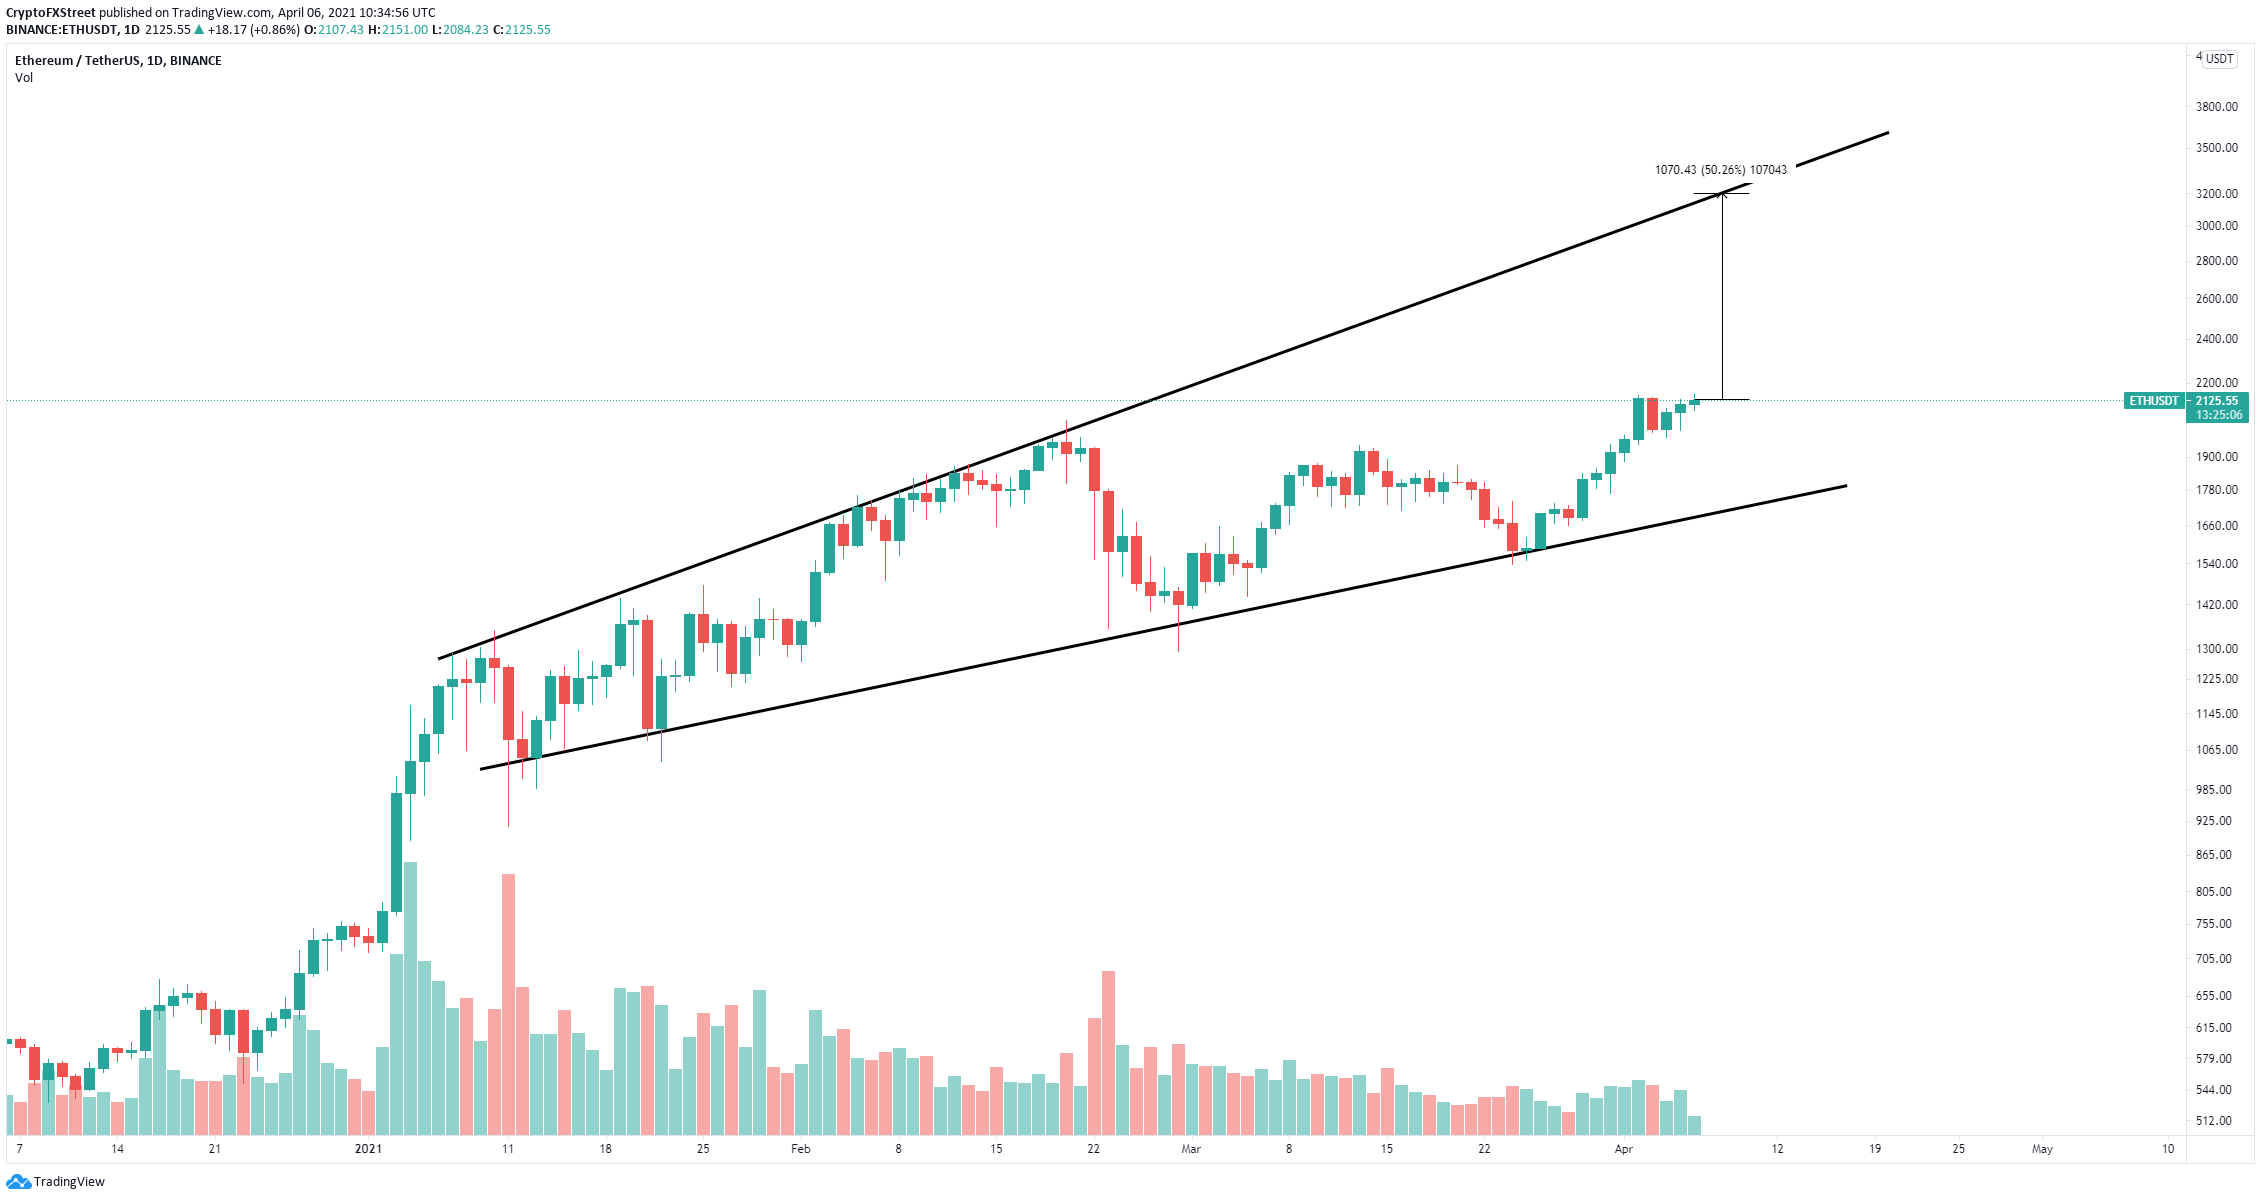
ETH/USD daily chart
Ethereum remains contained in an ascending broadening wedge pattern on the daily chart. The upper boundary of this pattern is currently located at around $3,200, and ETH has practically no resistance ahead.
%20[11.41.50,%2006%20Apr,%202021]-637533070842795566.png)
ETH Supply on Exchanges
Additionally, the number of ETH inside exchanges also dropped in the past two weeks despite the smart contracts giant hitting new all-time highs. Since March 19, this number dropped by 0.9%.
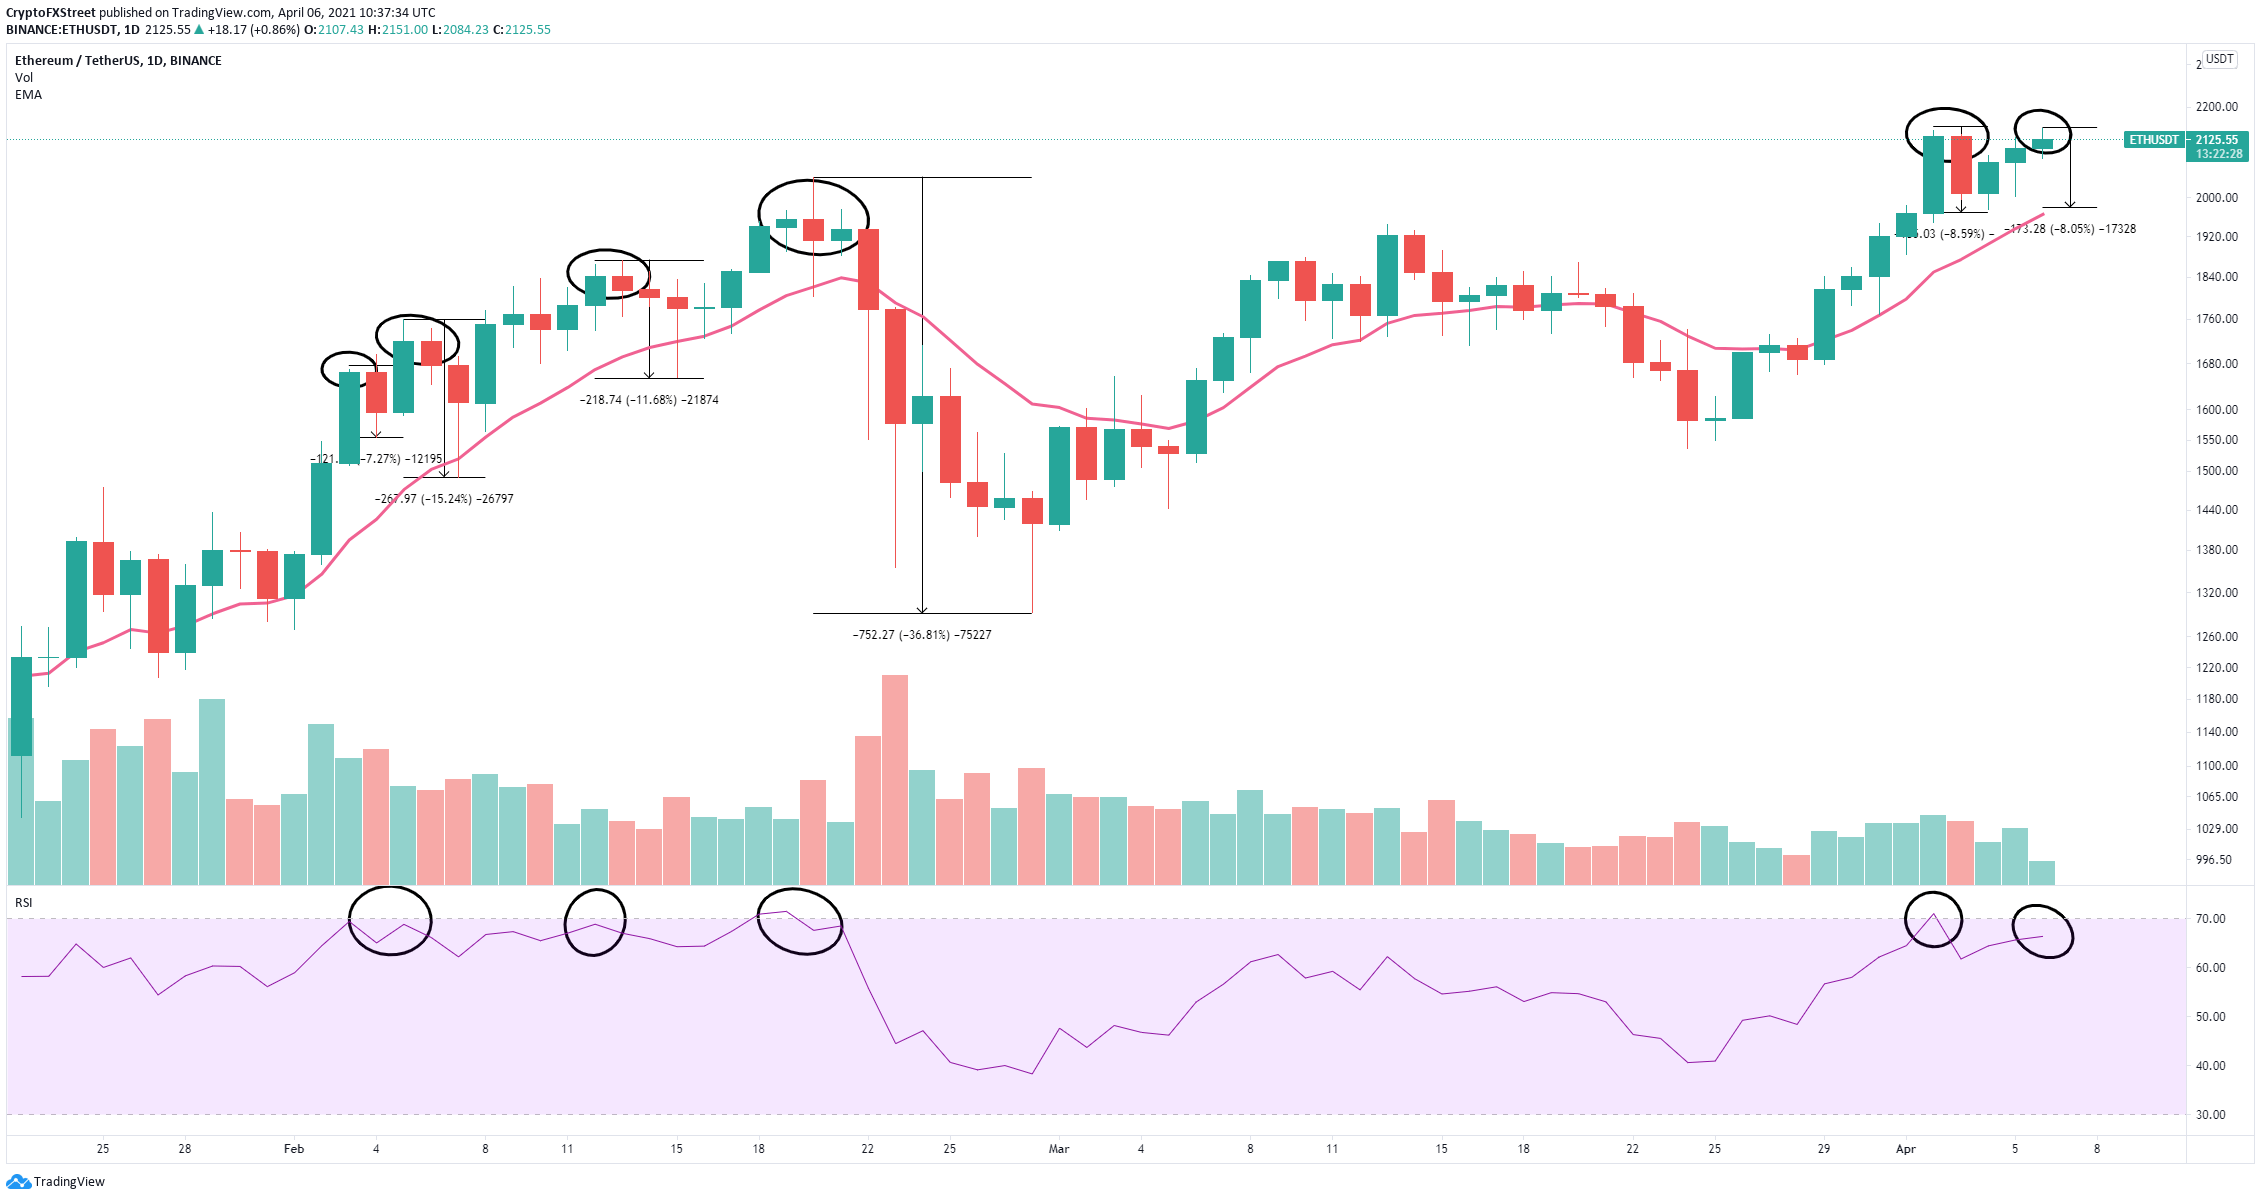
ETH/USD daily chart
However, on the daily chart, the RSI is close to overextension again, which has proven to be an accurate indicator of upcoming corrections. The digital asset could fall toward the 12 EMA at $1,970 if selling pressure continues mounting.
Ripple price explodes by 80% in 48 hours
It seems that fears about the SEC lawsuit have dissipated as XRP holders have pushed its price to new yearly highs for no apparent reason. Brad Garlinghouse has stated:
I find a certain irony that the SEC would bring a lawsuit against us, because what they’re saying is not just that we should have known and we’ve acted in bad faith when the SEC themselves haven’t really said they know for sure that XRP is a security. In their own court filings, they said that the court will determine that, which of course brings a contradiction that if the court’s going to determine that, how could I personally have known that the SEC would view XRP as a security.
However, the CEO also stated that Ripple can easily continue without XRP, which should not be positive news for XRP holders.
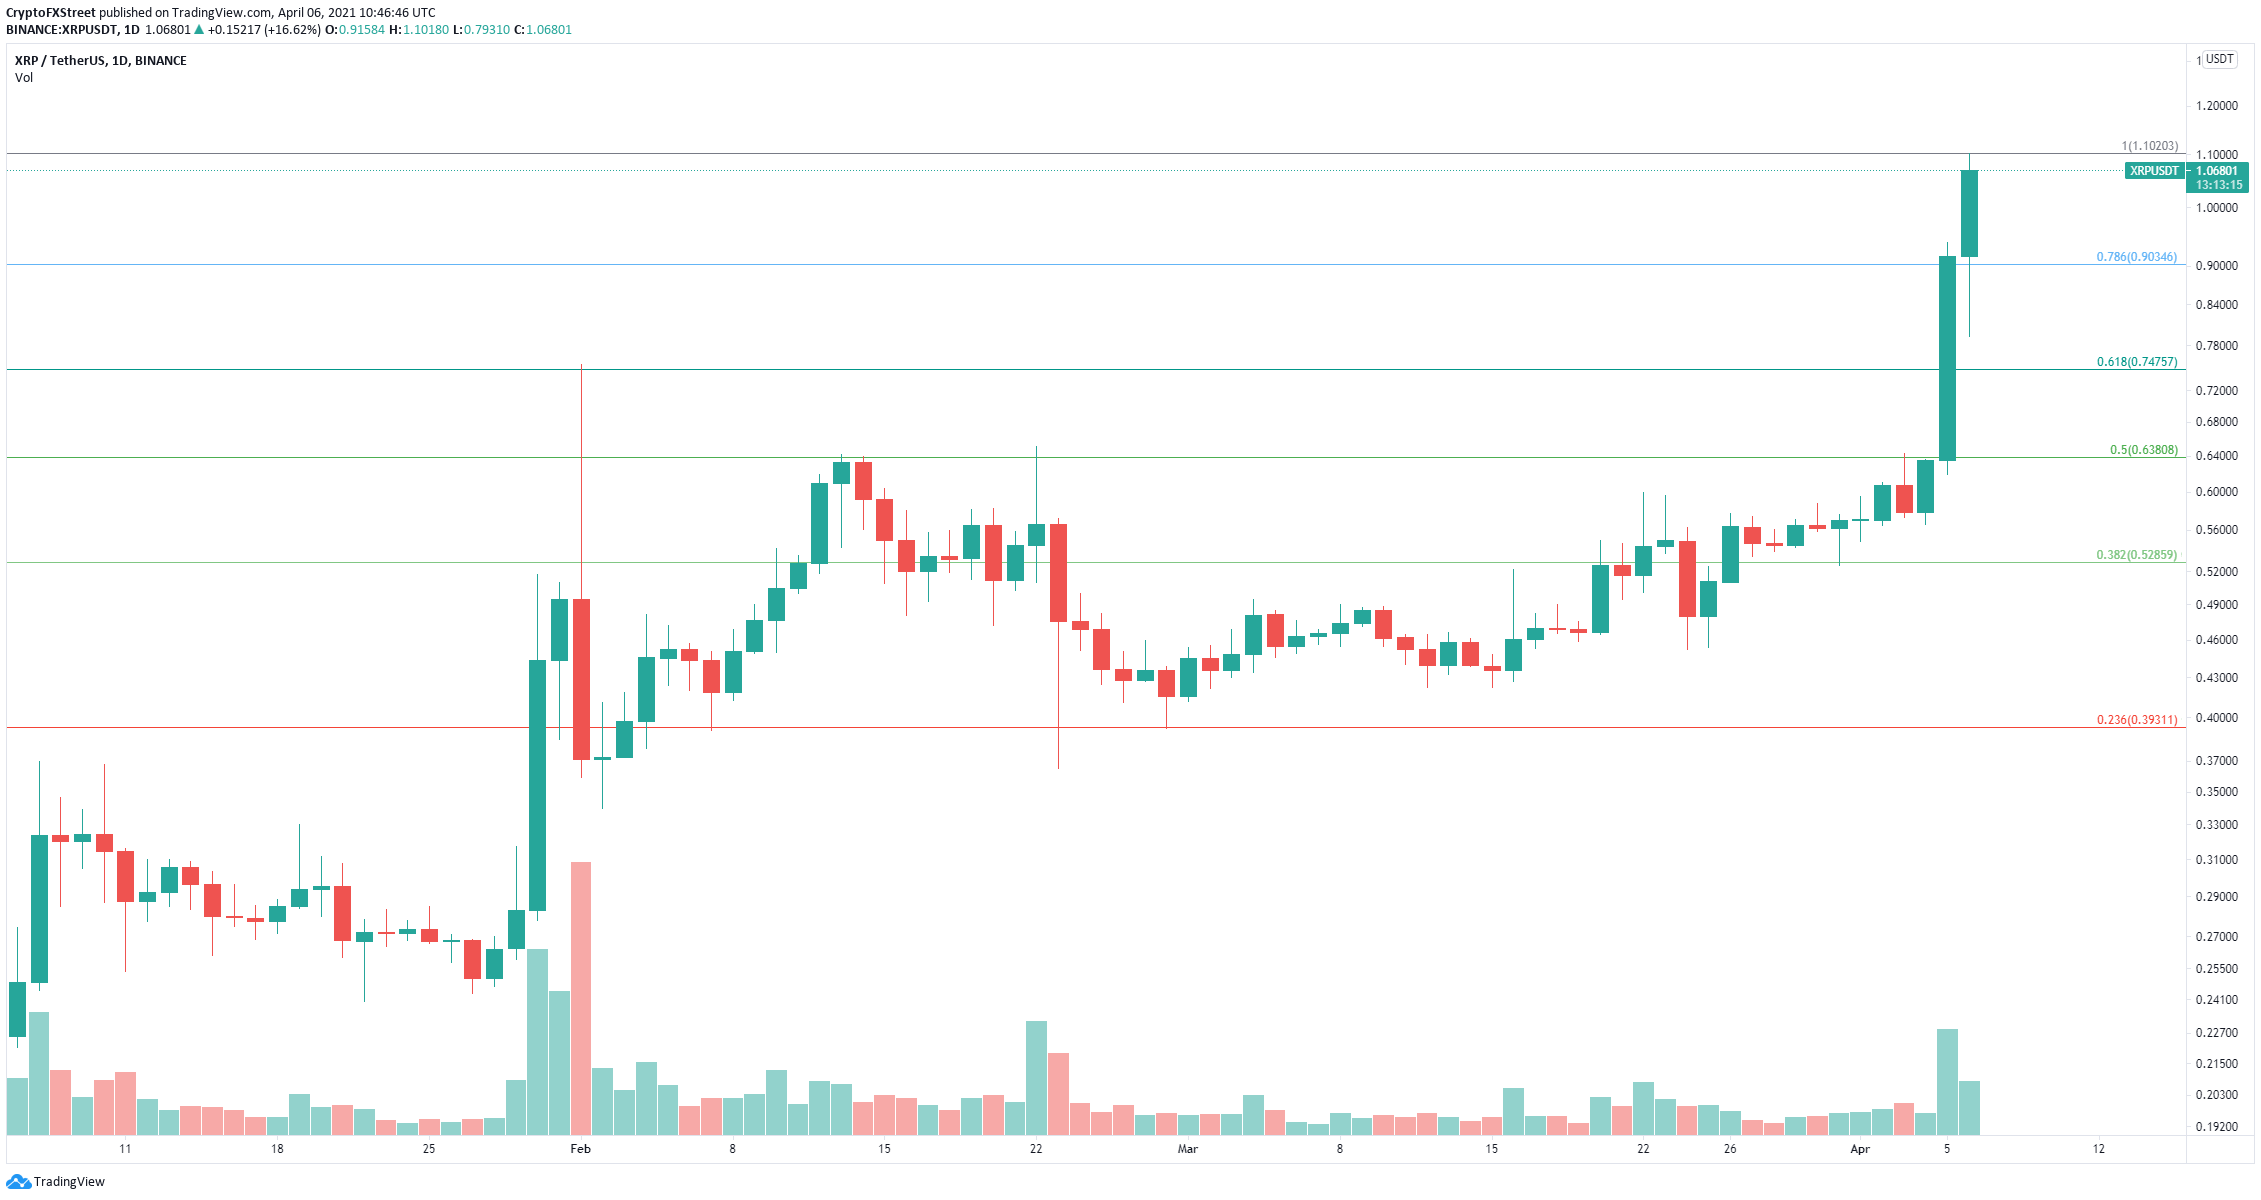
XRP/USD daily chart
This is the highest price point in two years for XRP. Using the Fibonacci retracement tool, we can determine several support levels on the way down. The nearest is established at $0.90, which is the 78.6% Fib level, followed by $0.74 at the 61.8% level.
Author

Lorenzo Stroe
Independent Analyst
Lorenzo is an experienced Technical Analyst and Content Writer who has been working in the cryptocurrency industry since 2012. He also has a passion for trading.


