Top 3 Price Prediction Bitcoin, Ethereum, Ripple: Extreme fear despite the highest levels since March
- There is a significant divergence between the market sentiment and the current technical situation on the crypto board.
- Bitcoin and XRP are still weak against the strength shown by Ether last week.
- Ether's dominance could go into a full-bullish mode in the next few days.

The crypto board has shown significant improvements after the weekend. The bullish signal announced by the ETH/BTC pair midway through last Thursday's session resulted in changes in the Bitcoin and Ether scenarios, although the XRP lagged.
The weekend's headlines have left us with warnings of a possible collapse of the Bitcoin. This media position is a reflection of the level of market sentiment, which continues to be pessimistic and ignores the improvement in price and market momentum. There is a divergence between market sentiment and price in this regard, and at some point, one of the two sides will move to balance the situation.
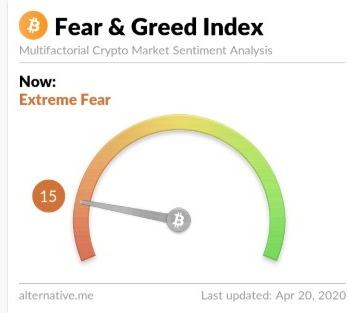
The current market sentiment level, according to alternative.me is 15 on a scale of 0-100, an extreme fear level similar to last week's. These levels of pessimism are typical of oversold markets with a tendency to rise in price.
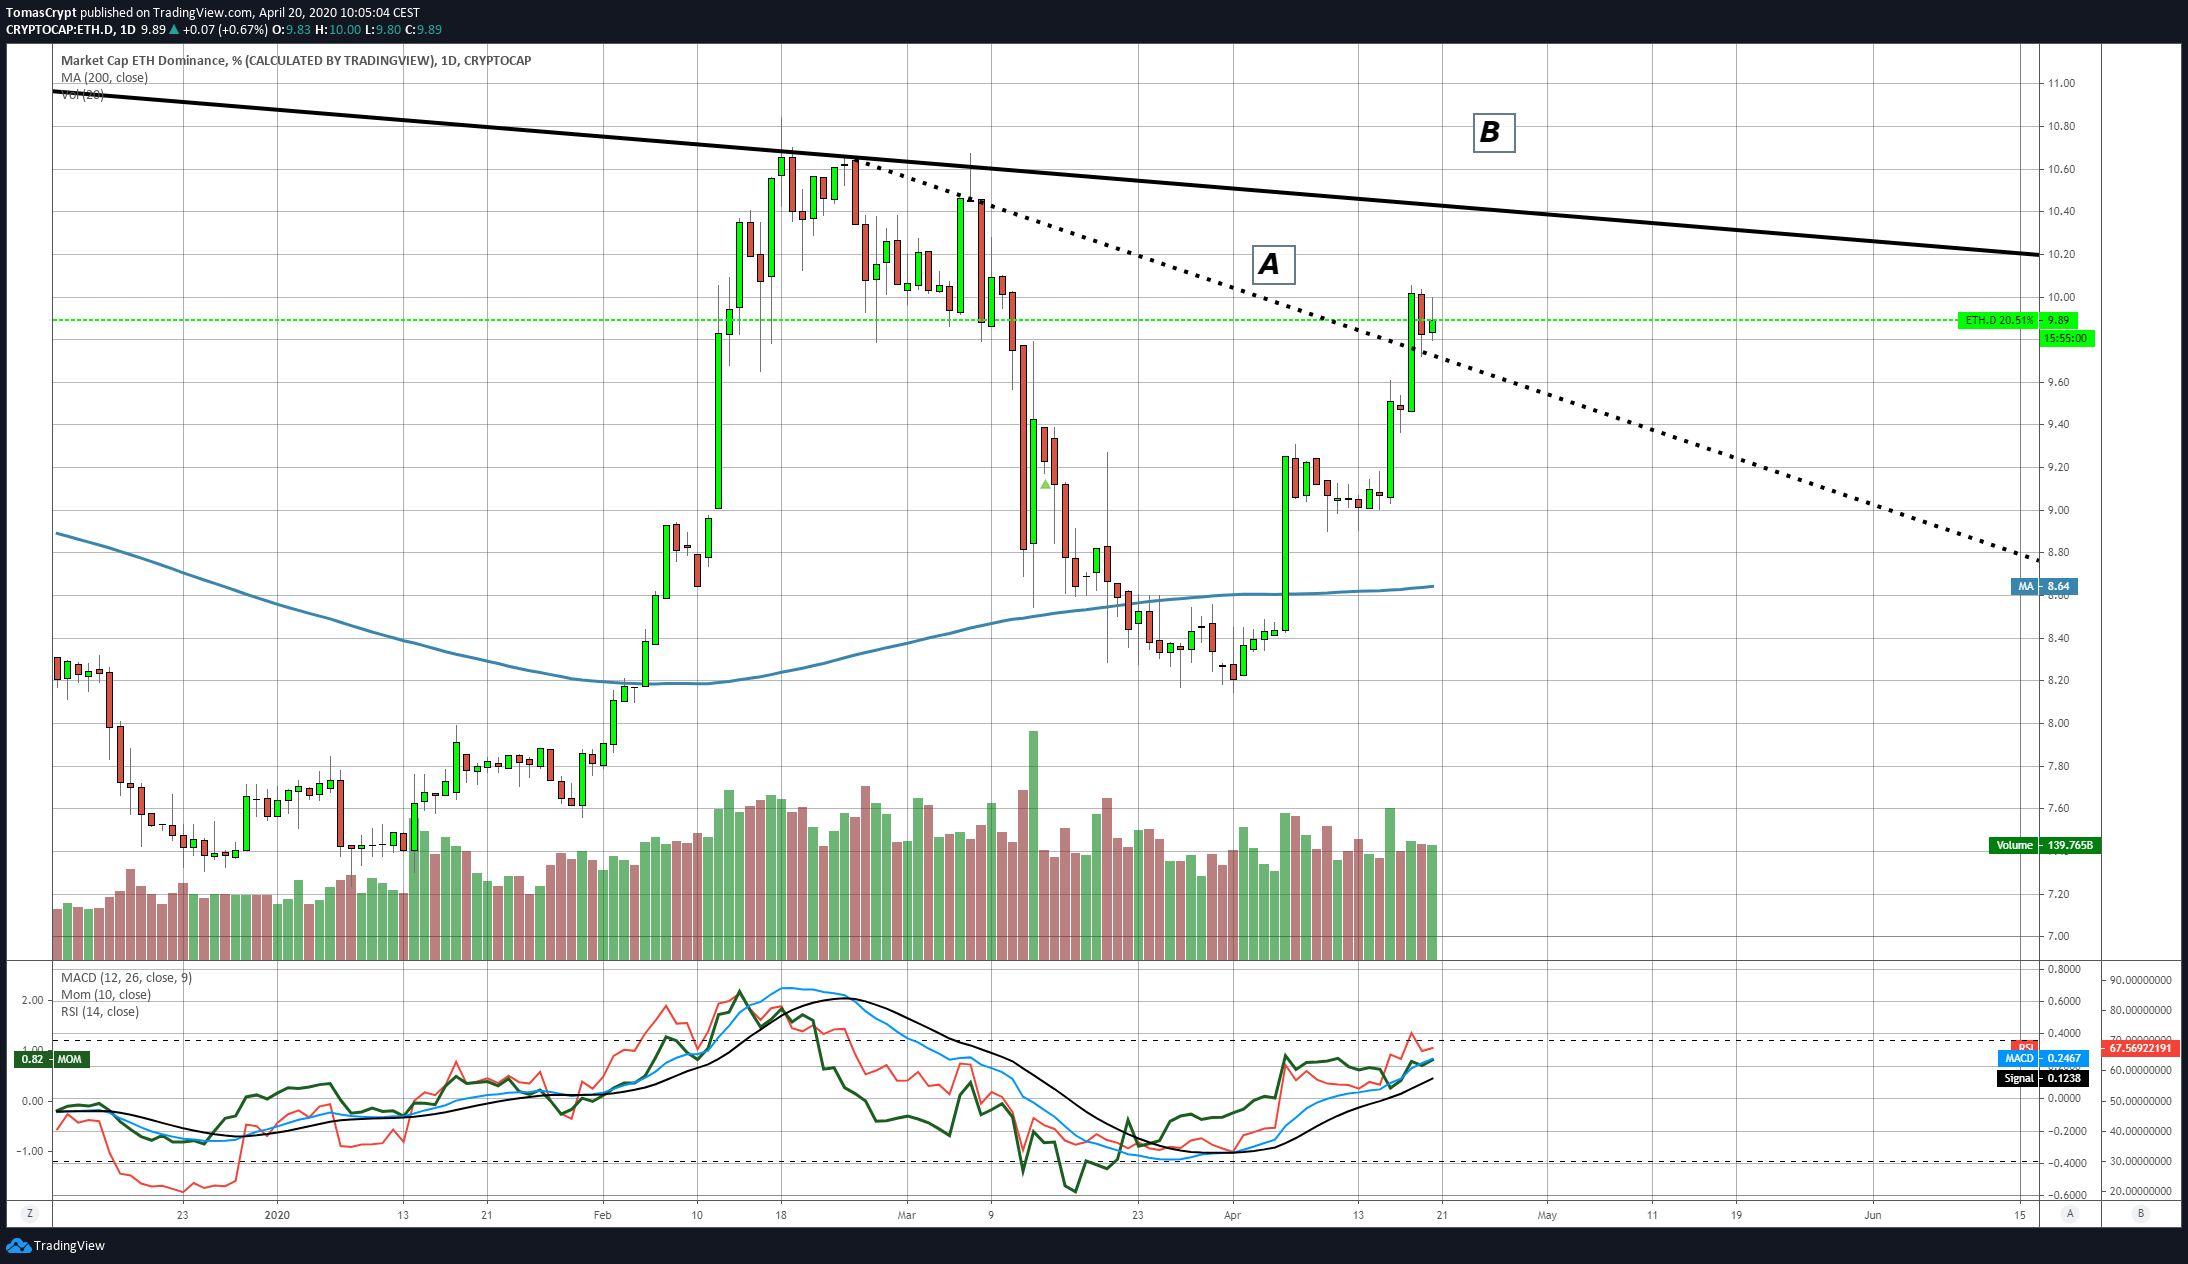
The Ether's dominance chart, created by TradingView, shows how the bullish reaction that started on Thursday has managed to break the short-term downward trend line (A) and remains very close to the long-term downward trend line (B).
ETH/BTC Daily Chart
The ETH/BTC pair is currently trading at the 0.0255 price level and has failed to break the downward trend line from the mid-February highs. The full bullish scenario for Ether and the market as a whole remains at the day's top of 0.026.
Above the current price, the first resistance level is at 0.025, then the second at 0.026 and the third one at 0.0268.
Below the current price, the first support level is at 0.0245, then the second at 0.023 and the third one at 0.022.
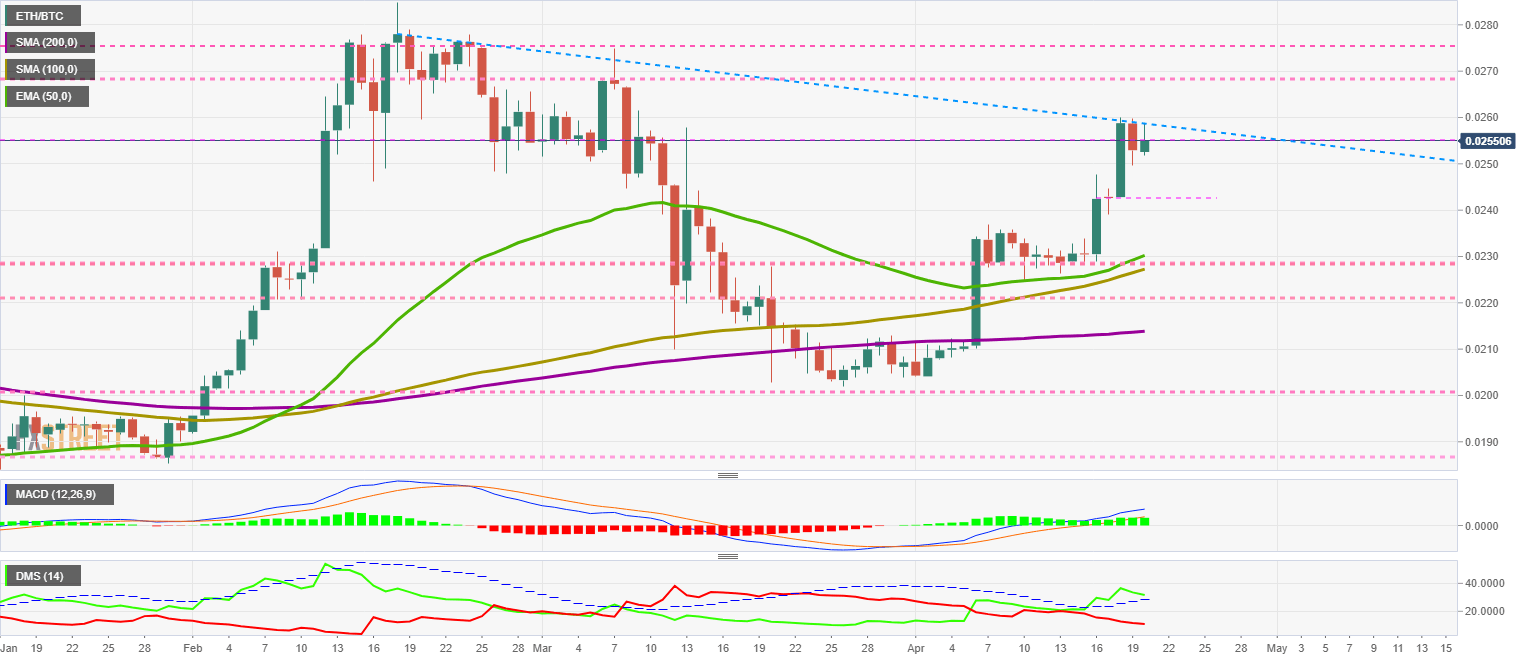
The MACD on the daily chart shows an increasing gap between the exponential averages and the signal line. A limiting factor for the upward development of the ETH/BTC pair is the short distance to the 0 levels of the indicator.
The DMI on the daily chart shows bulls losing strength and looking for support at the ADX line. The bears continue to lose power and give up their control of the pair.
BTC/USD Daily Chart
The BTC/USD pair is currently trading at the price level of $7169 and is holding above the downward sloping channel helped by the presence of the EMA50 as support. The distance from the bearish scenario is minimal, so the risk of price drops is high.
Above the current price, the first resistance level is at $7400, then the second at $7600 and the third one at $8000.
Below the current price, the first support level is at $7100, then the second at $6850 and the third one at $6600.
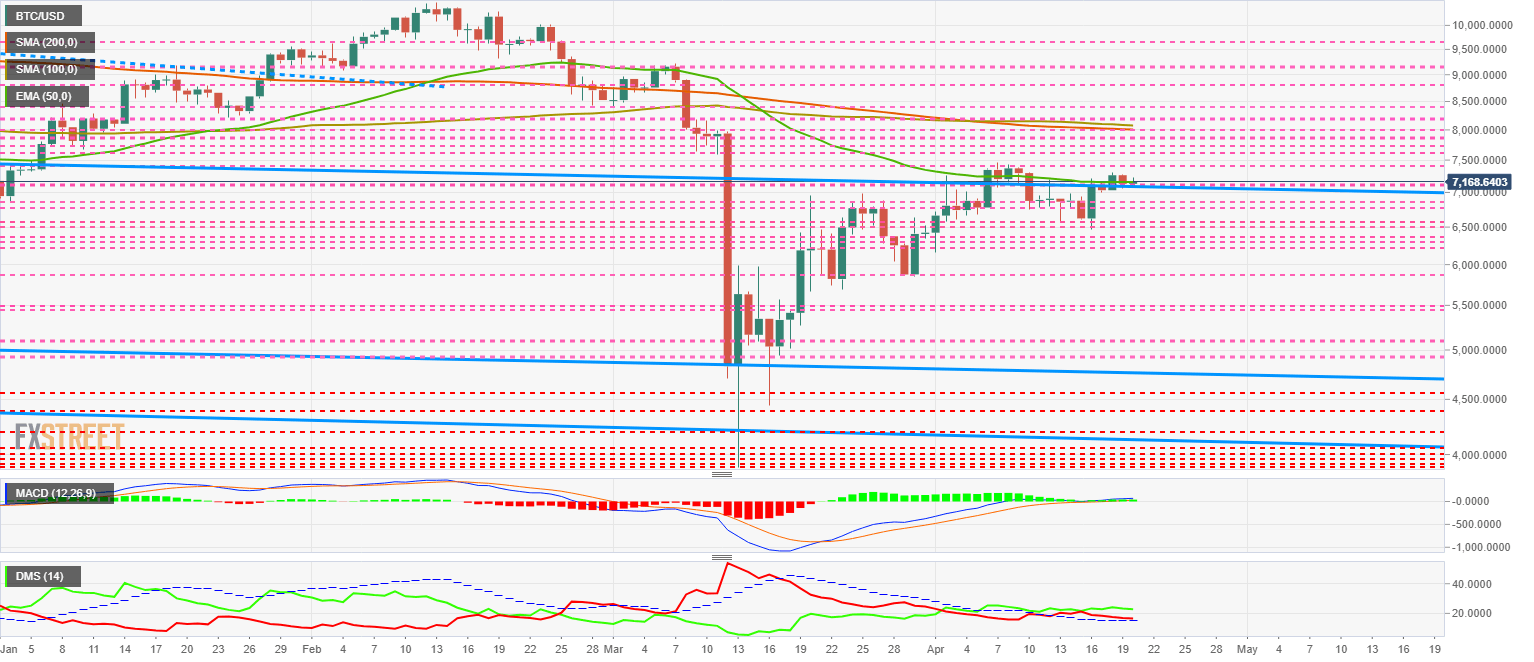
The DMI on the daily chart shows bears and bulls moving above the ADX line, which is a factor in price volatility. Bulls are leading the BTC/USD pair, but until bears move below the ADX, there will be no definite improvement in momentum.
ETH/USD Daily Chart
The ETH/USD pair is currently trading at the $182.8 price level and has accumulated a 20% price increase since last Thursday. Thanks to this significant improvement, ETH/USD is once again in the medium-term bullish channel and is trading above the 50-day EMA and 200-day SMA.
Above the current price, the first resistance level is at $185, then the second at $190 and the third one at $195. The channel ceiling is moving above the $220 price level.
Below the current price, the first support level is at $180, then the second at $172 and the third one at $167.
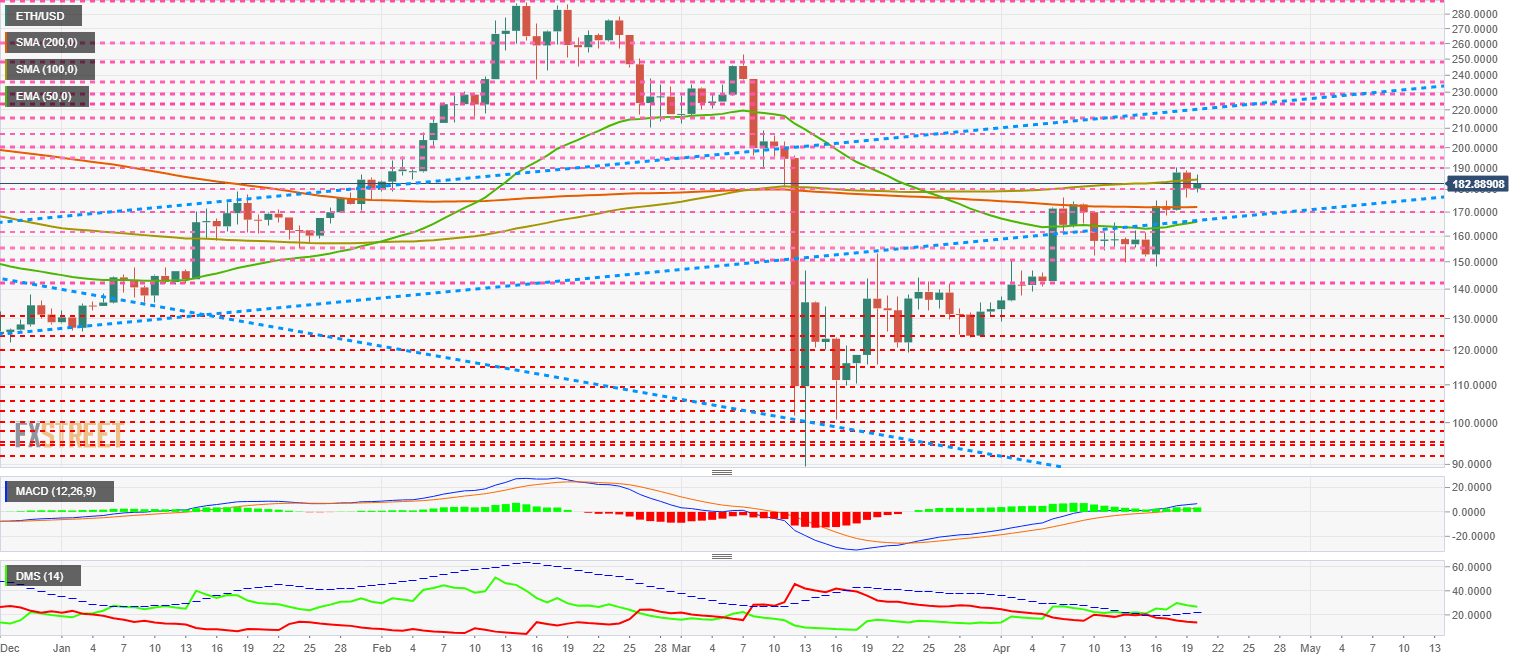
The DMI on the daily chart shows the bulls controlling the ETH/USD pair, although they are losing strength and are dropping to the ADX line for support. The bears appear to be pausing in their downward trajectory, and some selling may be occurring today.
XRP/USD Daily Chart
The XRP/USD pair is currently trading at the price level of $0.191 and consolidates price congestion support at the price level of $0.19. The 50-day EMA at $0.195, compresses the price downward and threatens XRP.
Above the current price, the first resistance level is at $0.195, then the second at $0.20 and the third one at $0.219.
Below the current price, the first support level is at $0.19, then the second at $0.172 and the third one at $0.15.
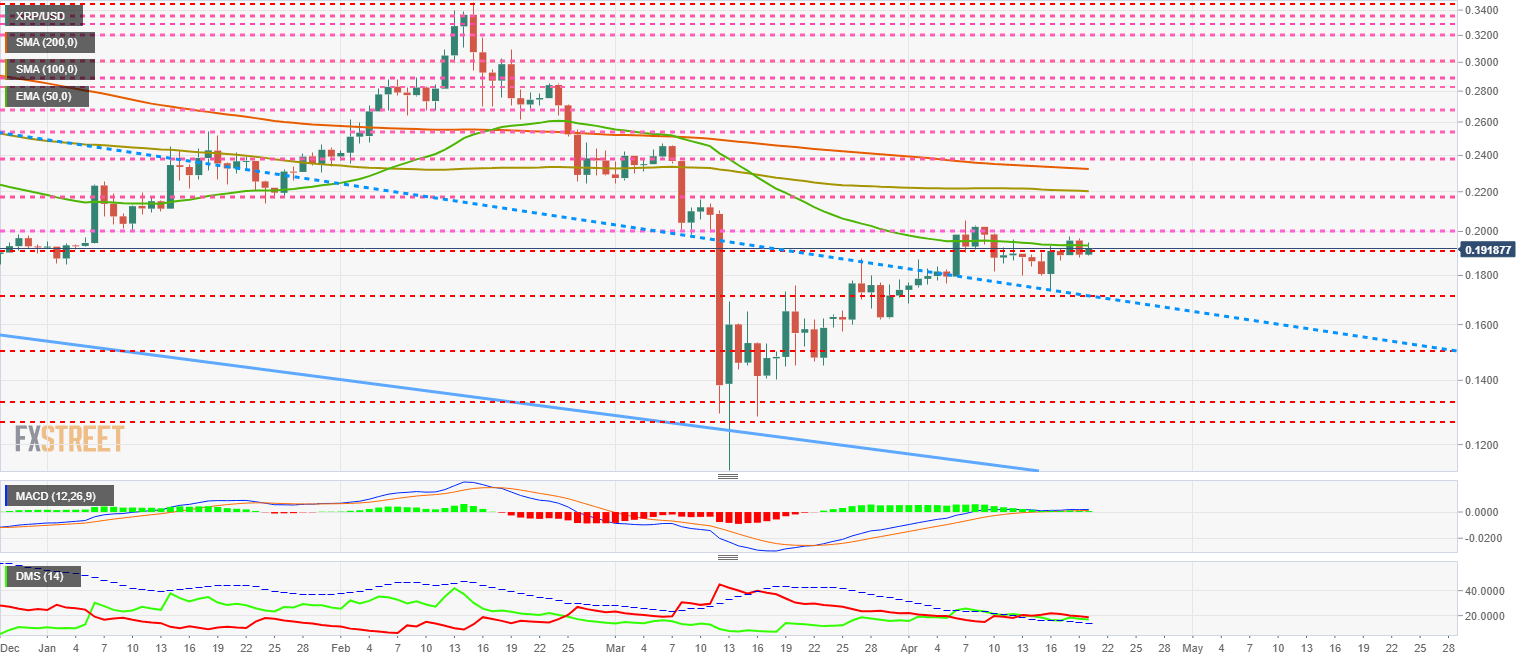
The DMI on the daily chart confirms the indecision shown by the MACD indicator. Bulls and bears both show a lack of trend force.
Author

Tomas Salles
FXStreet
Tomàs Sallés was born in Barcelona in 1972, he is a certified technical analyst after having completing specialized courses in Spain and Switzerland. He expanded his technical training following the guidance of great experts on the financial markets.


