Top 3 Price Prediction Bitcoin, Ethereum, Ripple: Ether leads the crypto market
- ETH/USD above $400 returns the positive tone to the market.
- BTC/USD suffers from the $12400 level and does not join the bullish trend.
- Market sentiment remains too positive and weighs down the upside potential.

The weekend leaves us with a new, unexpected upward movement of Ethereum. As a sign of the growing weight of Ethereum in the portfolios, the cryptocurrency designed by Vitalyk Buterin always gathers the first and best favorable winds that cross the crypto board.
Bitcoin stuck below $12000, a level of resistance that for the moment prevents access to areas of the chart with fewer obstacles and much more favorable for rapid price increases.
The focus for today, from a technical point of view, is on the DMI of the ETH/USD pair. The D+ indicator – Positive Directional Movement Indicator – will tell us in a few hours if the movement of Ethereum is valid or not.
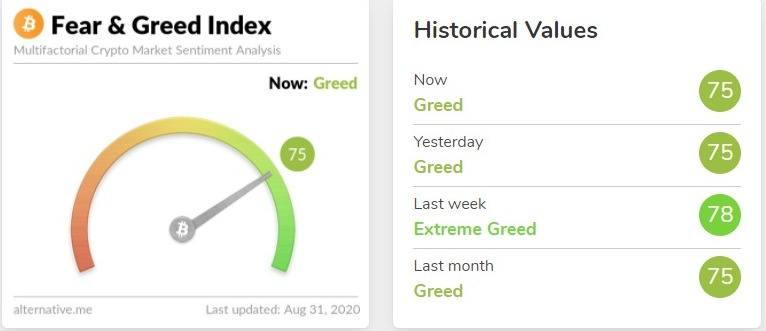
The market sentiment indicator prepared by the website alternative.me does not reflect an improvement in the perception by the movement of Ethereum. The indicator is at the 75 level today, remaining just below the level of extreme greed. Optimism continues to dominate, a negative figure in the short term.
ETH/BTC Daily Chart
The ETH/BTC pair is currently trading at the price level of 0.0362 after yesterday's price congestion resistance at 0.0367 stopped the bullish move.
Above the current price, the first resistance level is at 0.0367, then the second at 0.0372 and the third one at 0.0381.
Below the current price, the first support level is at 0.0351, then the second at 0.0332 and the third one at 0.0322.
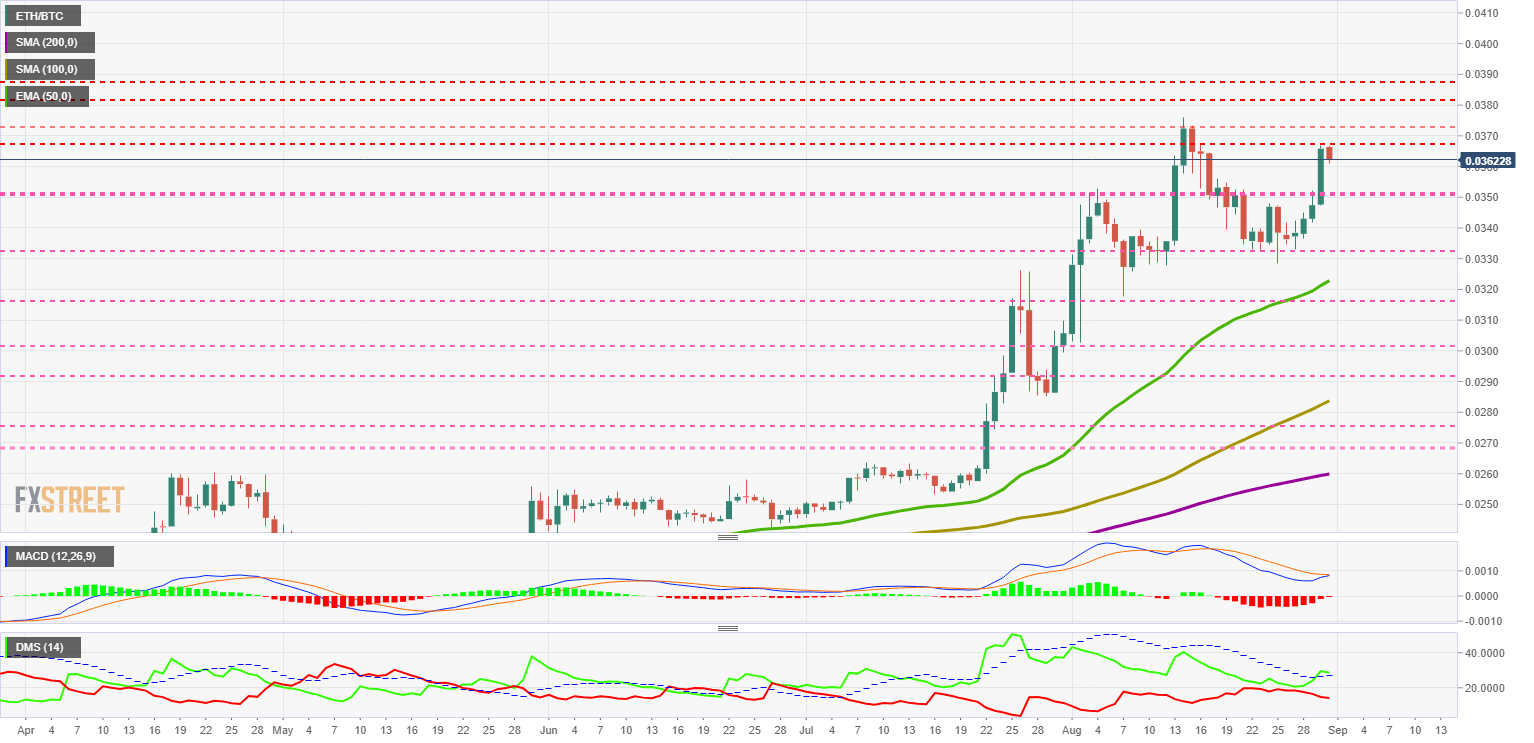
The MACD on the daily chart is at a turning point. The moving averages are about to cross over to the upside, a delicate position that is conducive to bearish rejection.
The DMI on the daily chart shows the bulls breaking through the ADX line and triggering a bullish pattern. The confirmation of this bullish pattern will come in the next few hours if the buy-side stays above the trend line indicator.
BTC/USD Daily Chart
The BTC/USD pair is currently trading at the price level of $11670 while it is unable to keep up with Ethereum.
Above the current price, the first resistance level is at $11815, then the second at $12300 and the third one at $14000.
Below the current price, the first level of support is at $11250, then the second at $11050 and the third one at $10650.
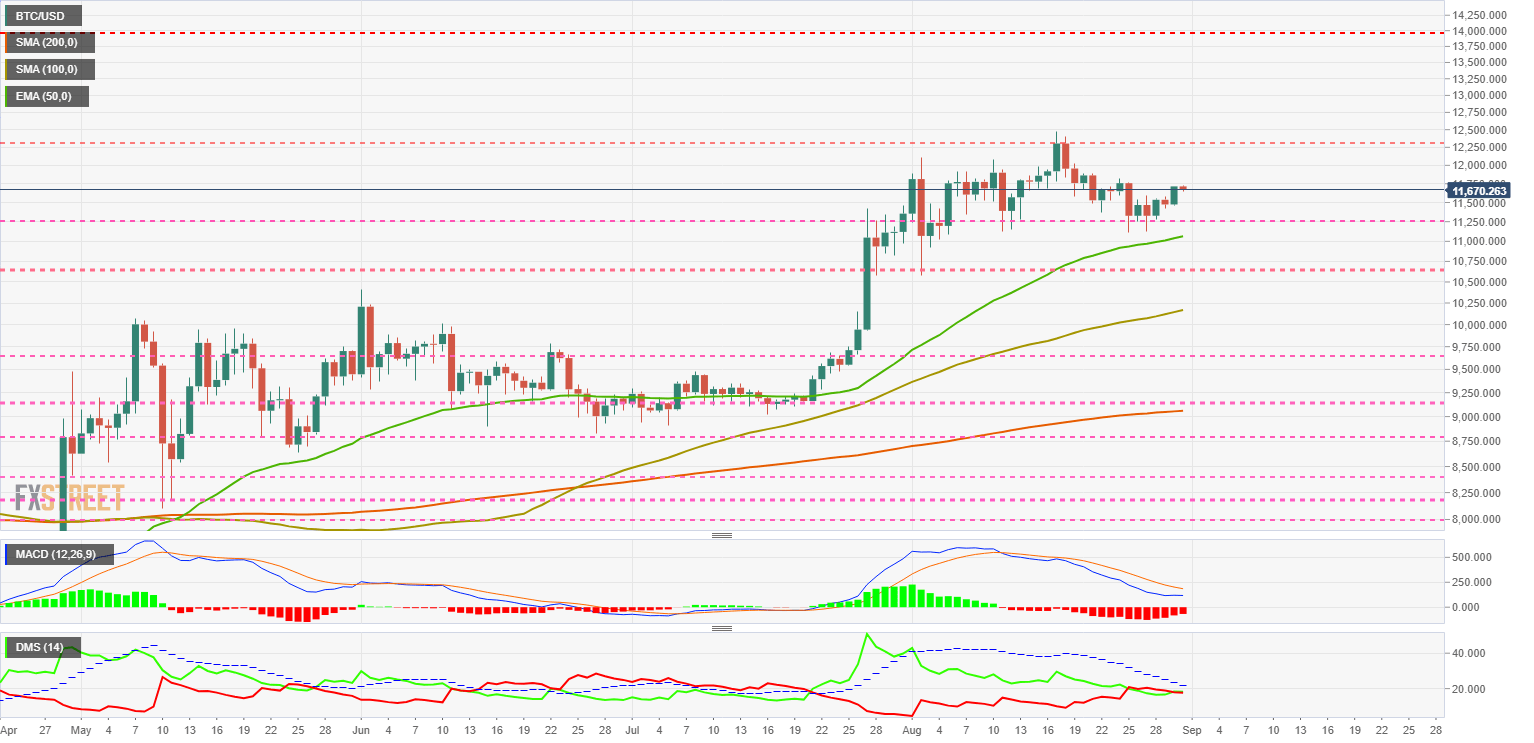
The MACD on the daily chart loses the previous bearish profile, although it does not turn up as if it has occurred in the case of the Ethereum. The BTC/USD pair does not show an adequate profile to be able to develop an upward movement.
The DMI on the daily chart shows bulls and bears in a technical tie. Either side of the market can gain control of the pair.
ETH/USD Daily Chart
The ETH/USD pair is currently trading at $423.90 and is moving downward following a rally in recent hours. The price was very close to the relative high (at closing) yesterday.
Above the current price, the first resistance level is at $440, then the second at $460 and the third one at $480.
Below the current price, the first support level is at $385, then the second at $360 and the third one at $320.
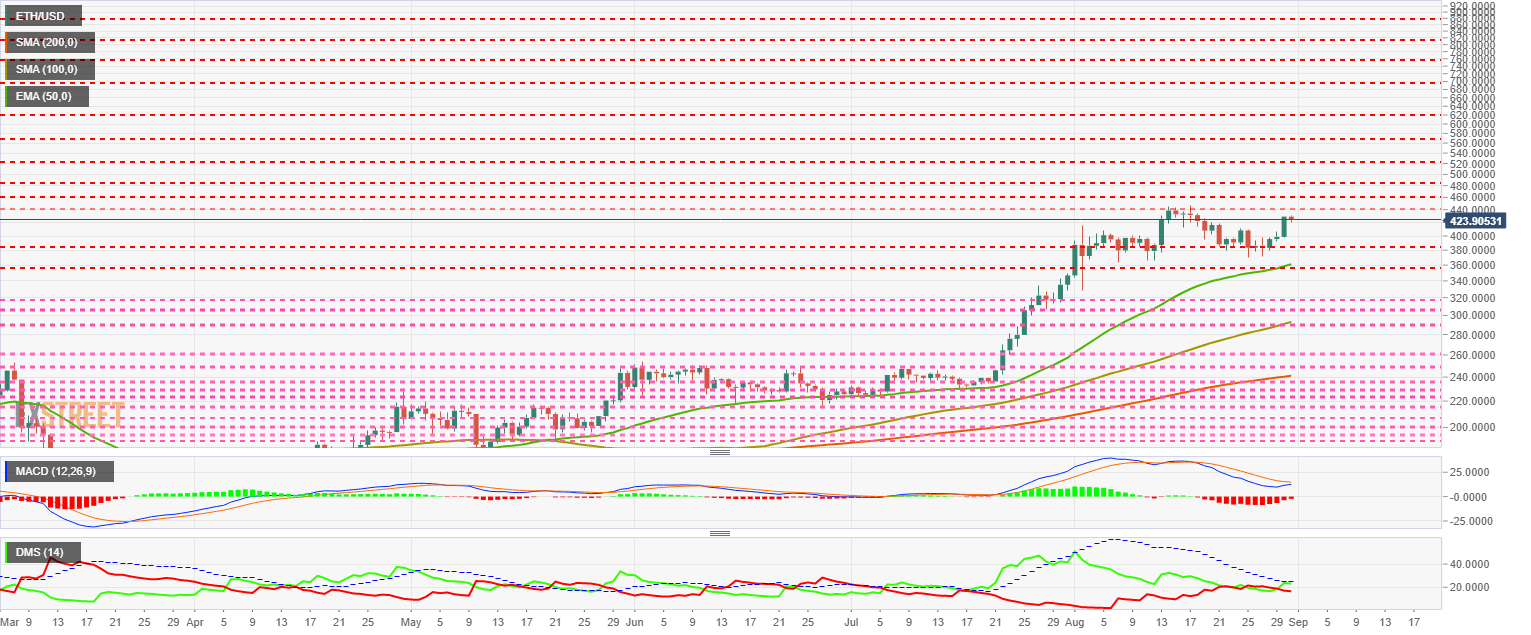
The MACD on the daily chart shows a bullish cross attempt in progress. The profile of the fast-moving average is not the best for this task. We could see a downward shift in the next few hours.
The DMI on the daily chart shows bulls trying to break the ADX line, a technical achievement that would trigger a bullish pattern in the short term.
XRP/USD Daily Chart
The XRP/USD pair is currently trading at the price level of $0.2824 and has been rising for three consecutive days since it found support at the 50-day exponential average.
Above the current price, the first resistance level is at $0.283, then the second at $0.289 and the third one at $0.30.
Below the current price, the first support level is at $0.268, then the second at $0.264 and the third one at $0.253.
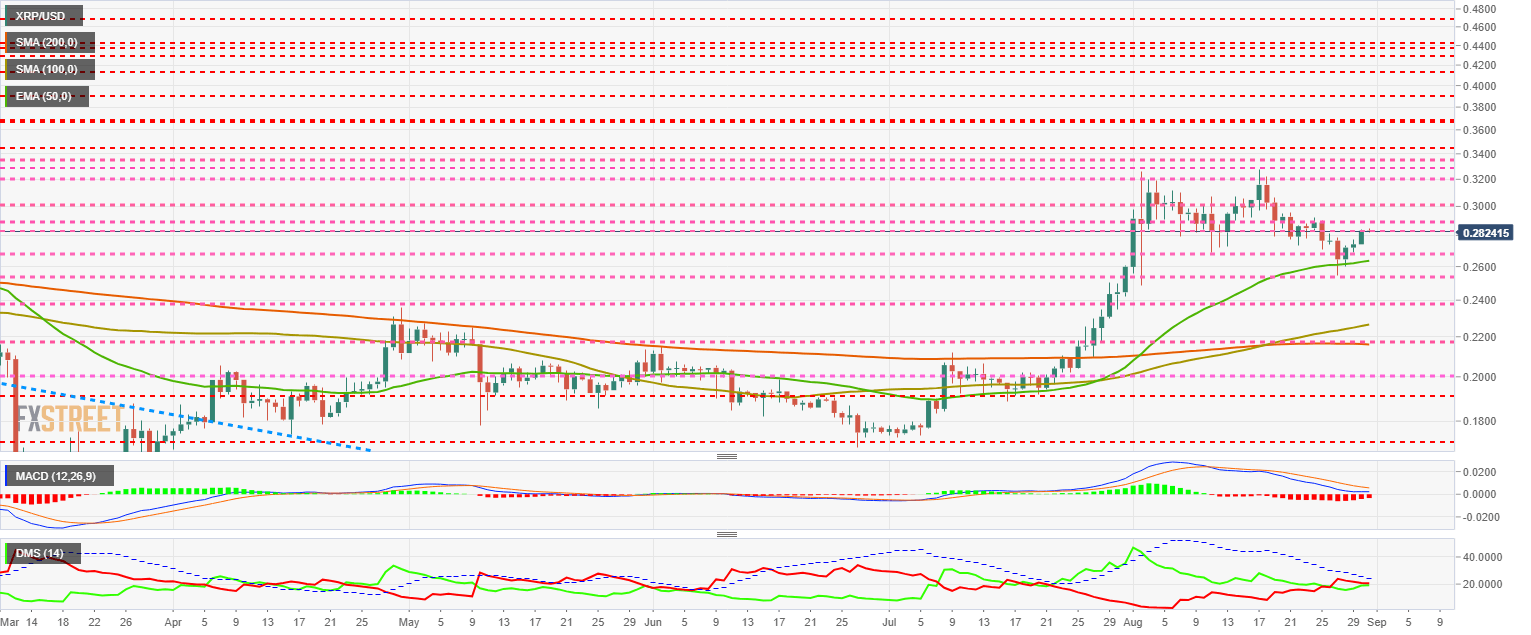
The MACD on the daily chart shows a flat profile, now far from last week's bearish profile. Despite the improvement, the indicator's position is not the most favorable for completing a bullish cross.
The DMI on the daily chart shows bulls and bears on the same level, although bears are still above it.
Author

Tomas Salles
FXStreet
Tomàs Sallés was born in Barcelona in 1972, he is a certified technical analyst after having completing specialized courses in Spain and Switzerland. He expanded his technical training following the guidance of great experts on the financial markets.


