Top 3 Price Prediction Bitcoin, Ethereum, Ripple: Crypto market is back on track to the moon
- Yesterday's gains on the crypto board are more important because of the levels conquered than for its magnitude.
- The battle for market dominance between Bitcoin and Ethereum continues and guides the market upwards.
- Ripple continues to be trapped in the recent low area and is lagging behind the market's upward momentum.

The increasing upward pressure blew the first of the critical resistances in the Bitcoin's path to new highs. The price of the BTC/USD pair reached the border of the bullish scenario, but the first attempt failed, and today it moves between crucial technical levels.
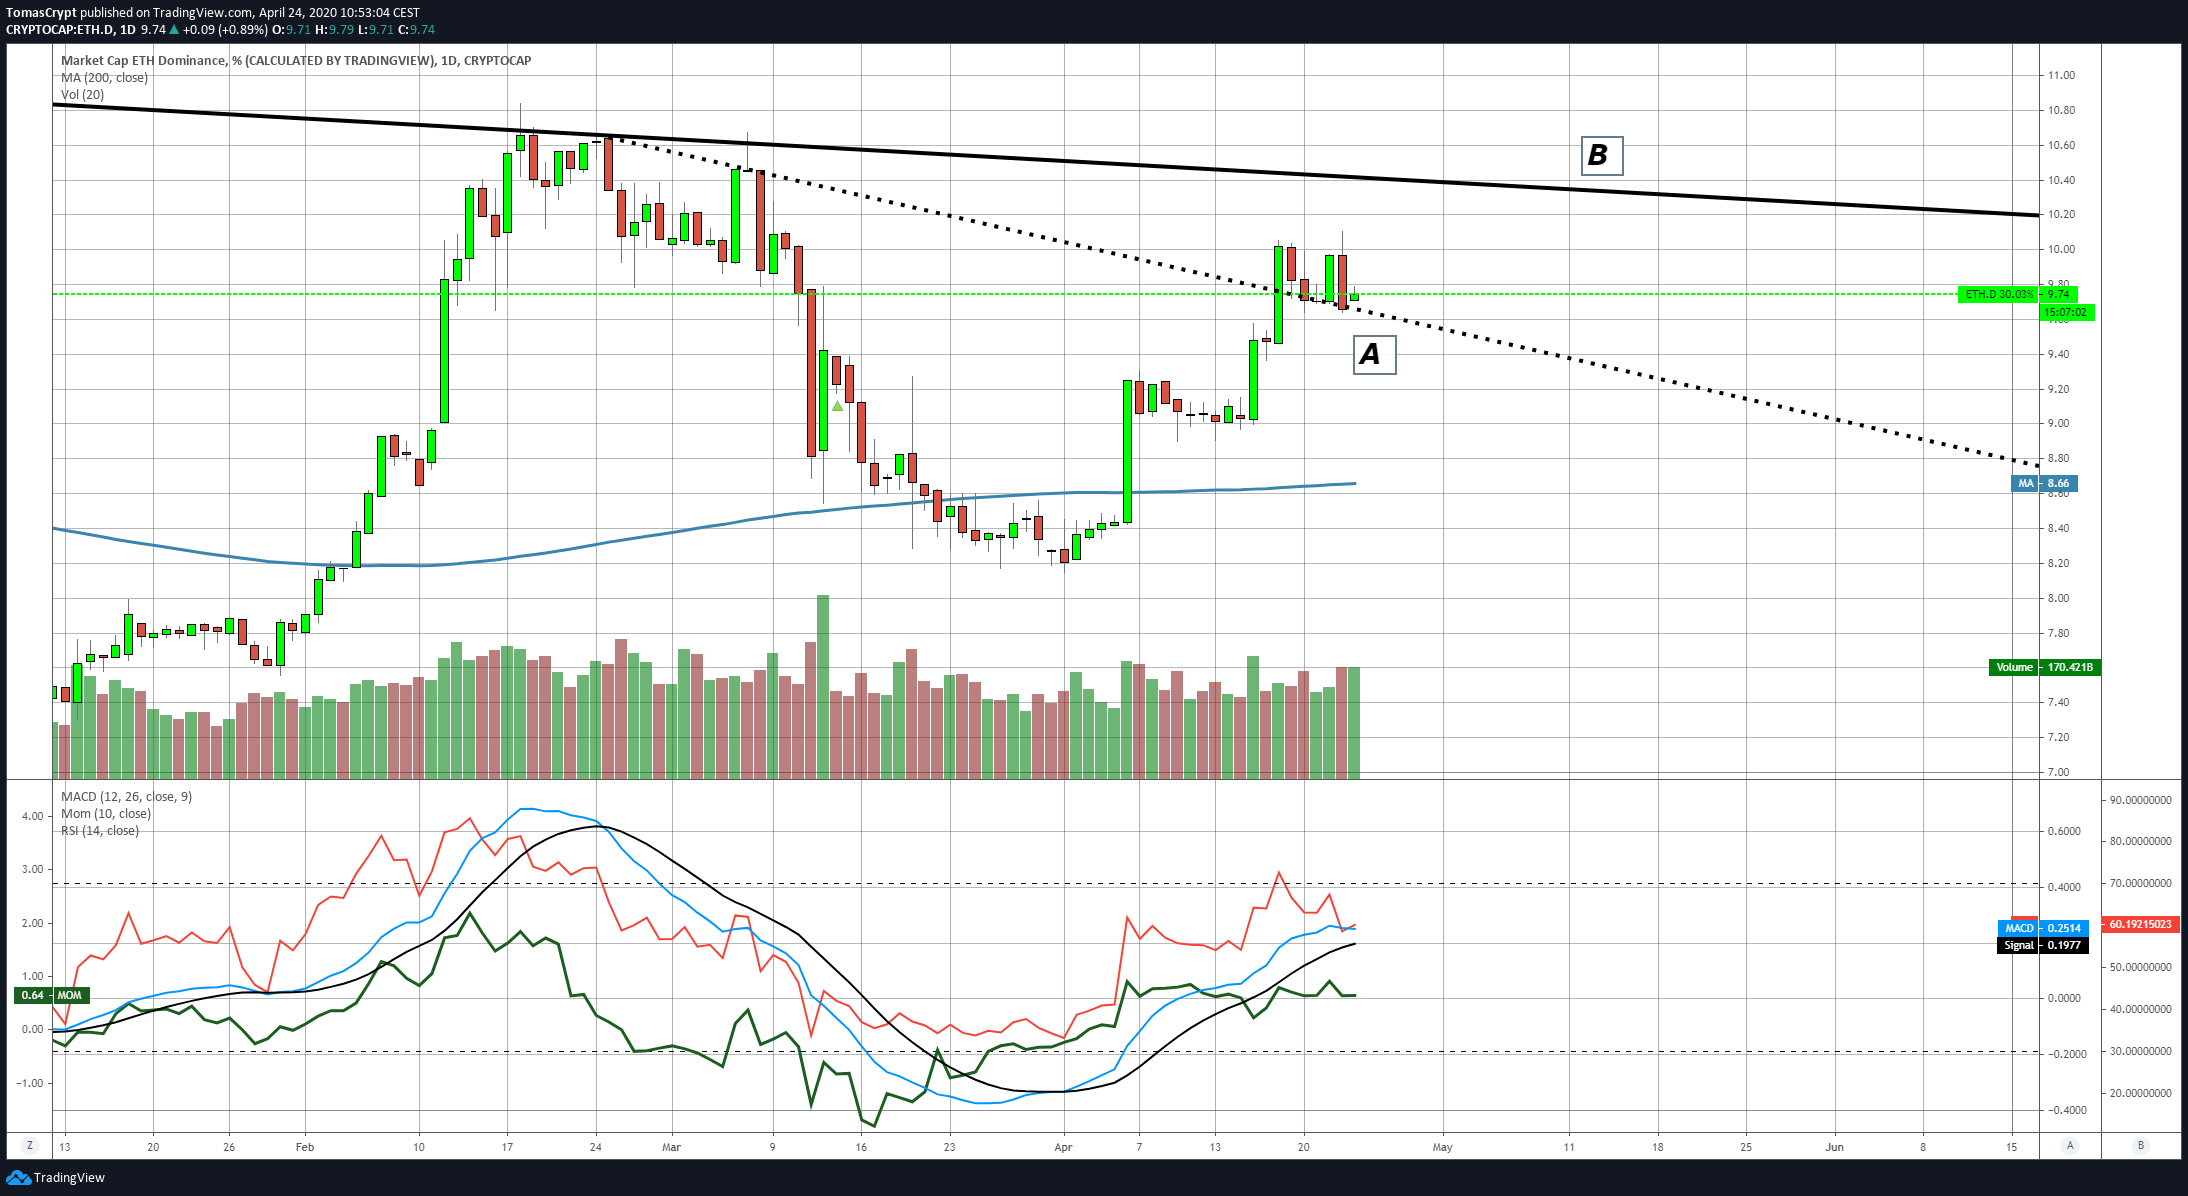
After yesterday's bullish attack, today it is Ethereum that is showing the desire to continue to struggle to increase its percentage of dominance in the crypto market. The strong reaction of the Bitcoin led the Ether's dominance chart to the support marked by the bearish trend line (A) beaten at the beginning of the week. The goal remains to break the May trend line (B) and it should not take long.
The market sentiment level is improving but diverges from the price movement and the areas where it is moving. Today the Greed & Fear indicator of alternative.me stays at level 20 – extreme fear.
In the time chart of this sentiment indicator, we can see how in the last weeks a structure of rising lows can be observed, although the highs are moving below the border between extreme fear and mild fear – level 20.
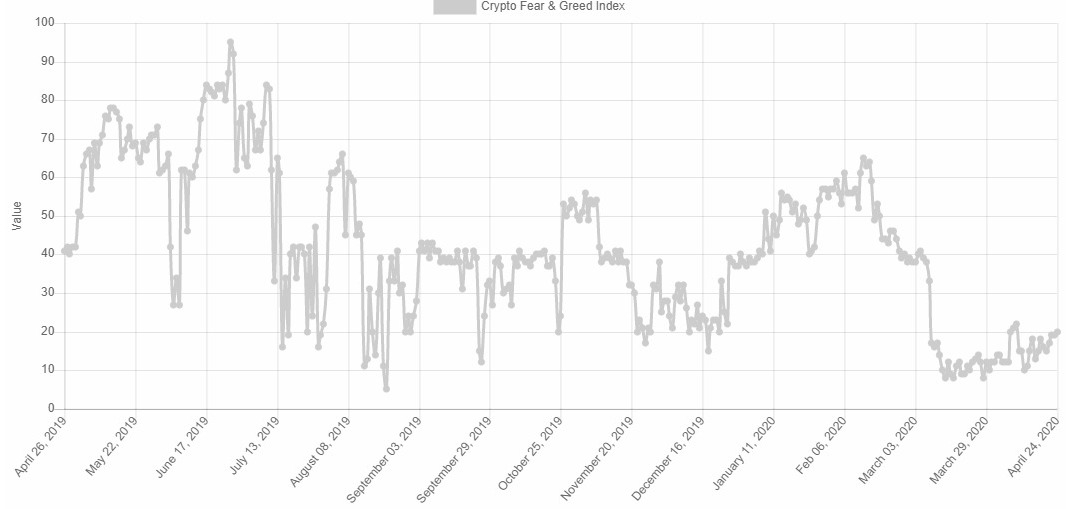
Source: alternative.me
The technical aspect of the Top 3 components is significantly improved, especially for Bitcoin and Ether, while XRP is again a step behind. The next few days are going to be definitive for the medium term, and if the increases continue at least until the middle of next week, we could see some very significant improvements in the coming months.
ETH/BTC Daily Chart
The ETH/BTC pair is currently trading at the price level of 0.0249 and reinforces the price congestion support at 0.0248 for another day. This price level is presently the critical support to watch for on the downside.
Above the current price, the first resistance level is at 0.026, then the second at 0.0268 and the third one at 0.0275.
Below the current price, the first support level is at 0.024.8, then the second at 0.0233 and the third one at 0.0228.
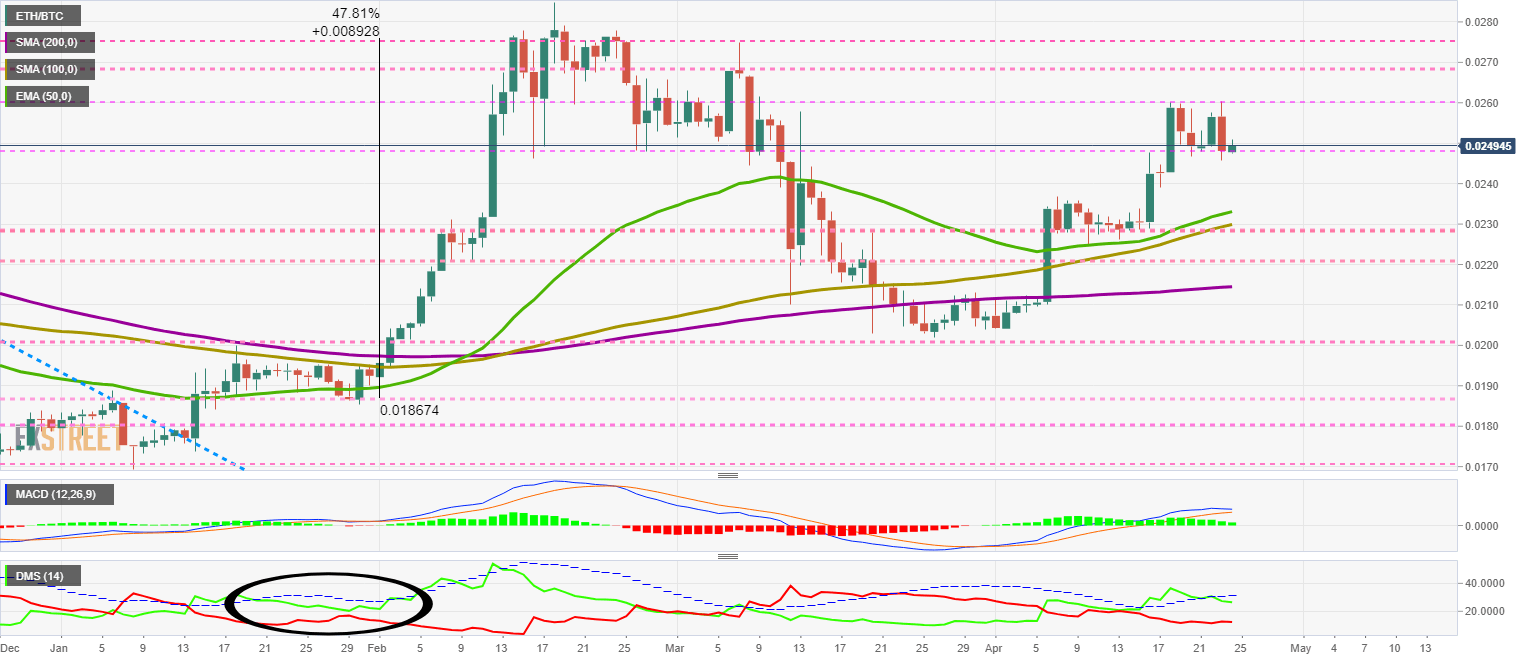
The DMI on the daily chart shows how the bulls are getting below the ADX line and disabling the bullish pattern. The secondary scenario is a repeat of the behaviour it had in January, where after losing the ADX support, the bulls reacted to the bullish move and started a bullish stretch with a 47.8% increase in the price.
BTC/USD Daily Chart
The BTC/USD pair is currently trading at the $7563 price level, and it seems that Bitcoin could move quickly upwards to face the significant obstacles that separate it from the bullish scenario.
Above the current price, the first resistance level is at $7600, then the second at $7800 and the third one at $8000.
Below the current price, the first support level is at $7400, then the second at $7150 and the third one at $7050.
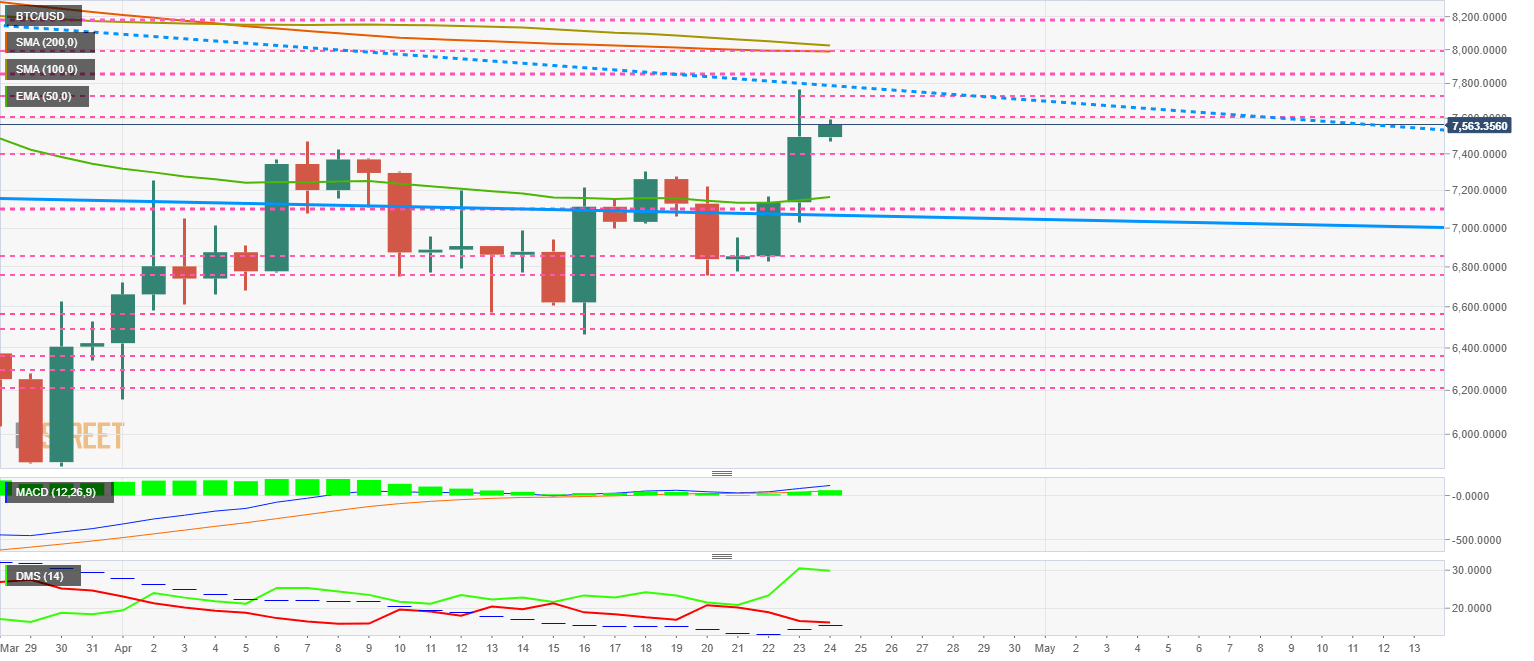
The DMI on the daily chart shows the bulls gaining momentum quickly. The bears are under pressure from the rising ADX line because a downward breach of the line would significantly strengthen the technical structure on the buying side.
ETH/USD Daily Chart
The ETH/USD pair is currently trading at the $188.6 price level, and as with BTC/USD, it is moving quickly in search of yesterday's highs in the price congestion resistance at $195.
Above the current price, the first resistance level is at $190, then the second at $195 and the third one at $200.
Below the current price, the first support level is at $180, then the second at $170 and the third one at $160.
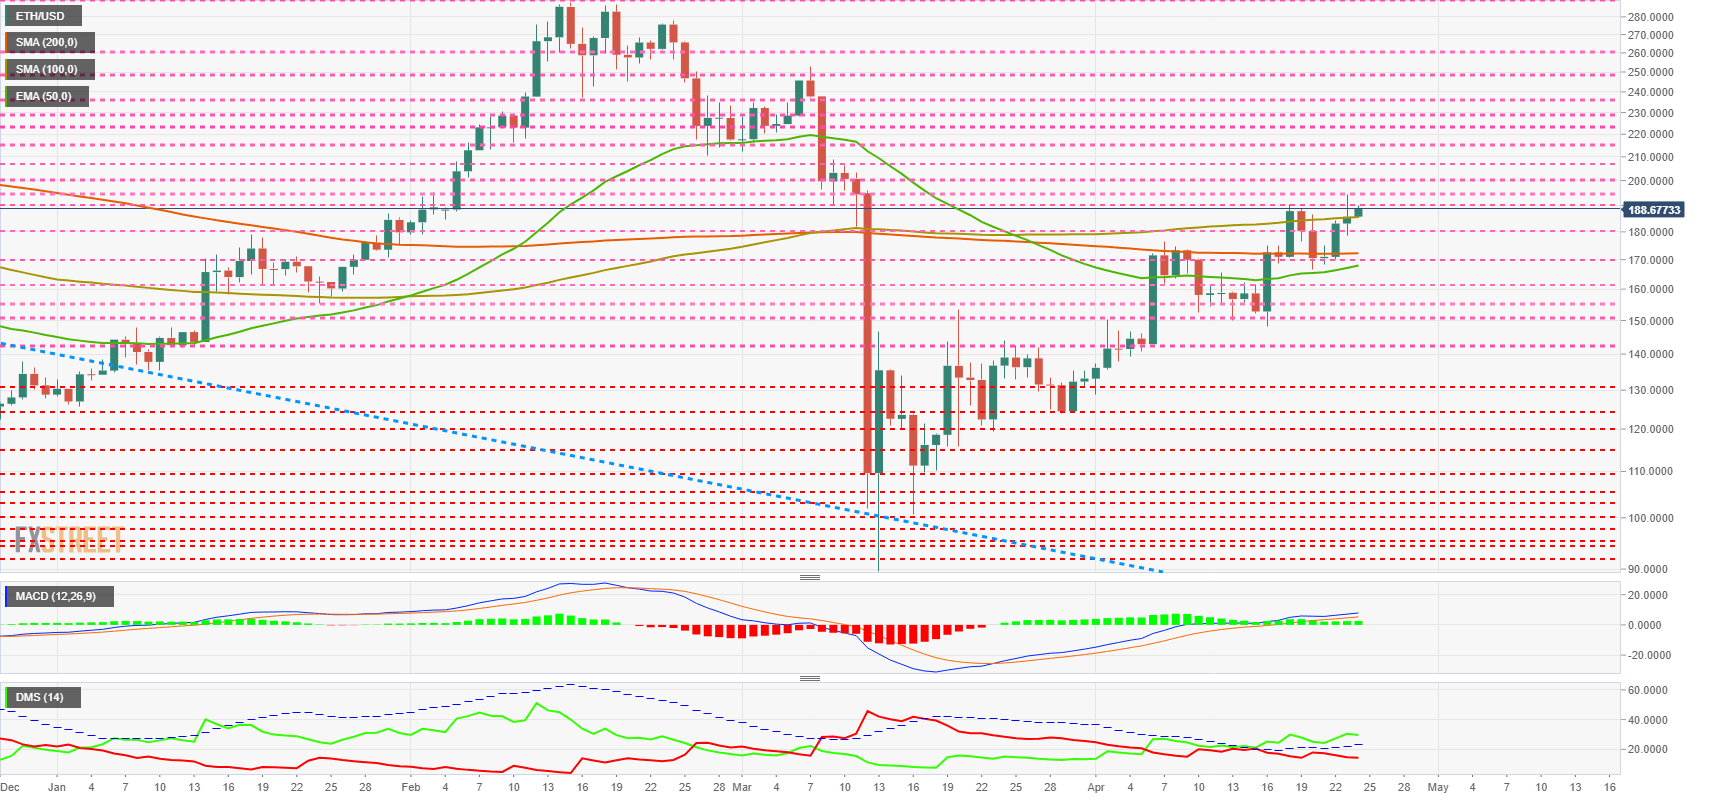
The DMI on the daily chart shows the bulls consolidating the bullish structure, while the ADX line is moving up in parallel and helping to strengthen the uptrend.
XRP/USD Daily Chart
The XRP/USD pair is trading at $0.196 and today may repeat yesterday's attempt to break the $0.20 resistance level. XRP is lagging behind the Bitcoin and Ethereum in recent gains.
Above the current price, the first resistance level is at $0.20, then the second at $0.218 and the third one at $0.23.
Below the current price, the first support level is at $0.19, then the second at $0.171 and the third one at $0.169.
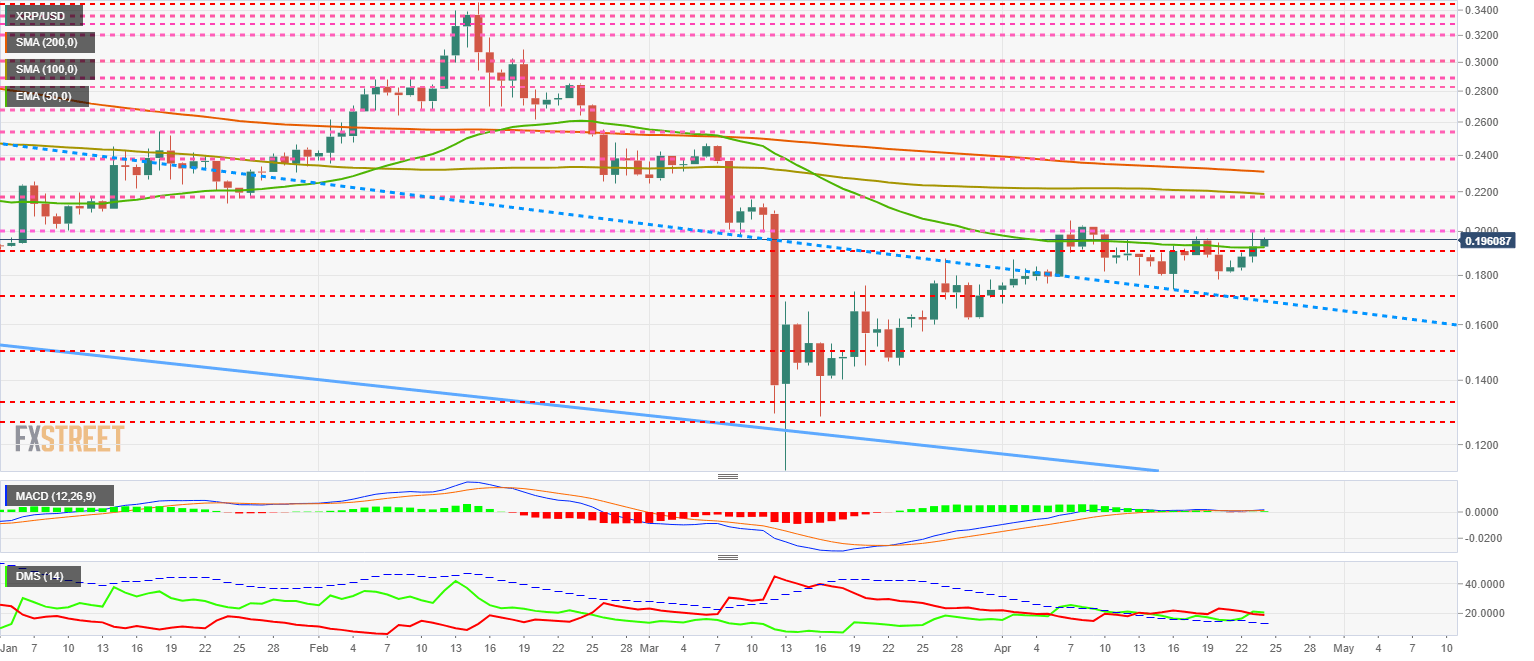
The DMI on the daily chart shows the bulls sticking their heads out over the bears. The advantage of the buy-side over the sell-side is so small that it doesn't change the dangerous ambiguity of the previous days.
Author

Tomas Salles
FXStreet
Tomàs Sallés was born in Barcelona in 1972, he is a certified technical analyst after having completing specialized courses in Spain and Switzerland. He expanded his technical training following the guidance of great experts on the financial markets.


