Top 3 Price Prediction Bitcoin, Ethereum, Ripple: Crypto market hesitating between rising now or summertime
- The market moves at breakout levels but exhaustion challenges the ability to succeed.
- Ethereum bets on leading the bullish breakout for the short term.
- Ripple plays his chances for an unexpected bullish surprise to break the bad streak of the last few months.

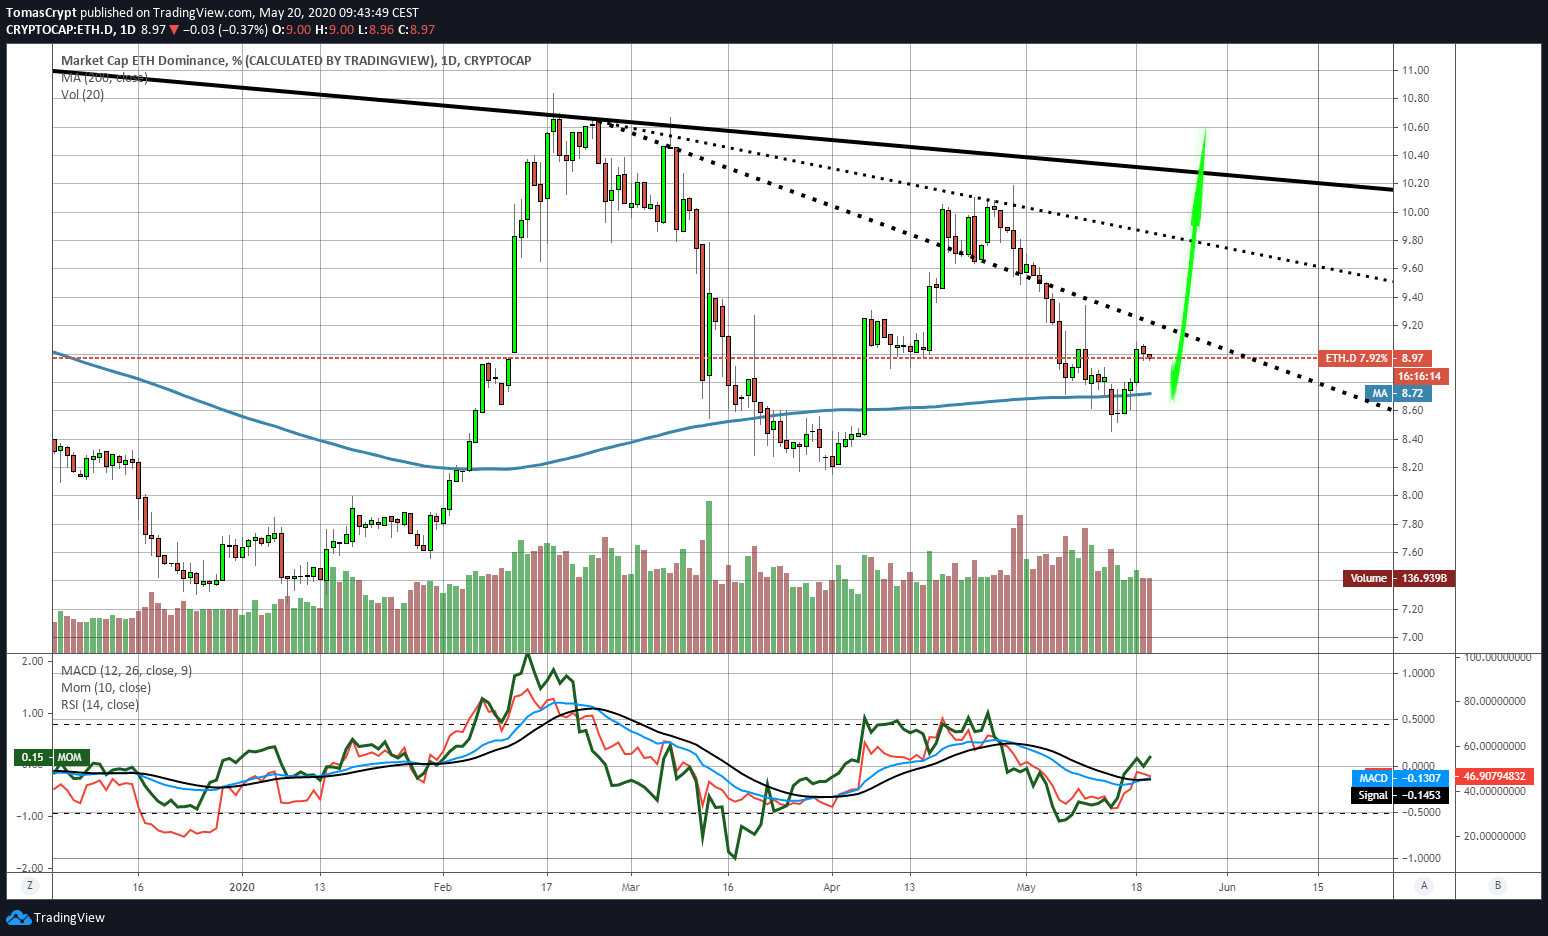
The dispute over the dominance of the crypto market continues and sets the pace for the market.
It's the turn of the Ethereum in the face of the apparent weakness of Bitcoin. The technical indicators in the Bitcoin dominance chart show a bearish structure.
In the case of the Ethereum dominance chart, they show a potentially bullish structure that could take the Ether's market share above 10% of the total market.
Regarding the connection between the crypto segment and the old economy, the valuations of the leading crypto assets are favourable.
For traders who look at the value of their portfolio in US dollar or euro terms, the market is at a comfortable level, and the market momentum is increasingly positive.
A moderate optimism is starting to spread through the market. Traders hopes in the positive effect of the Bitcoin halving and the expectations placed in the release of the Ethereum 2.0 version.

The sentiment indicator that the alternative.me site produces today marks the 50 levels and enters a zone of resistance that extends to the 65 levels. Above the 60 levels, prices are accelerating rapidly, but it is necessary to move from the 70 levels to see the crypto market expressing its full bullish potential.
ETH/BTC Daily Chart
The ETH/BTC pair is currently trading at the price level of 0.0218 and is chained for three days in a row, failing to reach the resistance level of 0.022. Ethereum needs to do much better than Bitcoin, aiming to break the triangle figure higher than the 0.0245 level.
Above the current price, the first resistance level is at 0.022, then the second at 0.0228 and the third one at 0.0238.
Below the current price, the first support level is at 0.0216, then the second at 0.0205 and the third one at 0.020.
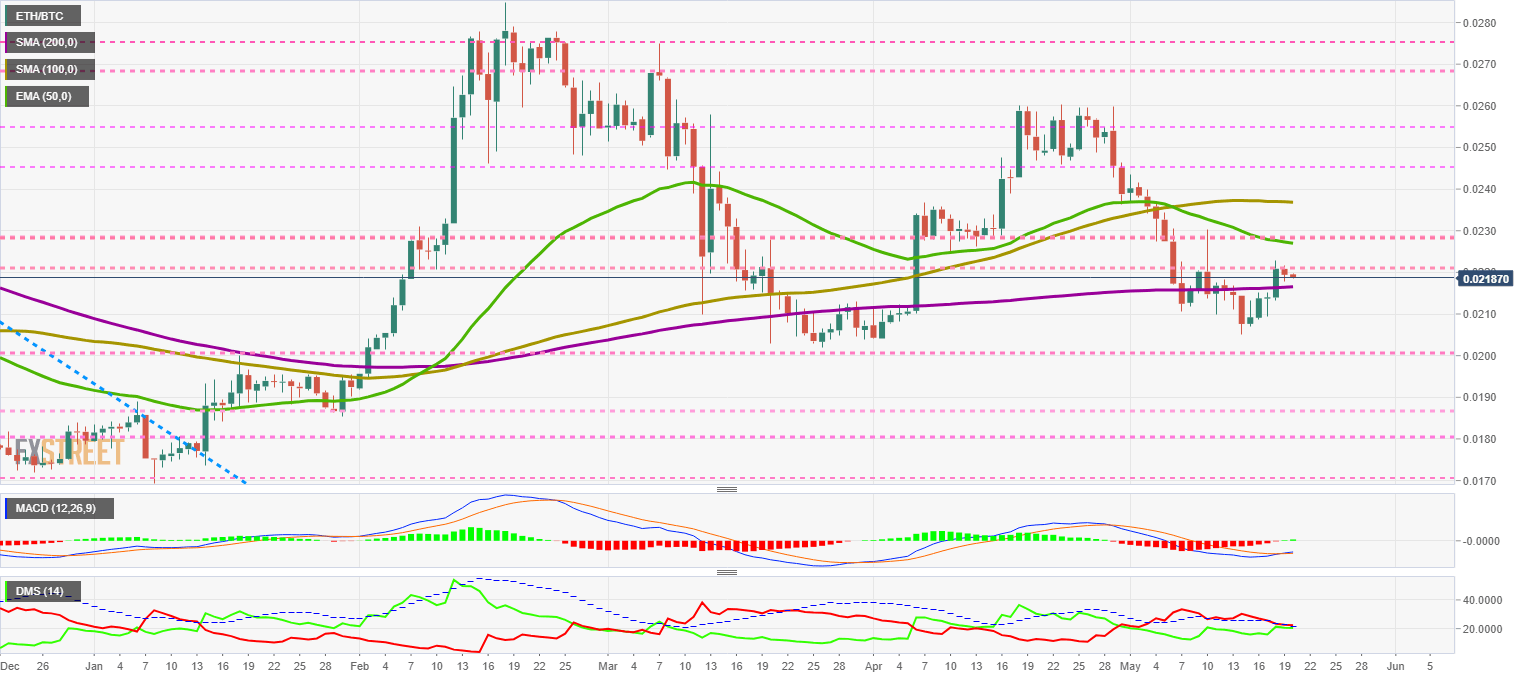
The MACD on the daily chart completes the bullish cross but is not mature enough to warrant further upward movement.
The DMI on the daily chart is a perfect illustration of the importance of the moment. Bears and bulls are at the same point, and the resolution will mark the price development in the medium term.
BTC/USD Daily Chart
The BTC/USD pair is currently trading at $9770 and continues to consolidate the upward breakout from the trend line that began at the June 2019 high. In the short term, vital support is at the $9450 level.
The main moving averages are moving around $8150. They are calling for an upward movement that will allow the 100 and 200-day simple moving averages to gain a bullish profile and reinforce the current positive momentum.
Above the current price, the first resistance level is at $10400, then the second at $11250 and the third one at $12000.
Below the current price, the first support level is at $9650, then the second at $9450 and the third one at $9200.
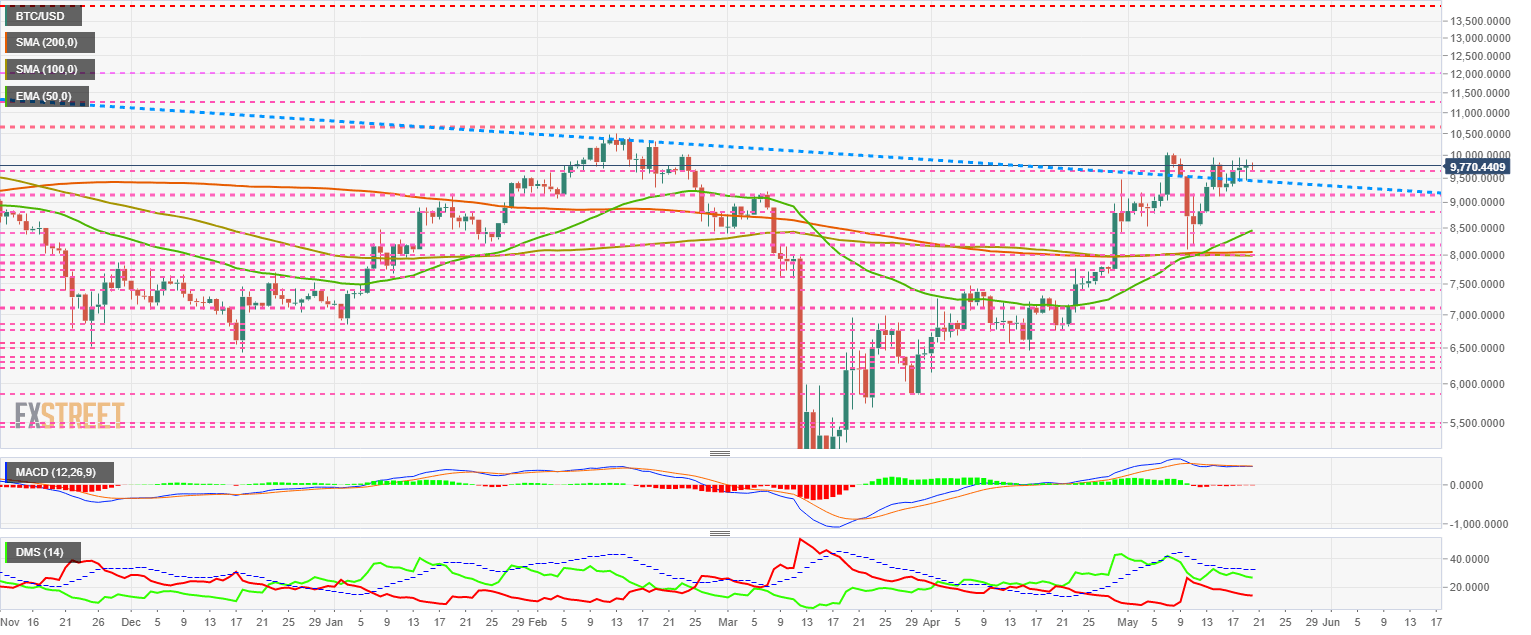
The MACD on the daily chart continues to show a unique profile. The moving averages continue to show a completely flat profile but at an unusual height. This structure is unstable, and the output may be violent and of uncertain direction.
The DMI on the daily chart reflects the uncertainty of the moment, with both sides of the market, losing strength and no interest in leading the price movement.
ETH/USD Daily Chart
The ETH/USD pair is currently trading at the $213.2 price level while moving within a long-term triangle structure. The breakout level is at $235, while the main moving averages form a significant support level at $190.
Above the current price, the first resistance level is at $215, then the second at $224 and the third one at $235.
Below the current price, the first support level is at $205, then the second at $200 and the third one at $195.
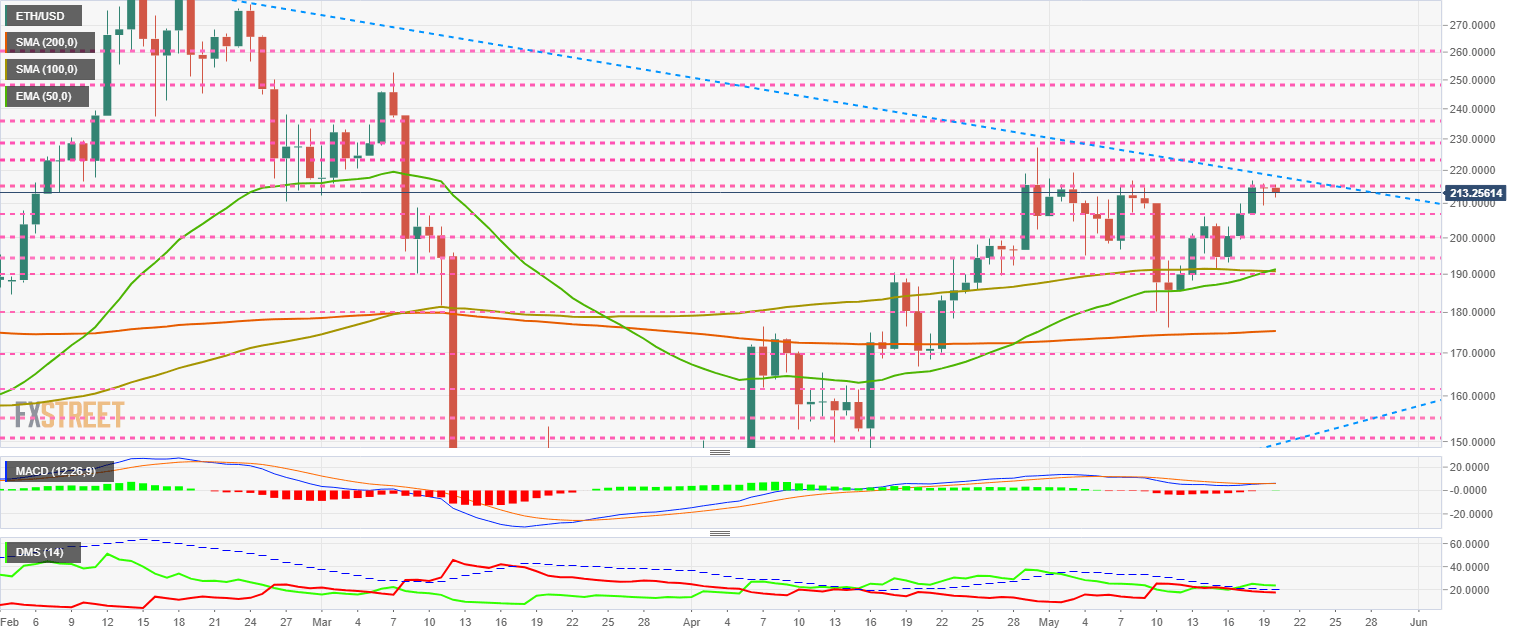
The MACD on the daily chart is losing its upward slope and threatens to undo the recent upward movement. This structure calls for a short-term rally to avoid a momentary loss that would delay the next uptrend for a few weeks.
The DMI on the daily chart shows that the bulls set to accelerate the upward movement, but the bears are still very close and could hit the bullish trend if the price does not rise in the short term.
XRP/USD Daily Chart
The XRP/USD pair is currently trading at the price level of $0.204. The price range is tightening between the 50-day exponential moving average and the medium-term downward sloping trend line that begins at the mid-February relative high.
The structure of the moving averages suggests a price movement towards the $0.22 level and then to the $0.24 level, causing a bullish cross for the summer.
Above the current price, the first resistance level is at $0.21, then the second at $0.22 and the third one at $0.238.
Below the current price, the first support level is at $0.20, then the second at $0.19 and the third one at $0.17.
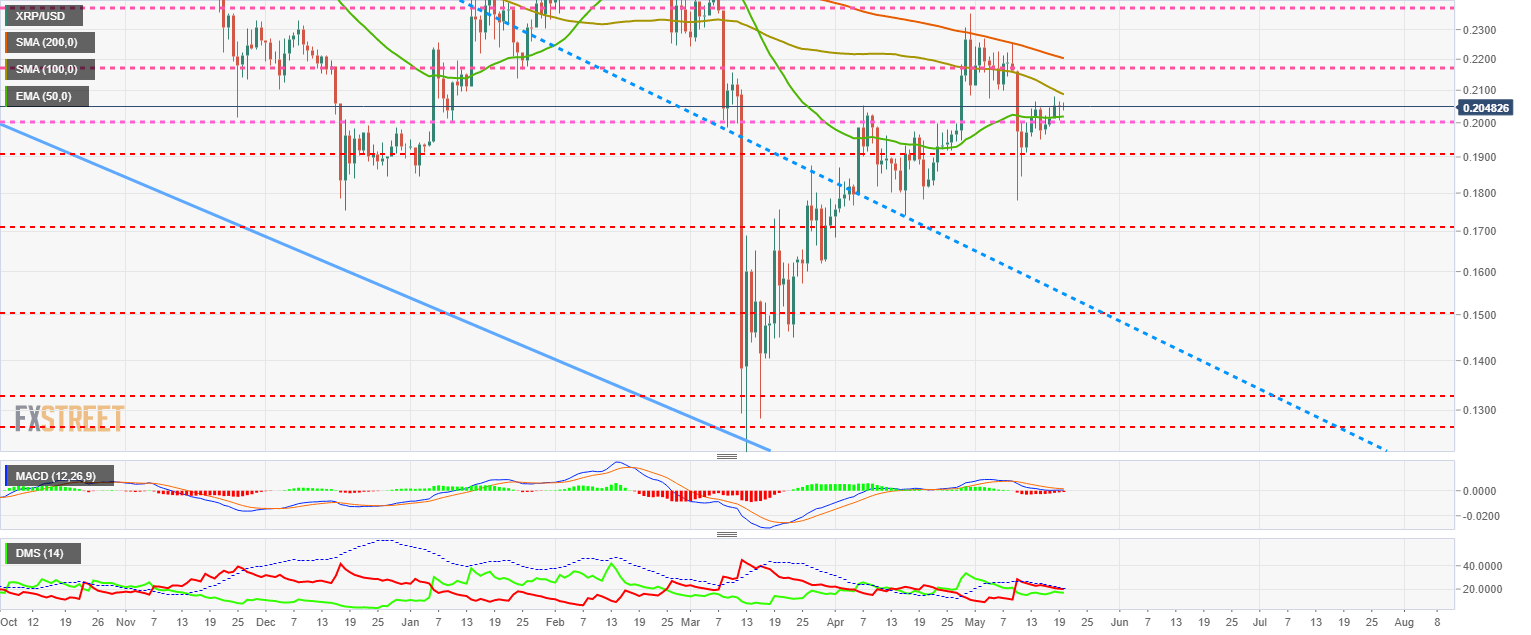
The MACD on the daily chart is preparing for a bullish cross after finding support at the neutral level of the indicator.
The DMI on the daily chart shows both sides of the market compressed below the ADX line. This type of structure usually solves with a violent movement of which we do not know the direction at the moment.
Author

Tomas Salles
FXStreet
Tomàs Sallés was born in Barcelona in 1972, he is a certified technical analyst after having completing specialized courses in Spain and Switzerland. He expanded his technical training following the guidance of great experts on the financial markets.


