Top 3 Price Prediction Bitcoin, Ethereum, Ripple: Crossroads in the war for dominance
- Ethereum consolidates the 10% market share, looking forward to breaching the 10.25% level.
- The sentiment level shoots up again and clearly shows the two-way moment in the crypto market.
- Ripple is refusing to join the bullish party and remains anchored at the $0.20 level.

At the beginning of the day, the crypto market is awaiting the resolution of two critical technical events for the development of prices in the short and medium-term.
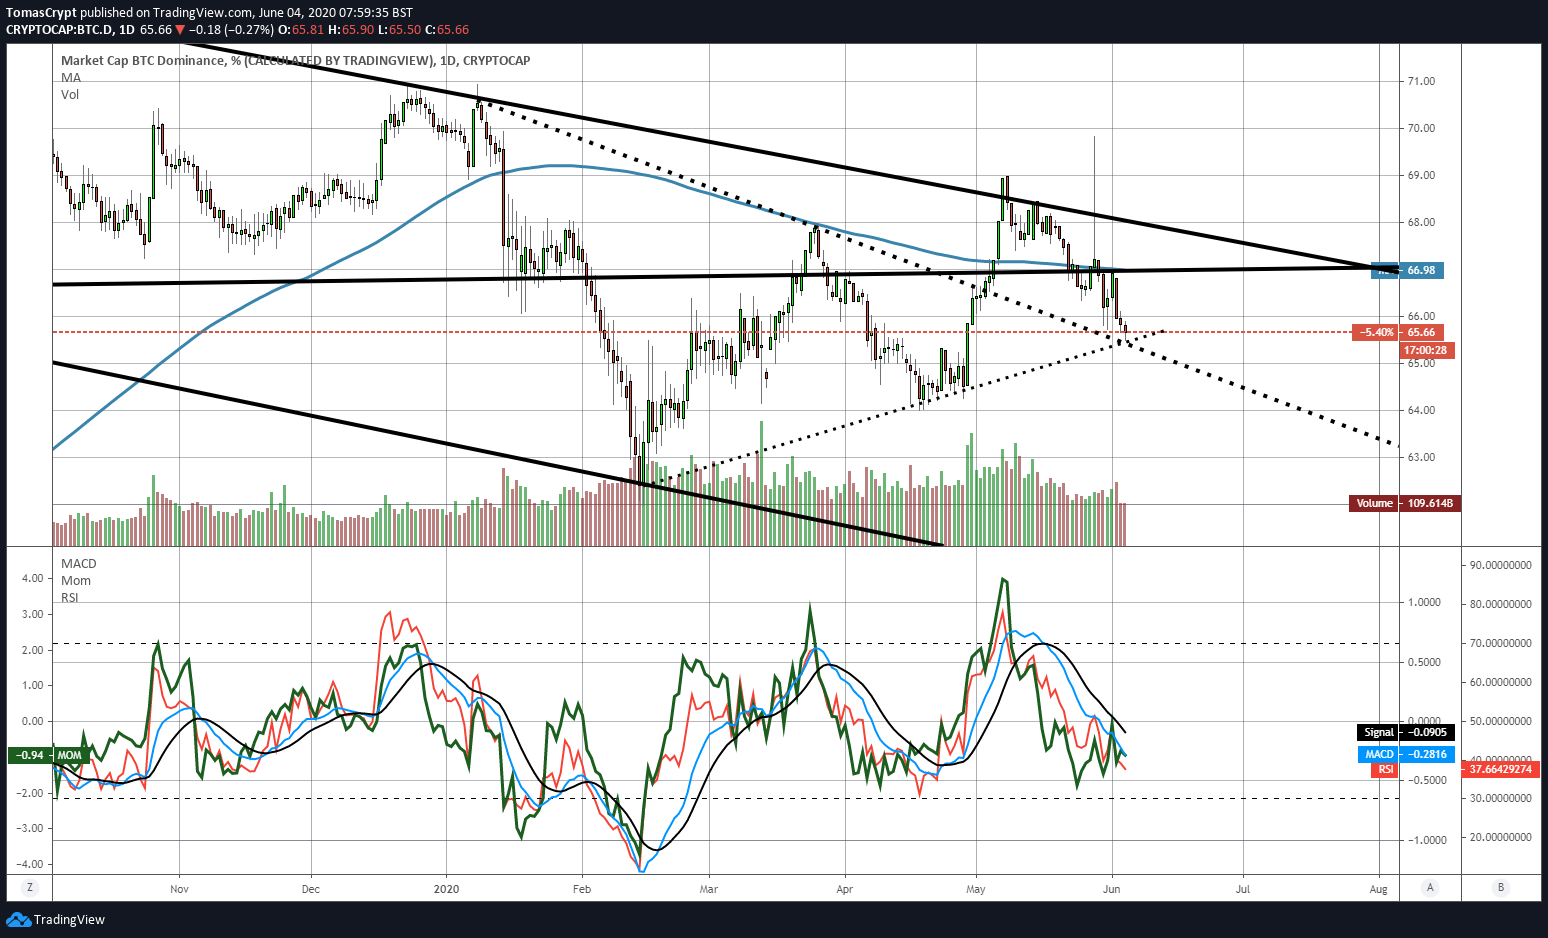
First, the Bitcoin dominance chart shows how it has found support at the 65.5% market share level and is rebounding upwards. Technical indicators do not confirm the support level and would need a significant rise in the dominance level to set up for a trend change.
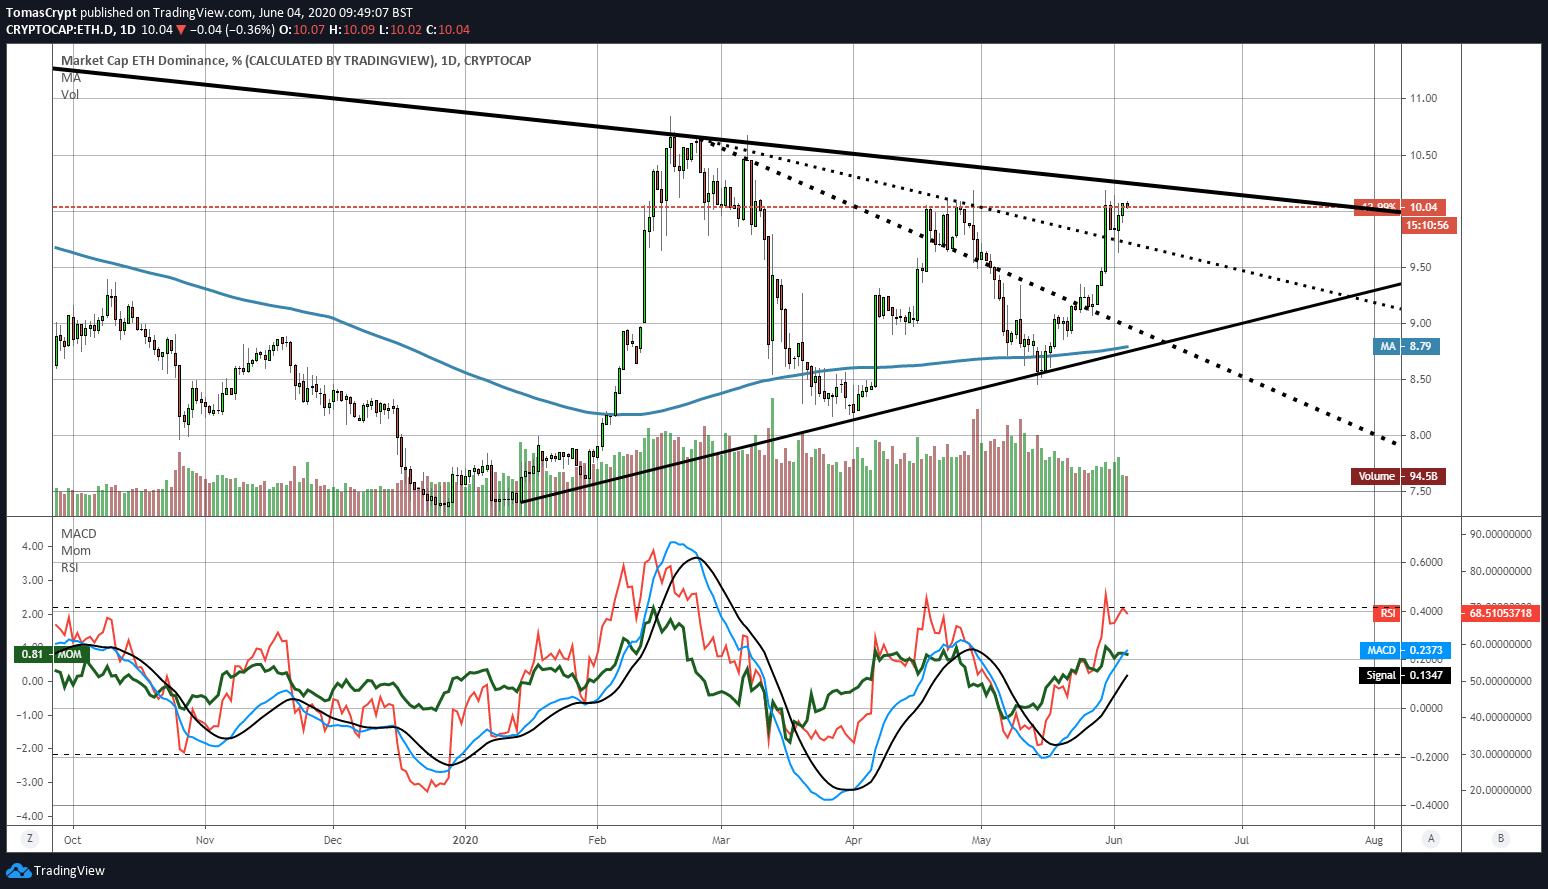
Secondly, the other side of the coin shows the dominance chart of Ethereum, stranded at the 10% market share level and only 0.25% away from entering a scenario where Ether would have the possibility to improve its weight significantly in the cryptocurrency market.
The market participants "feel" the value of the current moment. If yesterday the confidence level plummeted by more than 10%, today it rises by a similar magnitude and reaches the 54th level of the indicator.

Source: alternative.me
ETH/BTC Daily Chart
The ETH/BTC pair is currently trading at the price level of 0.02524. The 50-day exponential moving average is in the middle of an upward movement from the 100-day simple average, resulting in the emergence of short sales. The last time the exponential average crossed a simple average upwards was in February, and it caused the pair to rise by 50%.
Above the current price, the first resistance level is at 0.0258, then the second at 0.0268 and the third one at 0.0275.
Below the current price, the first support level is at 0.0228, then the second at 0.022 and the third one at 0.0218.
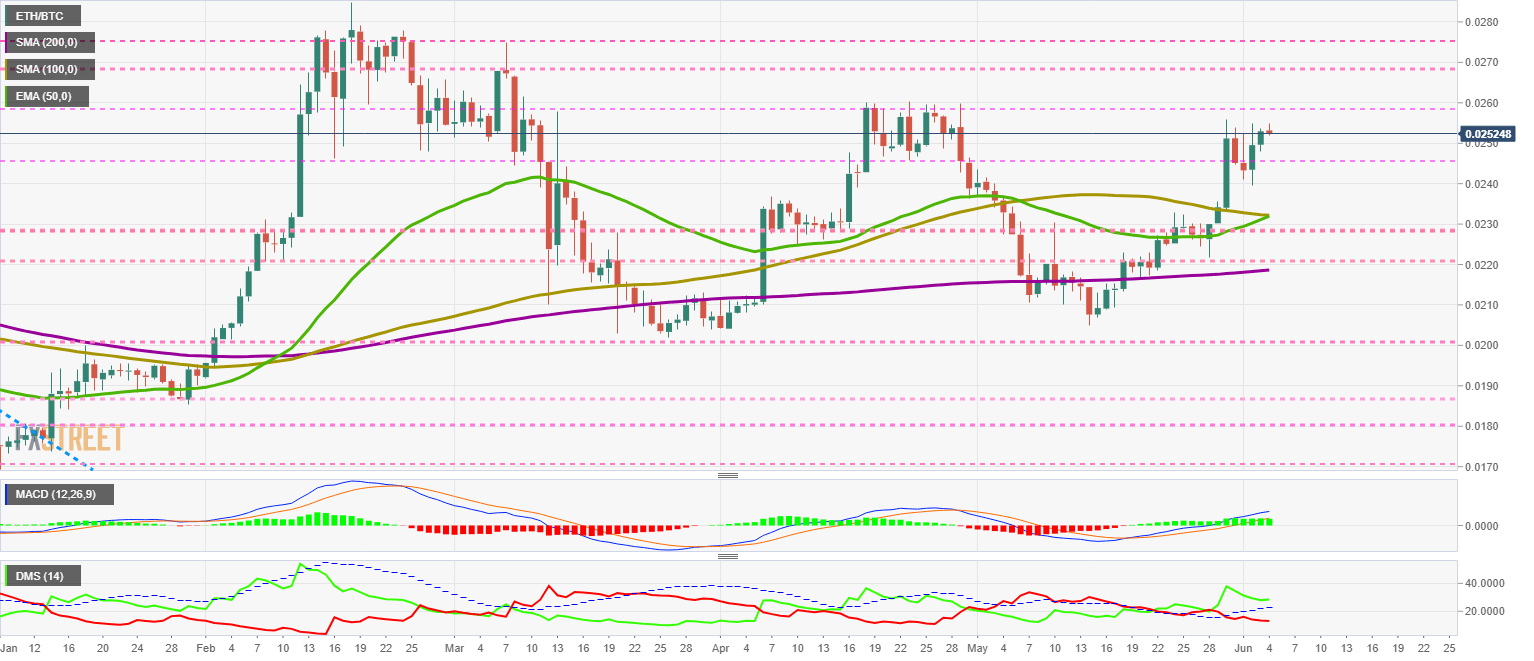
The MACD on the daily chart maintains the same bullish profile as the previous days but may lose some of its upward momentum if it doesn't receive a fresh bullish impulse in the next few days.
The DMI on the daily chart shows the bulls moving up again, while the bears continue to lose momentum.
BTC/USD Daily Chart
The BTC/USD pair is currently trading at $9651 and is just above the resistance line that has been congesting the price since early May. The major moving averages continue to gain momentum.
Above the current price, the first resistance level is at $9660, then the second at $10380 and the third one at $11250.
Below the current price, the first support level is at $9150, then the second at $8800 and the third one at $8400.
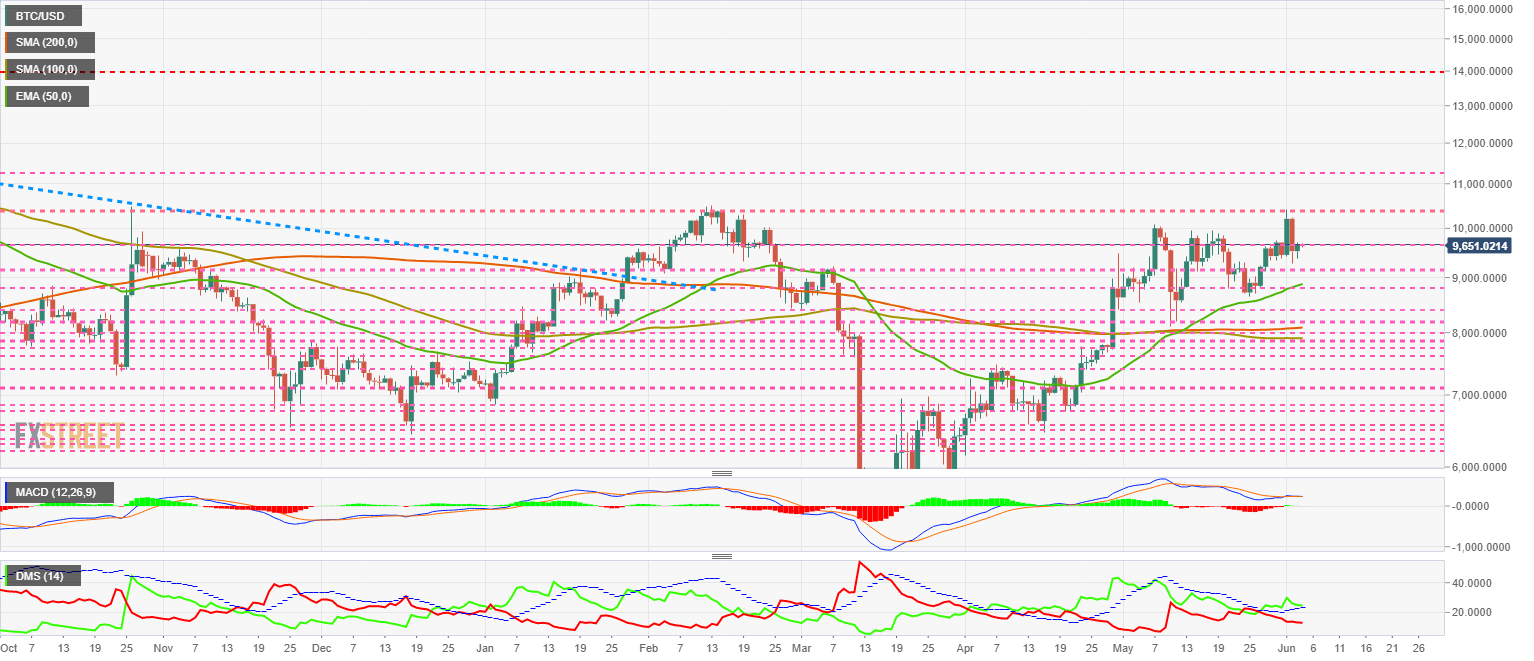
The MACD on the daily chart continues to show a very flat, slightly downward-sloping profile, which doesn't transmit much information in the short term.
The DMI on the daily chart shows the bulls moving upwards after finding support on the ADX line. Bears continue to lose strength and show little confidence on the sell-side.
ETH/USD Daily Chart
The ETH/USD pair is currently trading at $243.8 while the significant moving averages continue to trend higher. The market is looking forward to the possibility of a breakout above the $250 level, which would take the Ether price to $300 quickly.
Above the current price, the first resistance level is at $250, then the second at $260 and the third one at $290.
Below the current price, the first level of support is at $237, then the second at $230 and the third one at $221.
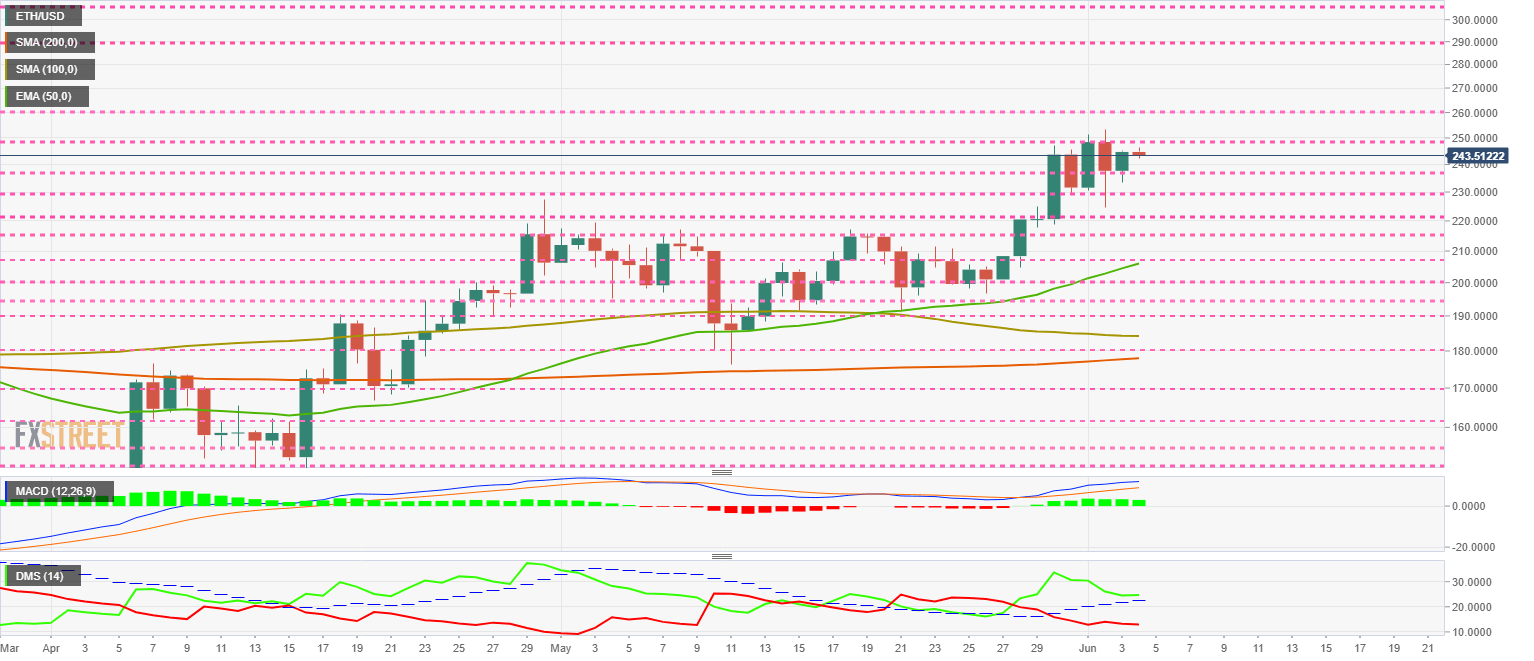
The MACD on the daily chart is losing some of its upward momentum from the moving averages but maintaining the positive line separation. The current structure usually develops with lateral upward movements in the price.
The DMI on the daily chart shows the bulls gaining strength again after reaching the ADX line. The bears continue to move lower and rule out any possibility of taking the lead.
XRP/USD Daily Chart
The XRP/USD pair is currently trading at $0.2050 and has been in the same range since late April. The 100-day and 200-day simple moving averages are still tilted lower, although the 50-day exponential average breaks this trend and turns higher.
Above the current price, the first resistance level is at $0.22, then the second at $0.24 and the third one at $0.258.
Below the current price, the first support level is at $0.20, then the second at $0.18 and the third one at $0.166.
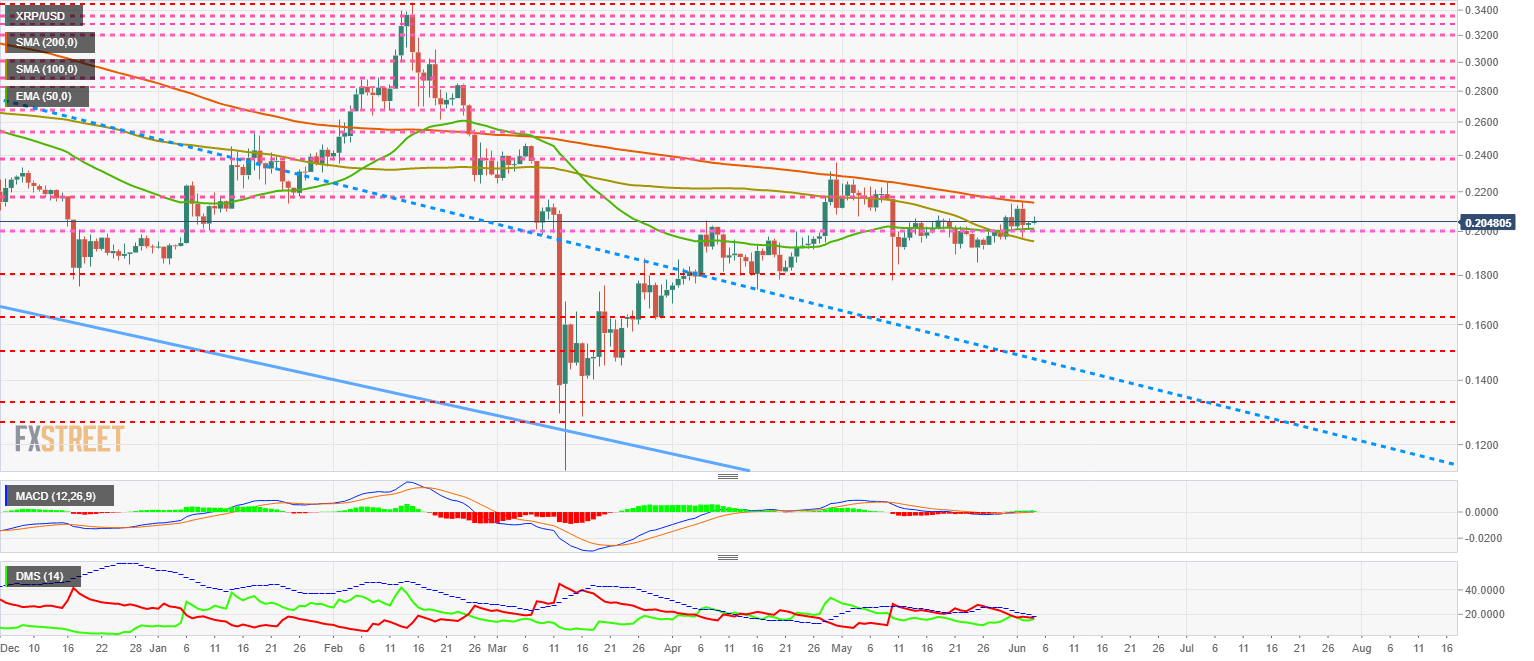
The MACD on the daily chart shows a very flat profile while it remains above the neutral level of the indicator. The MACD on the daily chart shows a very flat profile while it remains above the neutral level of the indicator.
The DMI on the daily chart shows both sides of the market tied again after the bears took a slight lead yesterday.
Author

Tomas Salles
FXStreet
Tomàs Sallés was born in Barcelona in 1972, he is a certified technical analyst after having completing specialized courses in Spain and Switzerland. He expanded his technical training following the guidance of great experts on the financial markets.


