Top 3 Price Prediction: Bitcoin, Ethereum, Ripple – BTC and XRP stabilize, ETH nears all-time high
- Bitcoin price stabilizes around $119,000 on Wednesday, after failing to close above $120,000.
- Ethereum climbs past $4,500, with bulls eyeing the record highs near $4,868.
- XRP price faces a key daily resistance at $3.40, a breakout could trigger a rally ahead.

Bitcoin (BTC) and Ripple (XRP) stabilize below their key resistance levels; a firm close above indicates a rally ahead. In the meantime, Ethereum (ETH) bulls take control of the momentum, surpassing $4,500 mark and targeting its record highs at $4,868.
Bitcoin could rally if it closes above $120,000 psychological barrier
Bitcoin price faced resistance around its key psychological level barrier at $120,000 on Monday and declined slightly. However, it reattempted to close above this resistance the next day but failed again. At the time of writing on Wednesday, it hovers below around $119,500.
If BTC closes above the $120,000 psychological level on a daily basis, it could extend the rally toward its record high of $123,218. If a successful close above this level occurs, BTC would enter price discovery mode with bulls targeting the psychological level of $125,000.
The Relative Strength Index (RSI) on the daily chart reads 59, above its neutral level of 50, indicating bullish momentum. The Moving Average Convergence Divergence (MACD) showed a bullish crossover on Monday, giving a buy signal and suggesting an upward trend.
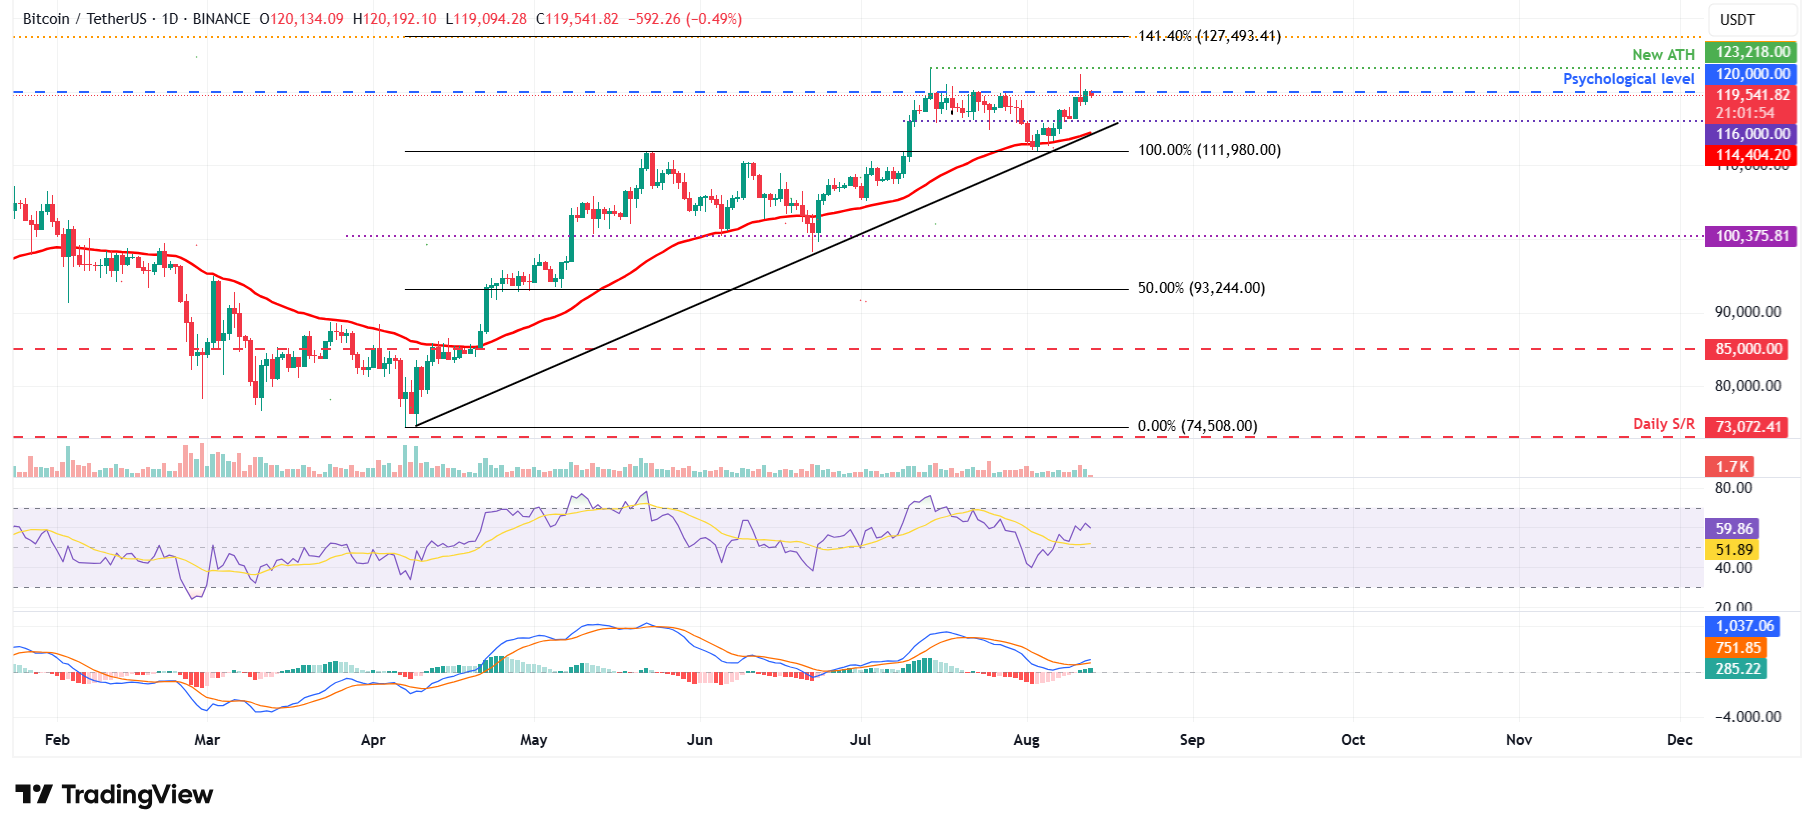
BTC/USDT daily chart
If BTC faces a correction from its $120,000 level, it could extend the decline to find support around the daily level at $116,000.
Ethereum bulls aiming for all-time highs at $4,868
Ethereum price rallied and broke above $4,000 on Saturday and continued its surge, closing above the December 9, 2021, high of $4,488 on Tuesday. At the time of writing on Wednesday, it continues its upward trend, trading above $4,640.
If ETH bulls continue upward momentum, it could extend the rally to retest its all-time high of $4,868 set on November 10, 2021.
The RSI on the daily chart reads 78 above its overbought territory and points upward, indicating strong bullish momentum. The MACD showed a bullish crossover on Saturday, and with rising green histogram bars, further supports the bullish thesis.
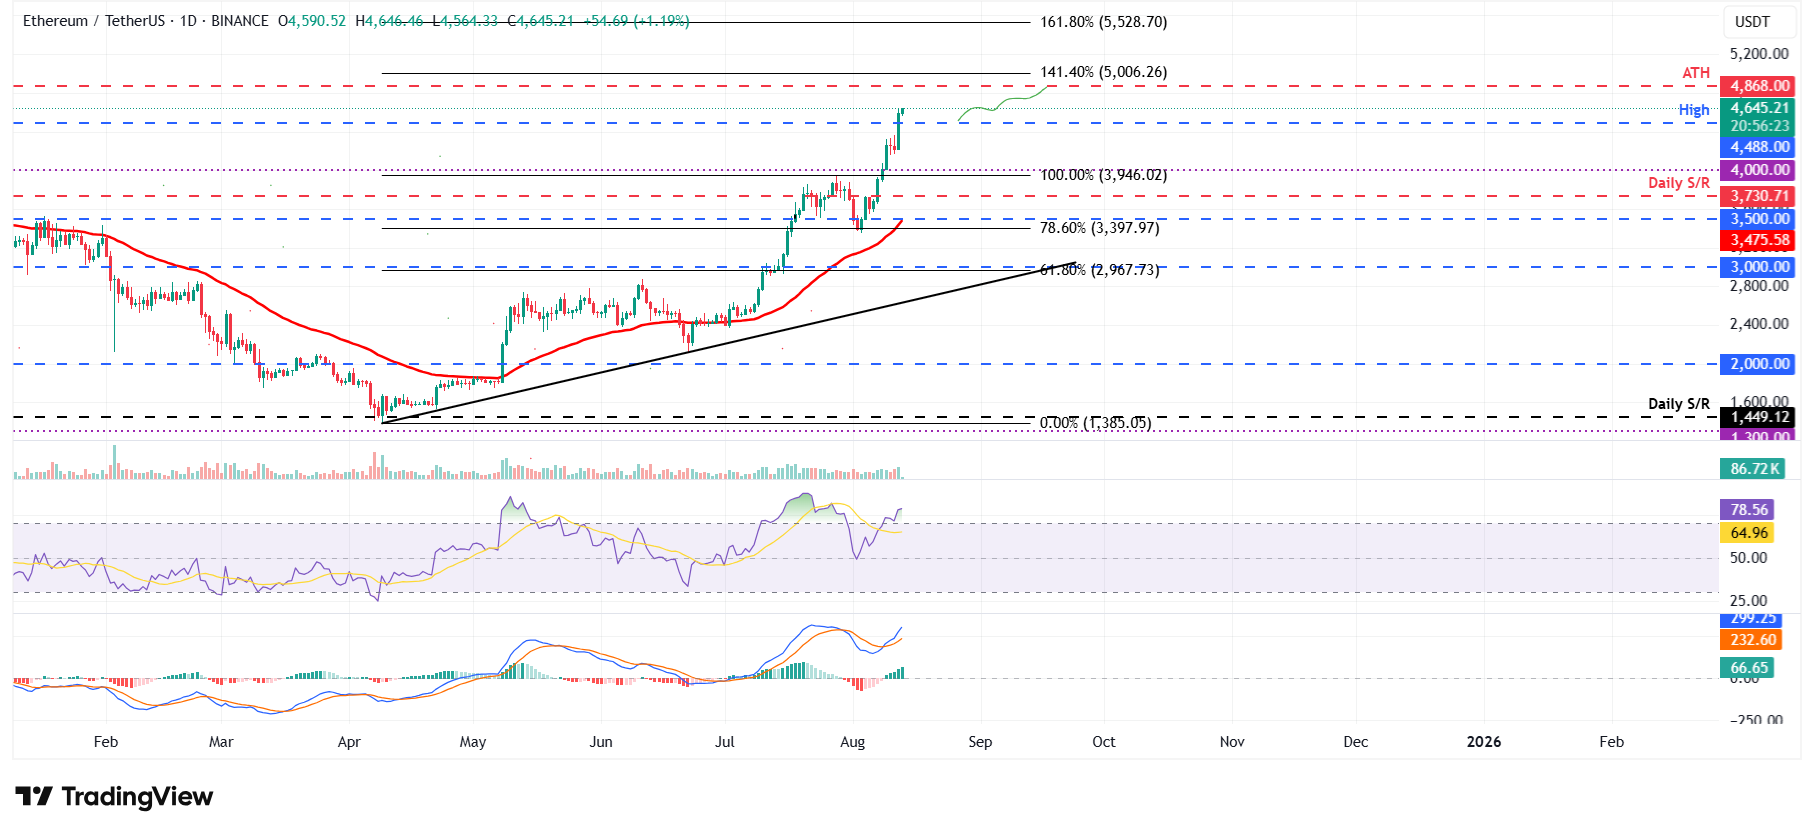
ETH/USDT daily chart
On the other hand, if ETH faces a correction, it could extend the decline to find support around $4,488.
XRP could hit a record high if it closes above $3.40 resistance zone
XRP price faced rejection from its daily level at $3.40 on Friday and declined 5% in the next 5 days. However, on Tuesday, it recovered 4.41% and closed at $3.26. At the time of writing on Wednesday, it hovers at around $3.22.
If XRP closes above the $3.40 daily resistance, it could fuel the rally toward record highs at $3.66.
The RSI on the daily chart reads 56, above its neutral level of 50, indicating bullish momentum is gaining traction. On the daily chart, the MACD indicator lines converge, suggesting indecisiveness among traders. For the bullish momentum to be sustained, the MACD lines must flip to a bullish crossover, like ETH and BTC.
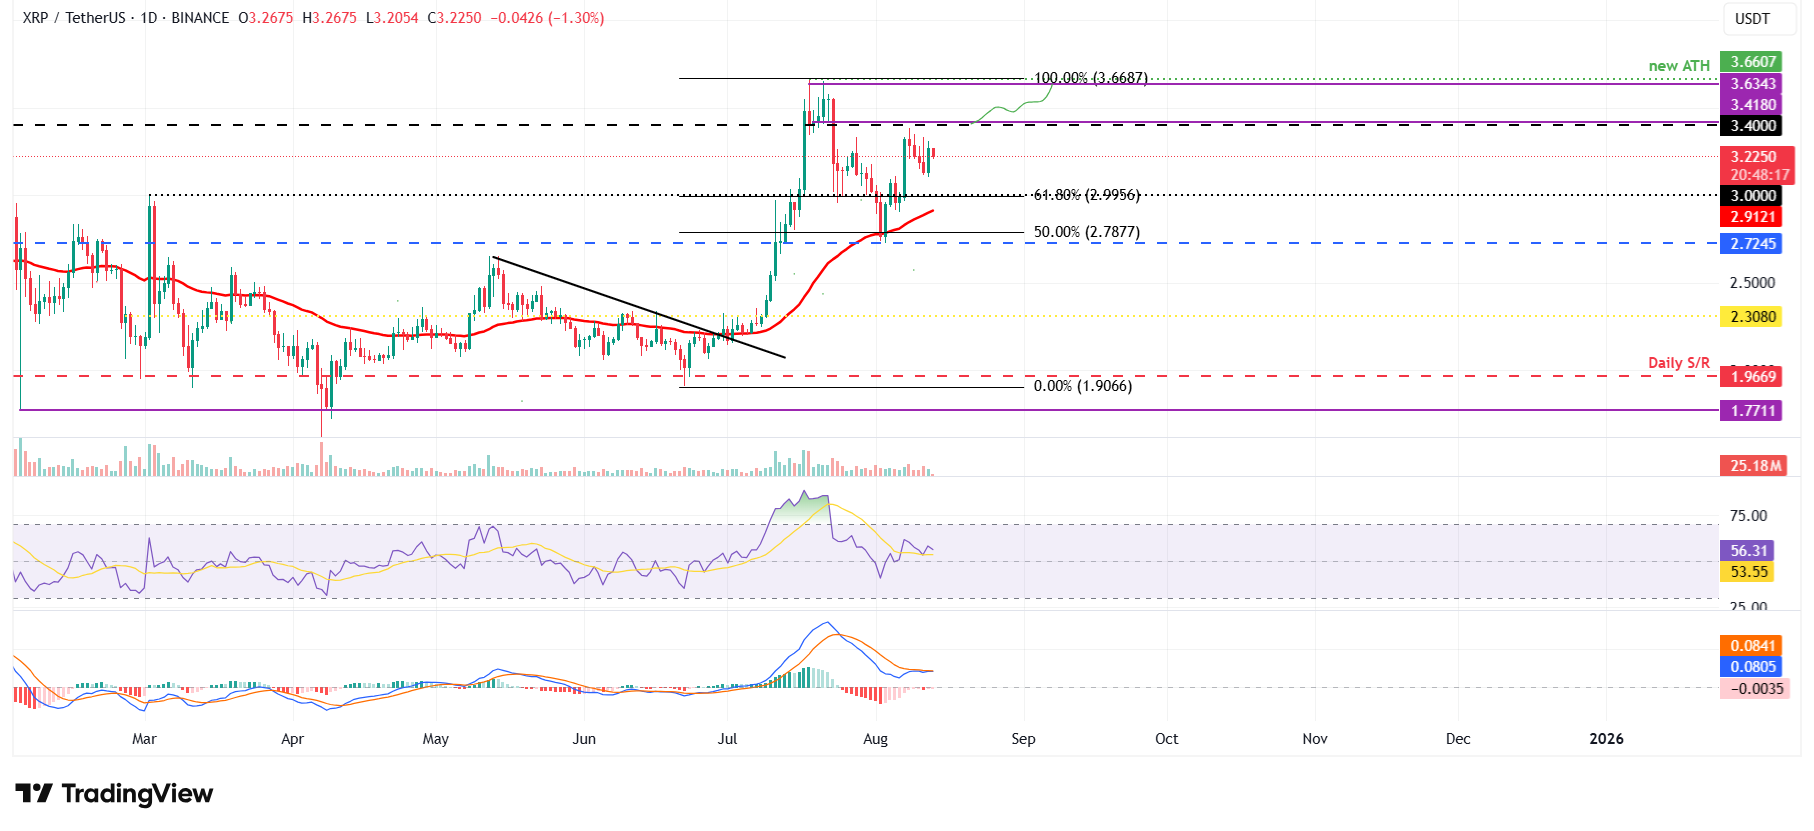
XRP/USDT daily chart
However, if XRP fails to close above the $3.40 resistance and faces a correction, it could extend the pullback toward its 61.80% Fibonacci retracement level at $2.99.
Cryptocurrency metrics FAQs
The developer or creator of each cryptocurrency decides on the total number of tokens that can be minted or issued. Only a certain number of these assets can be minted by mining, staking or other mechanisms. This is defined by the algorithm of the underlying blockchain technology. On the other hand, circulating supply can also be decreased via actions such as burning tokens, or mistakenly sending assets to addresses of other incompatible blockchains.
Market capitalization is the result of multiplying the circulating supply of a certain asset by the asset’s current market value.
Trading volume refers to the total number of tokens for a specific asset that has been transacted or exchanged between buyers and sellers within set trading hours, for example, 24 hours. It is used to gauge market sentiment, this metric combines all volumes on centralized exchanges and decentralized exchanges. Increasing trading volume often denotes the demand for a certain asset as more people are buying and selling the cryptocurrency.
Funding rates are a concept designed to encourage traders to take positions and ensure perpetual contract prices match spot markets. It defines a mechanism by exchanges to ensure that future prices and index prices periodic payments regularly converge. When the funding rate is positive, the price of the perpetual contract is higher than the mark price. This means traders who are bullish and have opened long positions pay traders who are in short positions. On the other hand, a negative funding rate means perpetual prices are below the mark price, and hence traders with short positions pay traders who have opened long positions.
Author

Manish Chhetri
FXStreet
Manish Chhetri is a crypto specialist with over four years of experience in the cryptocurrency industry.