Top 3 Price Prediction Bitcoin, Ethereum, Ripple: Bitcoin shows signs of weakness
- Bitcoin hovers around the $62,000 support level; a firm close below would suggest a decline ahead.
- Ethereum faces rejection from its daily resistance level of $2,461, indicating a bearish momentum.
- Ripple price is nearing its crucial resistance barrier at $0.554; rejection from this level suggests a decline ahead.

Bitcoin (BTC) is hovering at a critical support level, and a drop below it could signal a downturn, while Ethereum (ETH) and Ripple (XRP) are approaching important resistance levels, where a rejection might indicate a shift towards bearish momentum.
Bitcoin price set for a downtrend if it breaks below $62,000
Bitcoin price found support at the 200-day Exponential Moving Average (EMA), around $60,000, on October 2. It rose 3.5% in the following four days and broke above the $62,125 resistance level. As of Wednesday, BTC trades just above $62,000.
If BTC breaks and closes below the $62,125 level, it could extend the decline to retest its 200-day Exponential Moving Average at $60,030.
The Relative Strength Index (RSI) is hovering around its neutral level of 50, indicating a lack of momentum and indecisiveness among traders. If the RSI fails below the neutral level, it will suggest weak momentum, leading to a fall in Bitcoin’s price.
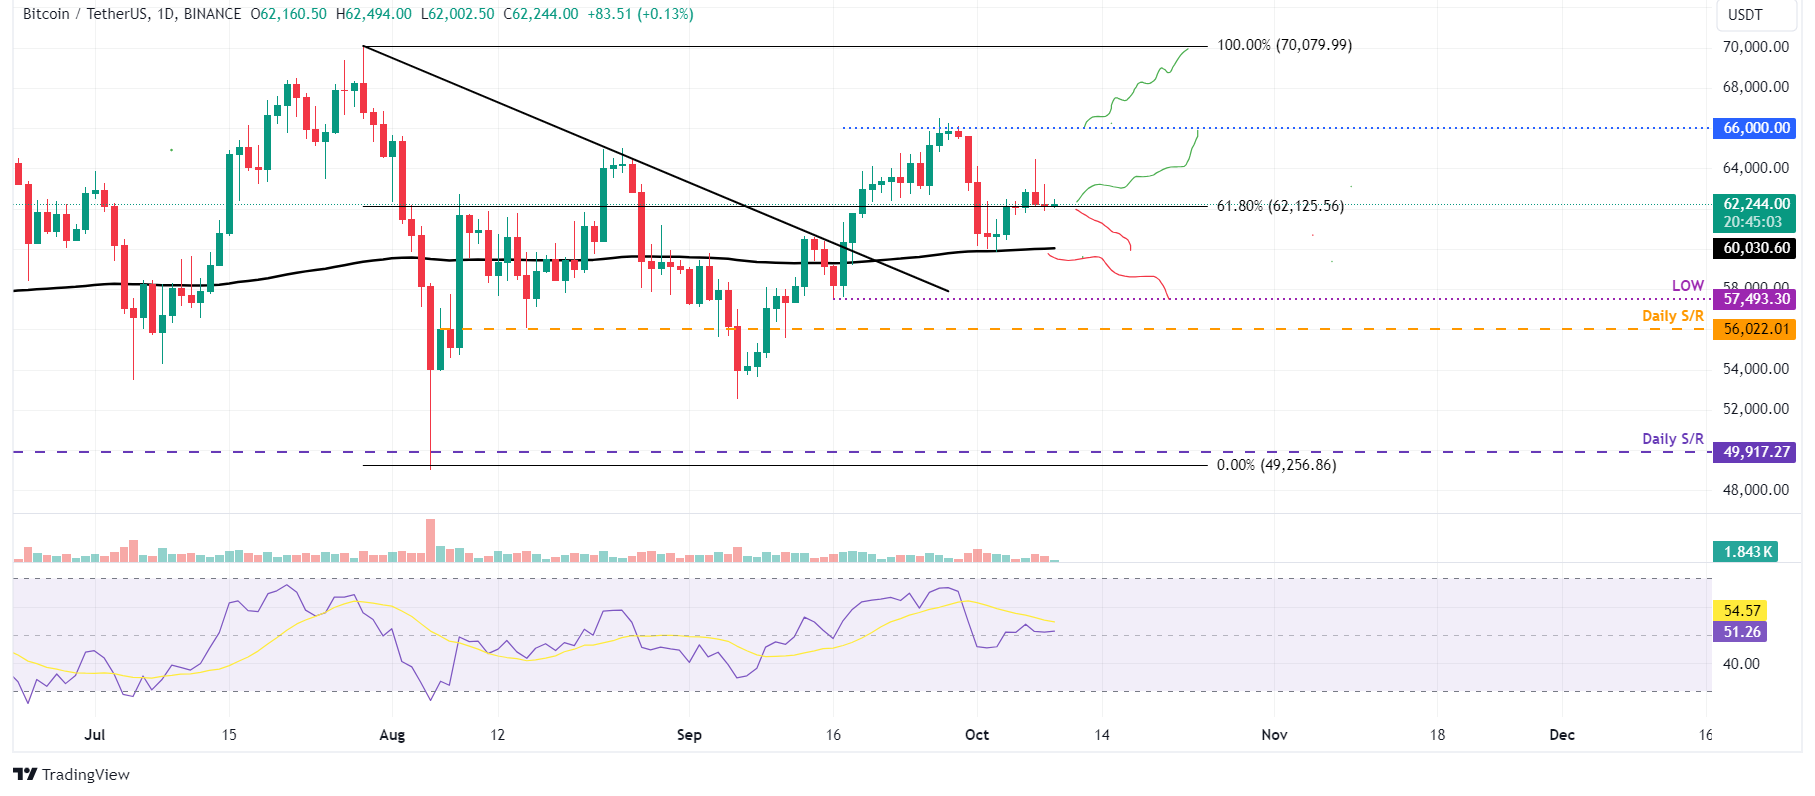
BTC/USDT daily chart
However, if the $62,125 holds, BTC could rise to retest its psychological level of $66,000.
Ethereum shows signs of weakness
Ethereum price was rejected by the daily resistance level at $2,461 on Monday. The daily level roughly coincides with the 50% price retracement level at $2,487 and the 50-day EMA around $2,546, making it a key resistance zone. It trades slightly above $2,400 as of Wednesday, nearing its daily resistance.
If the daily resistance level at $2,461 continues to hold as resistance, ETH could decline 12% from its current trading level to retest its September 6 low of $2,155.
The RSI on the daily chart trades at 46 below its neutral level, indicating weakness and continuing a downward trend.
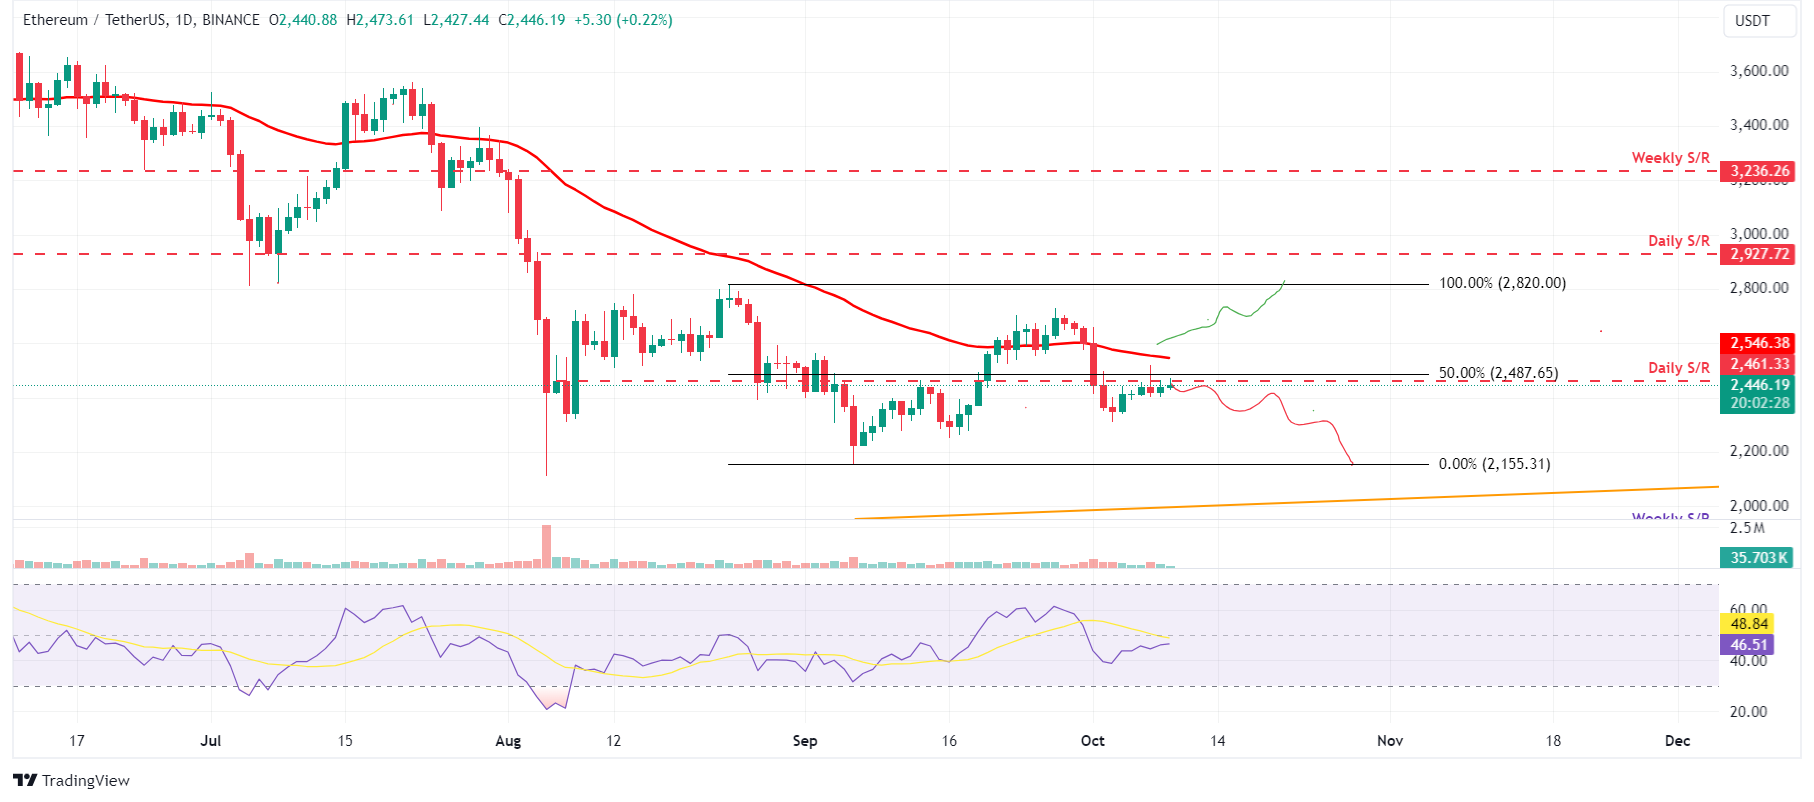
ETH/USDT daily chart
However, If ETH breaks the $2,461 resistance level and closes above the 50-day EMA at $2,546, it could extend the rise to retest its August 25 high of $2,820.
Ripple price set for a downward trend
Ripple price is approaching its previously broken ascending trendline (drawn by connecting multiple lows since early July) on Wednesday. This trendline roughly coincides with the two crucial resistance levels: the 200-day EMA at $0.554 and the daily level at $0.544. It is currently trading below it at around $0.532.
If the 200-day EMA at $0.554 acts as resistance, XRP could decline 19% from its current trading level to retest the August 5 low of $0.431.
The RSI indicator on the daily chart also trades below its neutral level of 50, indicating bearish momentum and a continuation of the downward trend.
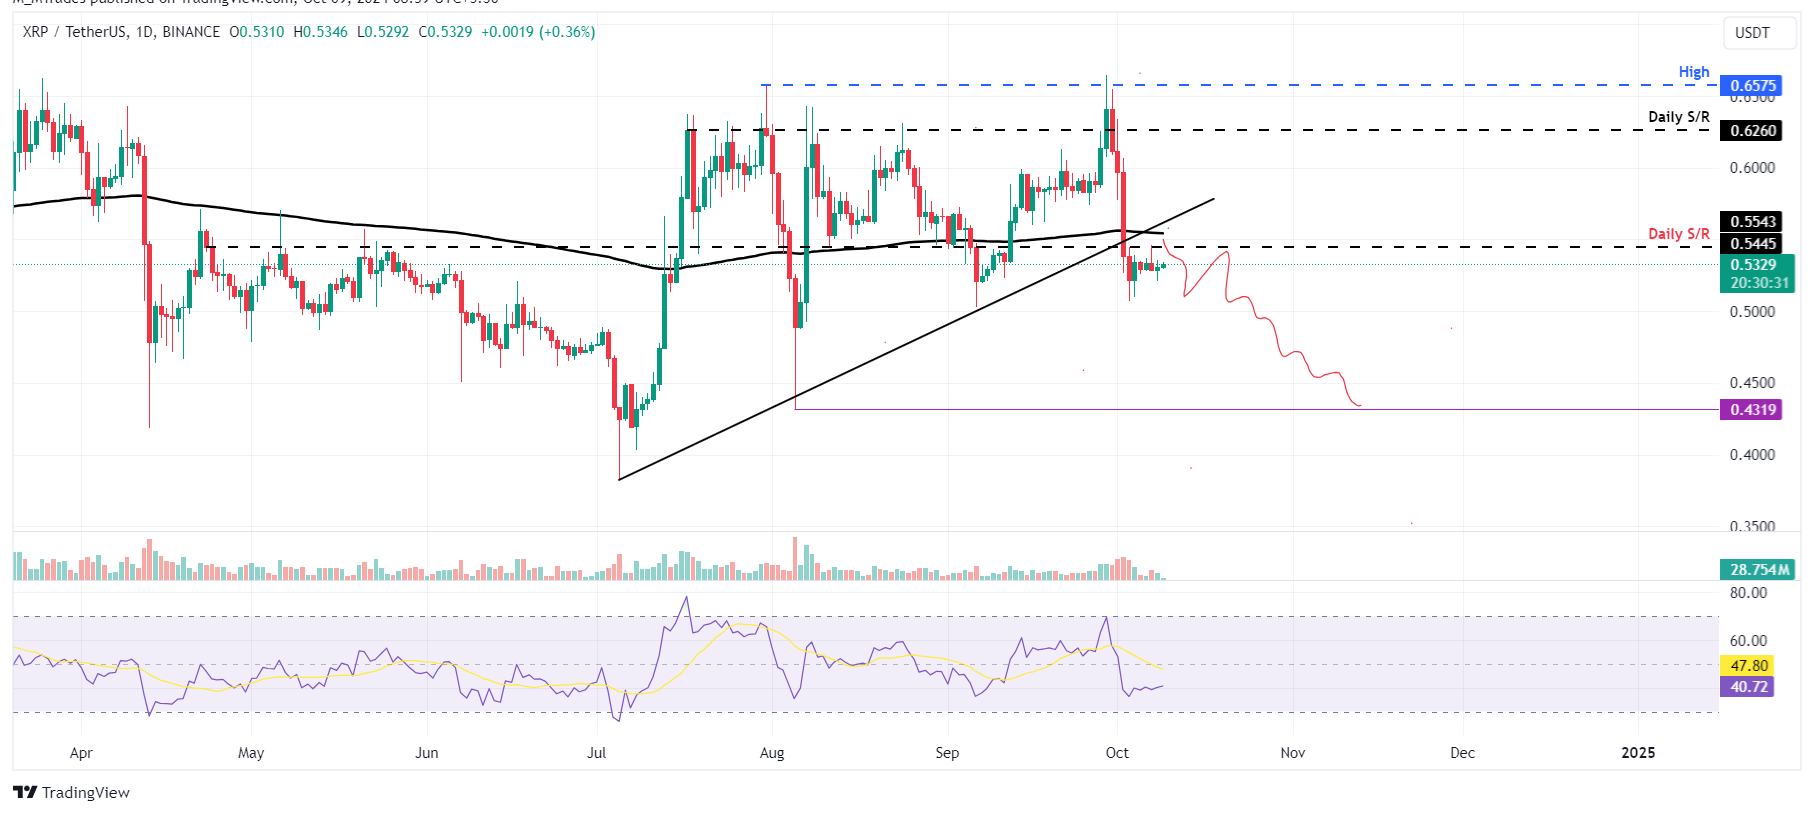
XRP/USDT daily chart
However, if XRP breaks and closes above the 200-day EMA at $0.554, it could extend the rise by 13% to retest its next daily resistance at $0.626.
Cryptocurrency prices FAQs
Token launches influence demand and adoption among market participants. Listings on crypto exchanges deepen the liquidity for an asset and add new participants to an asset’s network. This is typically bullish for a digital asset.
A hack is an event in which an attacker captures a large volume of the asset from a DeFi bridge or hot wallet of an exchange or any other crypto platform via exploits, bugs or other methods. The exploiter then transfers these tokens out of the exchange platforms to ultimately sell or swap the assets for other cryptocurrencies or stablecoins. Such events often involve an en masse panic triggering a sell-off in the affected assets.
Macroeconomic events like the US Federal Reserve’s decision on interest rates influence crypto assets mainly through the direct impact they have on the US Dollar. An increase in interest rate typically negatively influences Bitcoin and altcoin prices, and vice versa. If the US Dollar index declines, risk assets and associated leverage for trading gets cheaper, in turn driving crypto prices higher.
Halvings are typically considered bullish events as they slash the block reward in half for miners, constricting the supply of the asset. At consistent demand if the supply reduces, the asset’s price climbs.
Author

Manish Chhetri
FXStreet
Manish Chhetri is a crypto specialist with over four years of experience in the cryptocurrency industry.


