Top 3 Price Prediction Bitcoin, Ethereum, Ripple: Bitcoin dithering at heaven's door
- Bitcoin as a target for money facing a new equity sell-off.
- The second failed attempt at $10000 boosts the relevance of the level and sets it up as the level to beat.
- Sentiment improves by 10% but is one step behind a volatile market

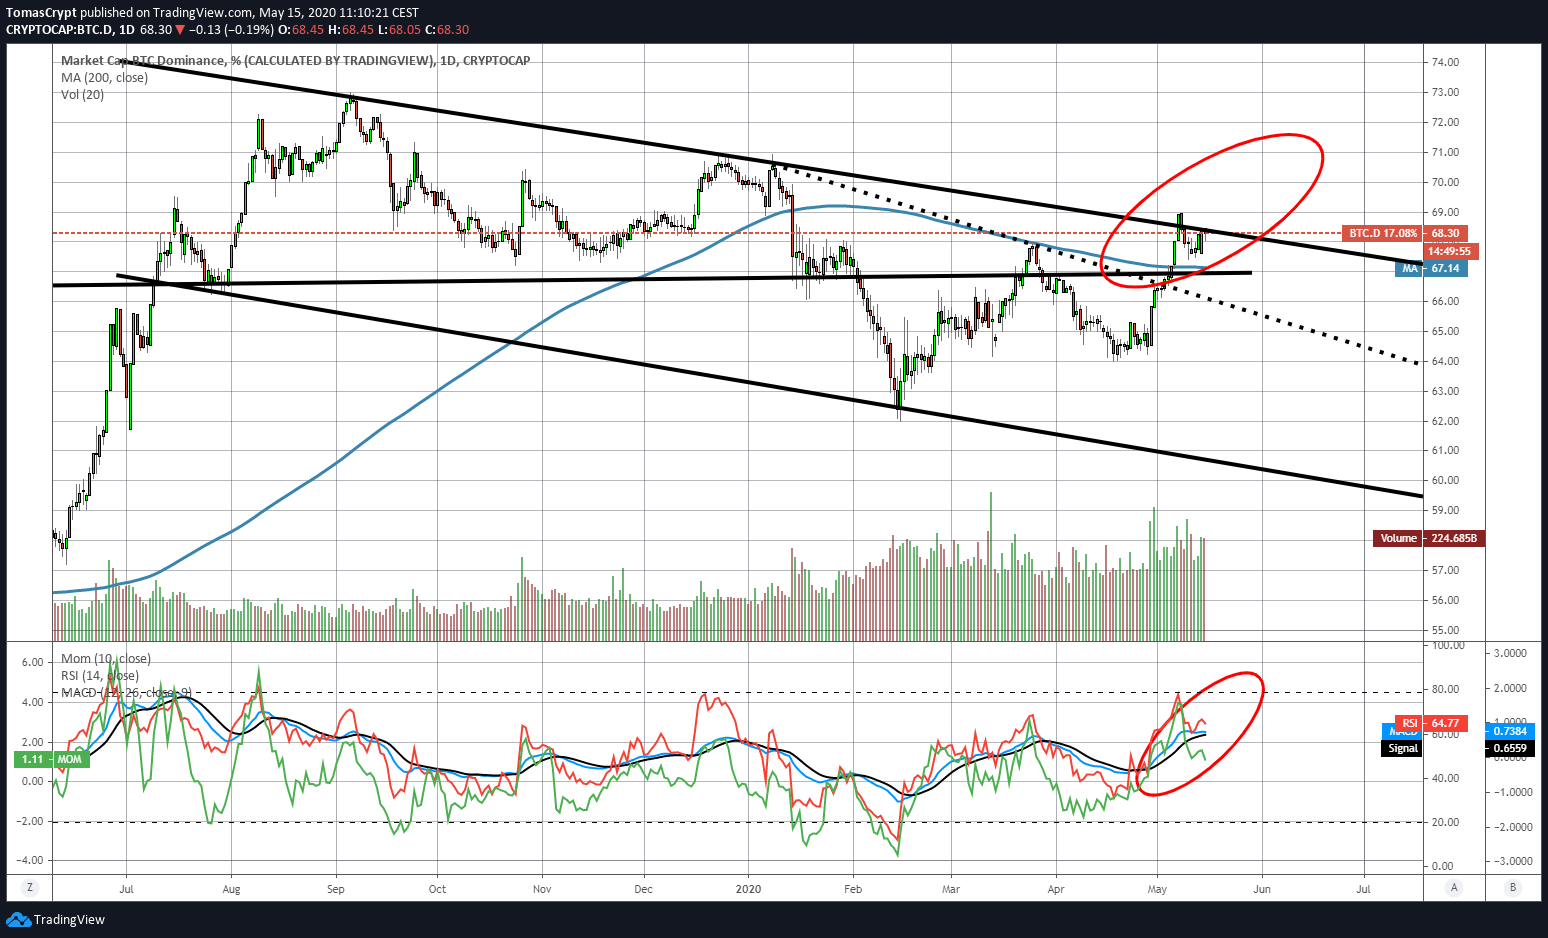
Yesterday, the Bitcoin attempted again to overcome the resistance in its market dominance chart and fails. Yesterday's technical indicators point out that the bullish move has run out of steam.
Today, those same indicators are moving close to completing a bearish pattern that would carry Bitcoin's dominance level. But the technical pattern is not yet complete, so there is still a chance for a triumphant end to the Bitcoin, with Ethereum's permission.
The Ethereum network now has a chance to make up lost ground and gain momentum ahead of the release of the 2.0 version of the network engineered by Vitalyk Buterin.
But the threat of another delay in the delivery of the new version is already on the table.
Mr Buterin – a Canadian citizen but born in Russia in 1995 – stated in a recent interview that the date for the launch of the new version was set for July, and was immediately replied by the tesnet coordinator for ETH 2.0, Afri Schoedon, questioning this date.
As it could not be otherwise in an open ecosystem and decentralized collaboration, other project collaborators have also appeared who maintain that the delivery date is feasible.
The Ethreum's dominance chart shows a fragile structure with few nearby supports. On the resistance side, the situation changes a lot, and the simple moving average of 200 days limits any upward movement.
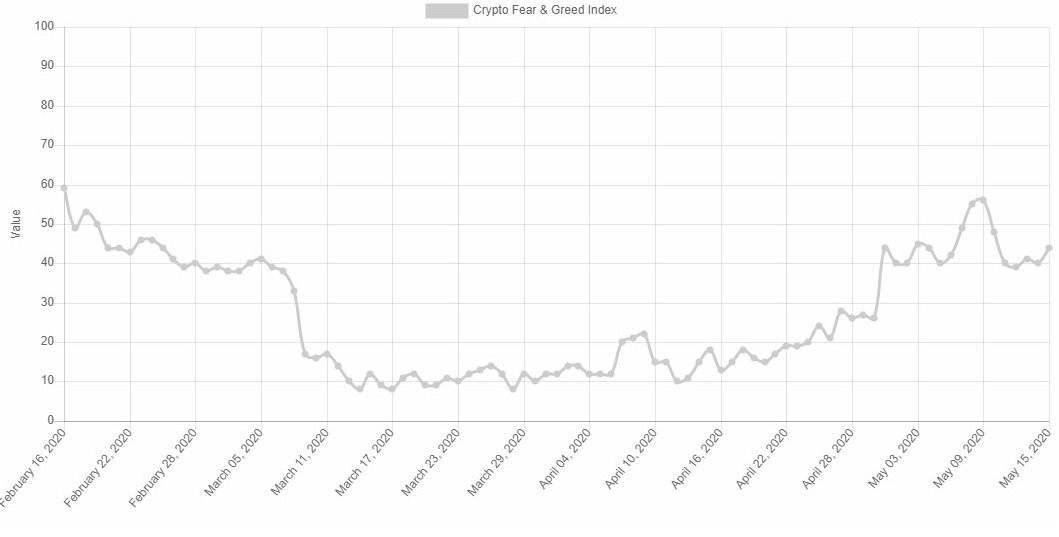
Source: alternative.me
The sentiment indicator of the crypto ecosystem continues to wobble, and today is up 10% to level 44. The market mood is very volatile, a clear message of nervousness among all participants.
ETH/BTC Daily Chart
The ETH/BTC pair is currently trading at the price level of 0.0207.
During the Asian session, the price has risen sharply. At the opening of the European session, Ether is losing all gains, and now the dispute is over, back the opening level.
Above the current price, the first resistance level is at 0.0216, then the second at 0.022 and the third one at 0.0228.
Below the current price, the first support level is at 0.020, then the second at 0.0197 and the third one at 0.0188.

The MACD on the daily chart is losing steam but not enough to change the current downward trend.
The DMI on the daily chart shows that the bears have no strength to move away from the ADX line, while the bulls still show no interest in disputing the leadership of the ETH/BTC pair.
BTC/USD Daily Chart
The BTC/USD pair is currently trading at the price level of $9610. During the Asian session, the chart draws a bearish candlestick, but now in European time, the price is recovering and avoiding the bearish pattern for the time being.
The $10000 level resisted for the second time in a few days and is now at the resistance level critical to the development of the current uptrend.
Above the current price, the first resistance level is at $10000, then the second at $10650 and the third one at $11250.
Below the current price, the first support level is at $9600 then the second at $9150 and the third one at $8800.

The MACD on the daily chart could try today to undo the bearish cross or to move down again as it did last week. The indicator shows an ambiguous structure, and there is no visibility in the short term.
The DMI on the daily chart shows the bulls not having the strength to break the ADX line. Now they are moving down and confirm the bearish pattern that was triggered last week.
ETH/USD Daily Chart
The ETH/USD pair is currently trading at the $199.7 price level, an essential price level for the Ether.
Above the current price, the first resistance level is at $200, then the second at $208 and the third one at $215.
Below the current price, the first support level is at $195 then the second at $190 and the third one at $185.

The MACD on the daily chart failed to attempt a new bullish cross, a weakness that can turn into a strength by avoiding a bearish rebound.
The DMI on the daily chart shows the bulls-side leading this asset, but close to the sell-side levels. The two sides of the market and the ADX line moves in a tiny space, which could lead to increased volatility.
XRP/USD Daily Chart
The XRP/USD pair is currently trading at the price level of $0.201 and is giving good news as it is trading above the 50-day exponential moving line.
Above the current price, the first resistance level is at $0.213, then the second at $0.22 and the third one at $0.24.
Below the current price, the first support level is at $0.20 then the second at $0.19 and the third one at $0.18.

The MACD on the daily chart shows a very flat profile that rests on the neutral level of the indicator. From this point onwards it could bounce back upwards with a solid base.
The DMI on the daily chart shows bears controlling the XRP/USD pair, but not being able to break the ADX line and trigger a consistent bearish pattern. The bulls are gaining strength although they are still far from being able to contest the control of the pair on the sell-side.
Author

Tomas Salles
FXStreet
Tomàs Sallés was born in Barcelona in 1972, he is a certified technical analyst after having completing specialized courses in Spain and Switzerland.


