Top 3 Price Prediction Bitcoin, Ethereum, Ripple: Bitcoin claims its safe-haven status
- Market decline leads Bitcoin to regain market share on account of the Altcoin segment.
- Market consolidation that just started could extend over several days, even weeks.
- Sentiment levels continued to be extremely positive and power down further in the short term.

The crypto market had been at extremely high levels of positive sentiment for too many days and has ended up paying for it.
The euphoria, like other gut feelings, needs to be fueled continuously, and the $12000 resistance level in the BTC/USD pair has triggered some doubts.
The bull market in the crypto market is far from over, but it has made significant gains that require consolidation.
Paradoxically, the big beneficiary of the change in market direction is Bitcoin, just the asset that has triggered the bearish moment with its bullish breakout failure.
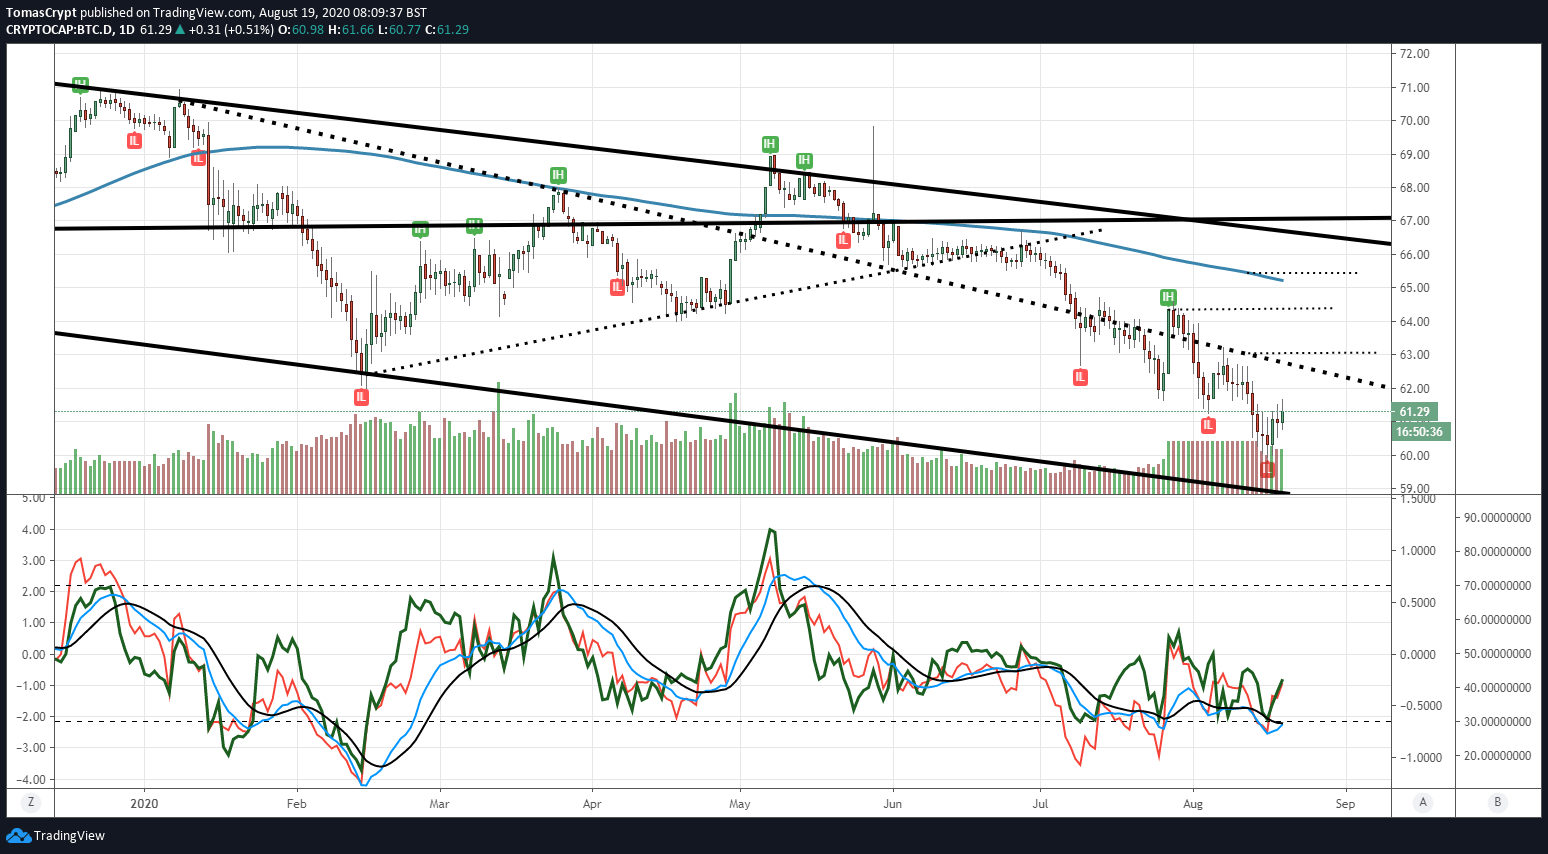
The Bitcoin's dominance chart is up 0.7% on the day and heading towards the first resistance level at the 62.5% dominance level. The upward movement of the chart is in its early stages and has room to run, so we can expect the market's consolidation movement to extend for a few days or weeks.
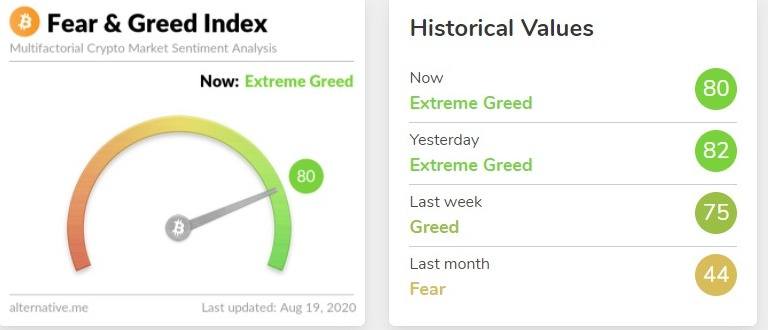
Market sentiment is down two points to the 80 levels, still at extreme positive levels. After the long winter crypto, expectations were, and are, very high, and sentiment levels will likely resist falling.
ETH/BTC Daily Chart
The ETH/BTC pair is currently trading at the price level of 0.0347 and pierces the price congestion support level at 0.035. The main bullish trend line is moving at 0.029, marking the limit of the consolidation movement.
Above the current price, the first resistance level is at 0.035, then the second at 0.0368 and the third one at 0.0372.
Below the current price, the first support level is at 0.0332, then the second at 0.0316 and the third one at 0.0309.
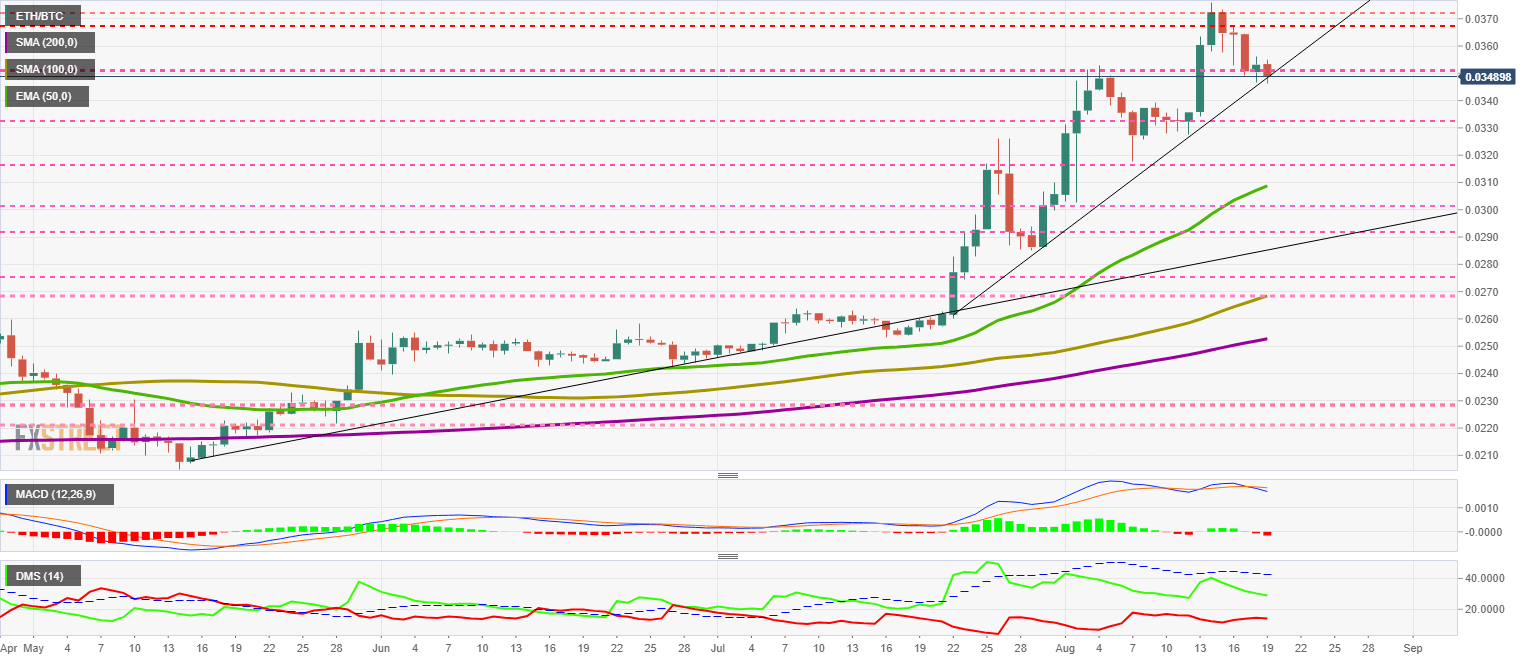
The MACD on the daily chart increases the bearish trend line, increasing the slope and the opening between the lines.
The DMI on the daily chart shows bulls in apparent decline, while bears are slightly up and don't seem convinced that their time has come.
BTC/USD Daily Chart
The BTC/USD pair is currently trading at the price level of $11793 and confirms the failure to overcome and consolidate the price congestion resistance level at $12350.
Above the current price, the first resistance level is at $12350, then the second at $14000 and the third one at $17200.
Below the current price, the first support level is at $11275, then the second at $10700 and the third one at $9875.
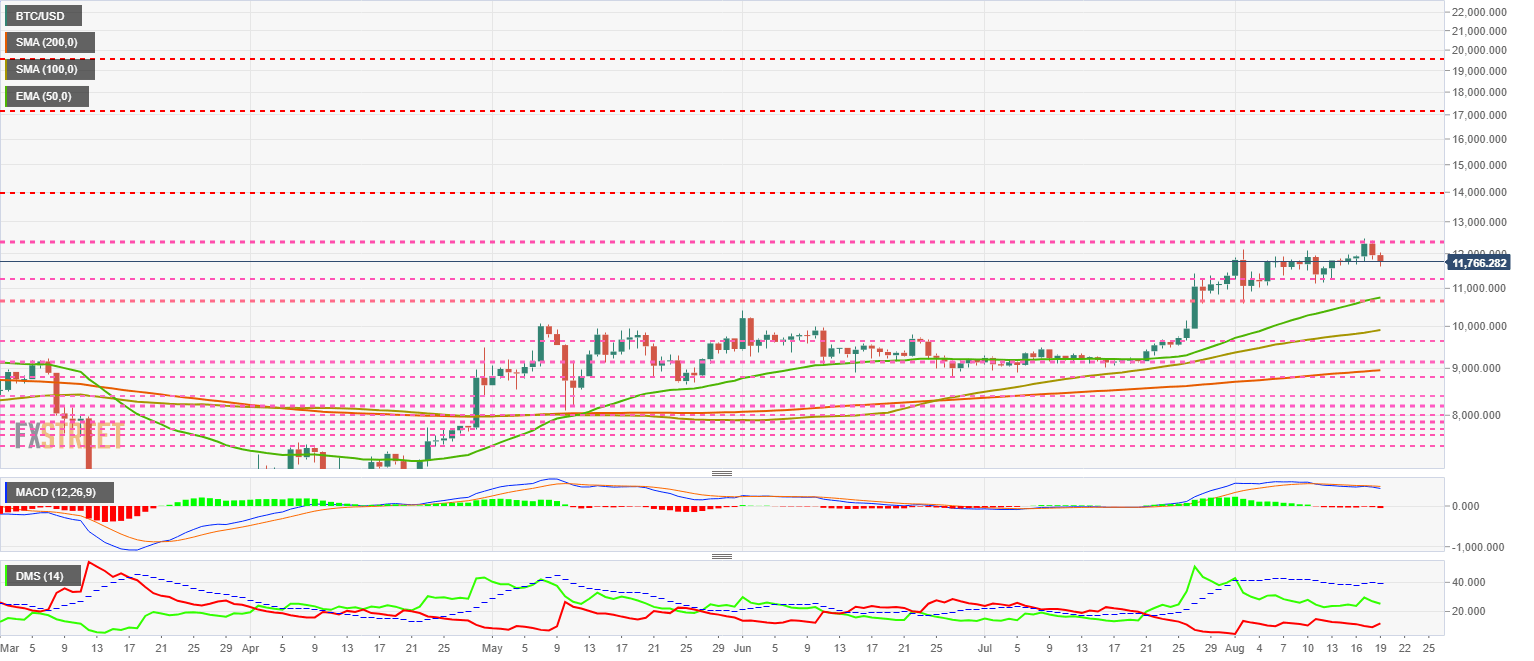
The MACD on the daily chart slightly increases the bearish profile. A bullish rebound in the short term and a further move lower.
The DMI on the daily chart shows bulls losing strength as bears increase their power. Both sides of the market are moving pin proximity and could face each other over the next few days.
ETH/USD Daily Chart
The ETH/USD pair is currently trading at $410.17 and is giving way to resistance due to price congestion at $440.
Above the current price, the first resistance level is at $440, then the second at $460 and the third one at $485.
Below the current price, the first support level is at $385, then the second at $355 and the third one at $335.
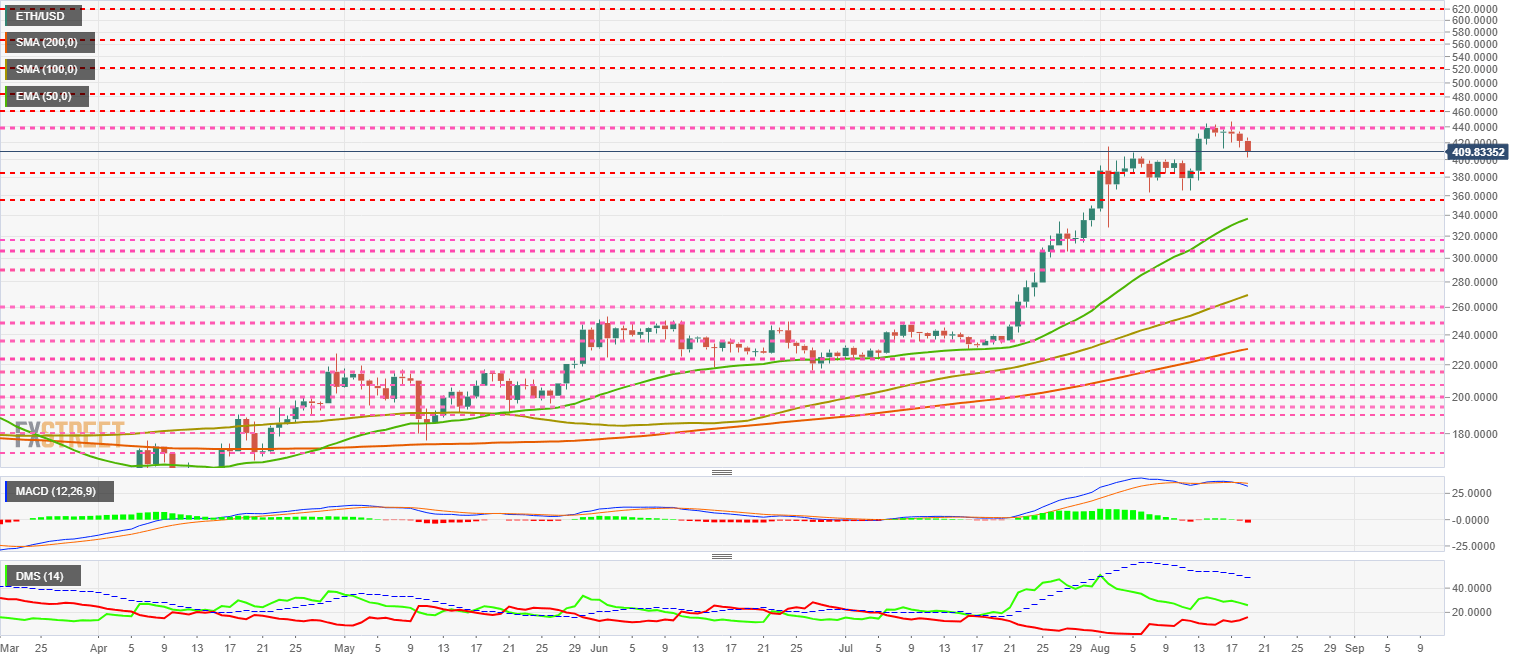
The MACD on the daily chart is increasing the downward slope and the gap between the lines, although it is not too bearish at the moment.
The DMI on the daily chart shows the bulls falling while the bears are rising quite sharply. A clash between the two sides of the market may occur in the coming days.
XRP/USD Daily Chart
The XRP/USD pair is currently trading at the price level of $0.2925 after twice failing to break the price congestion resistance level at $0.32.
Above the current price, the first resistance level is at $0.30, then the second at $0.32 and the third one at $0.33.
Below the current price, the first support level is at $0.29, then the second at $0.283 and the third one at $0.268.

The MACD on the daily chart is bouncing downward after the upward cross attempt. The moving averages are tilting downward and increasing the line spacing, an indicator that the downward movement is accelerating.
The DMI on the daily chart shows bulls and bears on an imminent collision course, which could increase the price volatility of XRP/USD.
Author

Tomas Salles
FXStreet
Tomàs Sallés was born in Barcelona in 1972, he is a certified technical analyst after having completing specialized courses in Spain and Switzerland. He expanded his technical training following the guidance of great experts on the financial markets.


