Top 3 Price Prediction Bitcoin, Ether, Ripple: A seldom sunshine does not enlighten the Moon
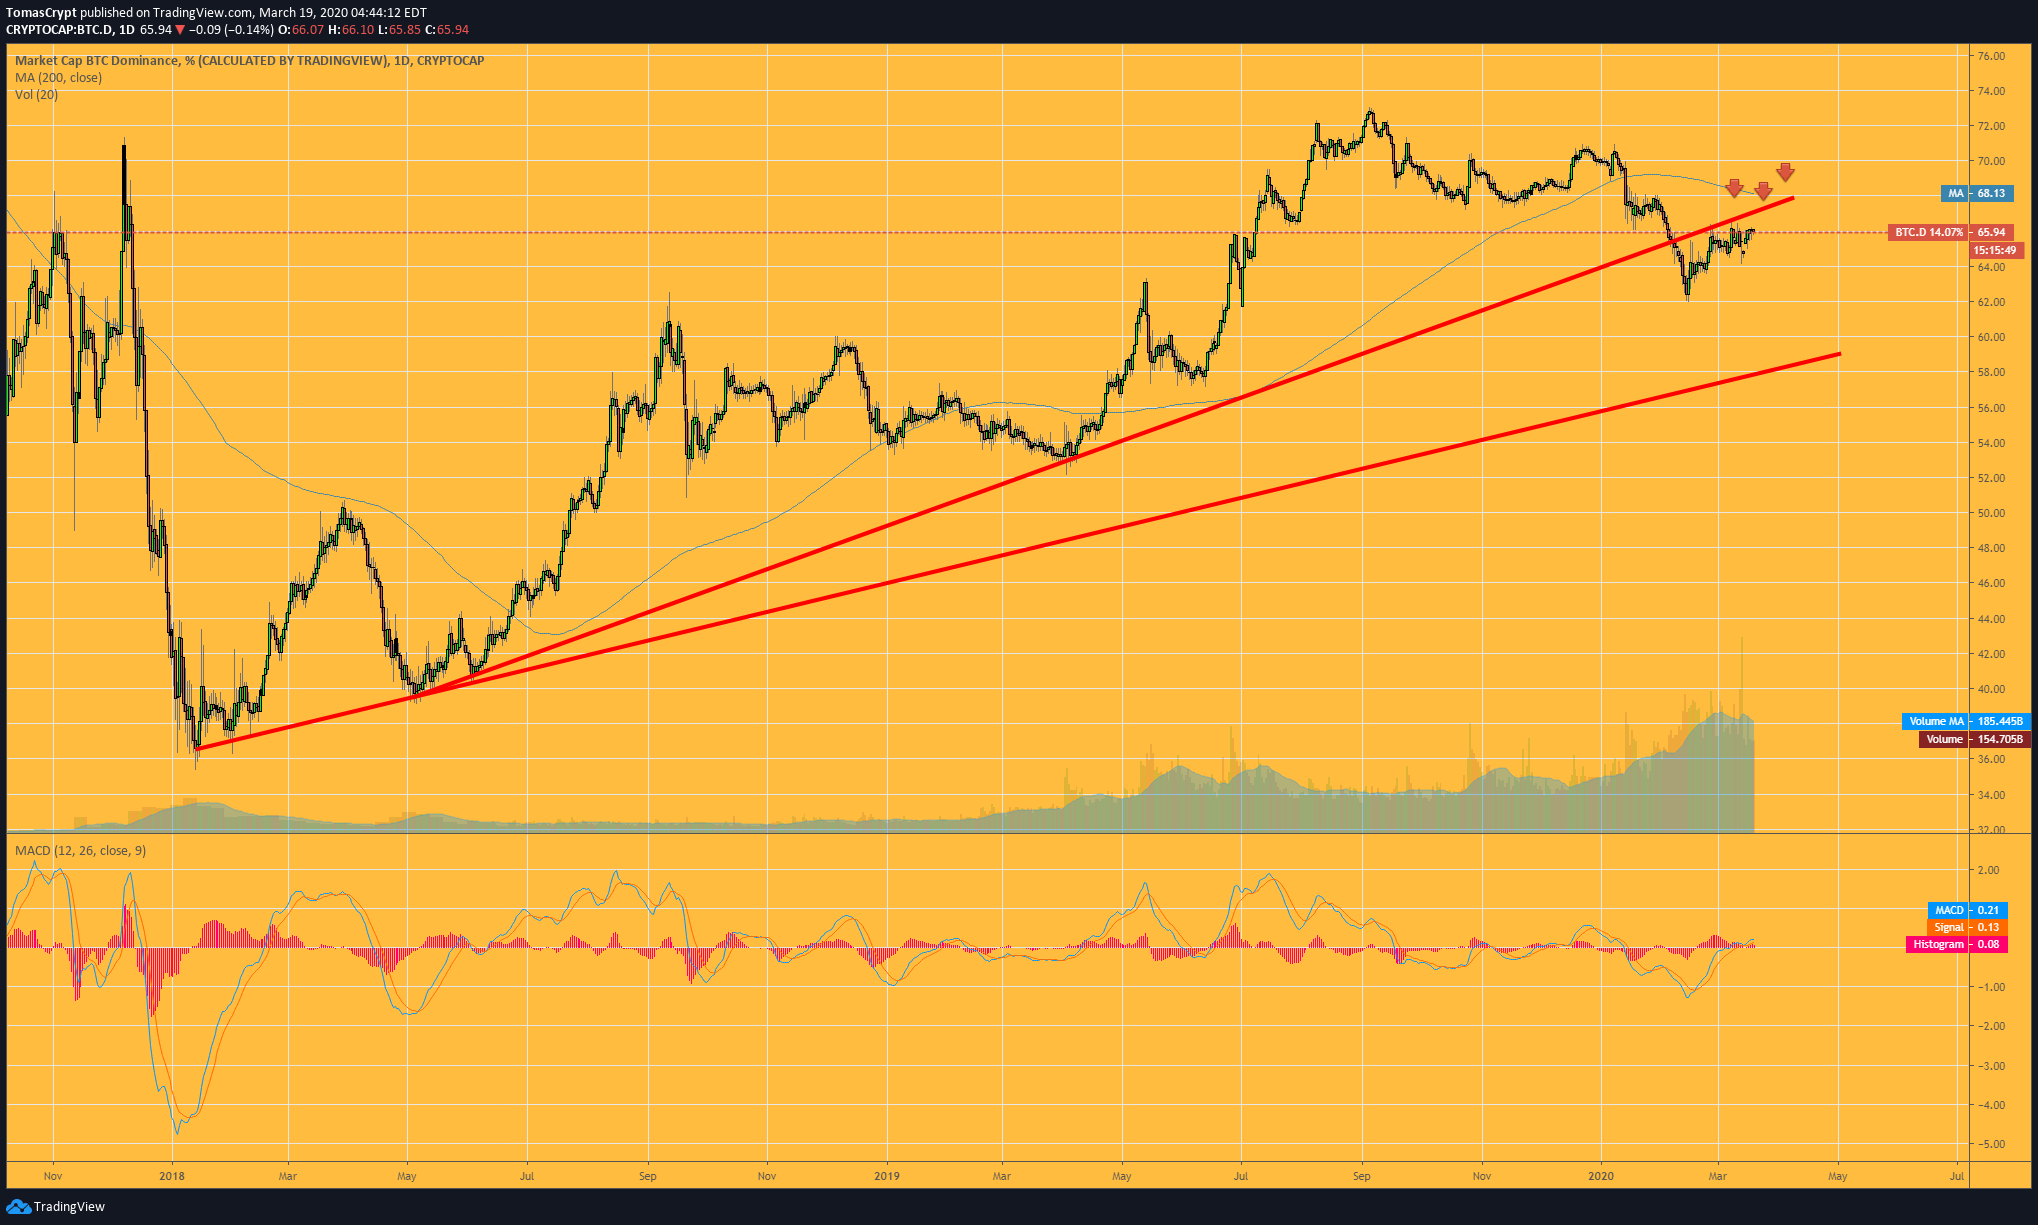
- Bitcoin is not able to recover previous dominance levels.
- The indicators show an improvement in the structure of the Top 3 cryptocurrencies, but far from being able to validate a change in trend.
- XRP shows the best setup for a hypothetical change of direction in the market.

The cryptocurrencies that hold the podium by capitalization in the crypto universe are at the beginning of the last phase of consolidation.
The technical setup is improving and is starting to show details that point to an upcoming recovery in prices in the short term.
Bitcoin has spent the last few weeks trying to recover its previous level of dominance over the rest, but it is finding it impossible.
The days are passing, and the forces are running out, and it seems closer and closer to the moment when Bitcoin's dominance will decline again against the Altcoin segment.
My favourite momentum indicator, the ETH/BTC pair, is showing strength and managing to stay above the 0.22 level. Yesterday, it closed the day with gains, and today the European session is also starting in green, a glimmer of hope for a real improvement all over the crypto board.
ETH/BTC Daily Chart
The ETH/BTC pair is currently trading at 0.02203 and is attempting to break through the price congestion resistance at 0.02205 which, by acting as a support level, has managed to halt the decline from relative highs.
Above the current price, the first resistance level is at 0.02205, then the second resistance level is at 0.0228 and the third one at 0.0241.
Below the current price, the first support level is at 0.0214, then the second at 0.0209 and the third one at 0.0201.

The MACD on the daily chart shows a slight improvement in the profile of the moving averages, but not enough to ensure a change in the trend.
The DMI on the daily chart shows that the bears are losing some strength and are approaching the ADX line. The bulls are not at all convinced about the possibilities of a possible change in trend and are waiting at levels that are significantly higher than the current situation.
BTC/USD Daily Chart
The BTC/USD pair is currently trading at the price level of $5623, and it's been three days with price improvements for the king of cryptocurrencies.
Above the current price, the first resistance level is at $5850; then the second is at $6200 and the third one at $6300.
Below the current price, the first support level is at $5100, then the second at $4950 and the third one at $4800.

The MACD on the daily chart shows a full bullish trend profile. The change in direction is so radical so that a first upward cross attempt can fail.
The DMI on the daily chart shows how the sellers lost the support of the ADX line and put an end to the bearish pattern. Bears are buying the idea and improve their activity level.
ETH/USD Daily Chart
The ETH/USD pair is currently trading at the $123.69 price level and follows BTC/USD with its third day of gains.
Above the current price, the first resistance level is at $125, then the second at $130 and the third one at $134.
Below the current price, the first support level is at $115, then the second at $110 and the third one at $105.

The DMI on the daily chart shows how the bears are losing the support of the ADX line and deactivating the bearish pattern. The bulls start to react and change the upward direction.
XRP/USD Daily Chart
The XRP/USD pair is currently trading at a price level of $0.1519 and also has three consecutive days of price increases.
Above the current price, the first resistance level is at $0.16, then the second at $0.17 and the third one at $0.185.
Below the current price, the first support level is at $0.139, then the second at $0.133 and the third one at $0.126

The MACD on the daily chart shows a very distinct bullish cross profile, which is less aggressive than the one seen on the BTC/USD chart. The cross could happen before the end of this week.
The DMI on the daily chart shows bears completely losing support from the ADX line and disabling the previous bearish pattern.
Get 24/7 Crypto updates in our social media channels: Give us a follow at @FXSCrypto and our FXStreet Crypto Trading Telegram channel
Author

Tomas Salles
FXStreet
Tomàs Sallés was born in Barcelona in 1972, he is a certified technical analyst after having completing specialized courses in Spain and Switzerland.


