Top 3 Price Prediction: Bitcoin and Ethereum on a fragile support, Ripple finds traction at $ 0.47 - Confluence Detector
- After two days of sharp price drops, the slight increases have not found solid support.
-
Our "Technical Confluence Indicator" tool indicates less consistent support lines than the challenges that exist in the form of resistance levels.

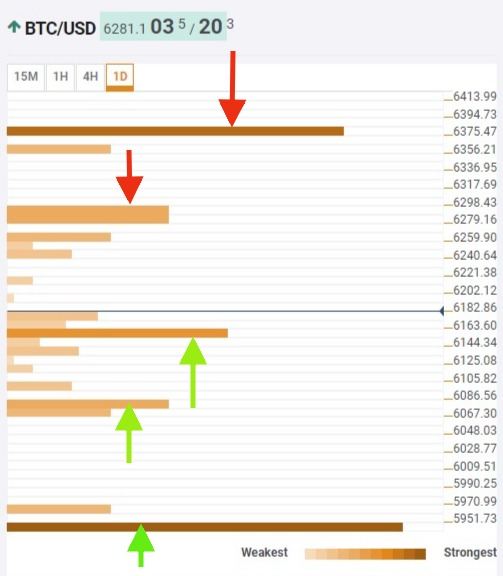
BTC/USD 1D
The Bitcoin trades at $6,287 after climbing about 10% from the weekend lows. The pullback did not manage to conquer a solid support, so the next few hours could be critical.
Below the spot price, the first remarkable support is the 23.6% Fibonacci retracement on a weekly basis at the $6,150 level. It is not up until $100 below that the daily 61.8% Fibonacci retracement is placed, right at $6,050. The most important level to the BTC/USD is located at the $5,950 mark, where the confluence of monthly and weekly lows could provide BTC/USD some reliable support.
Above the current price level, BTC/USD also has a lot of room to move up until finding some resistance at $6,300 level, where the 38.2% Fibonacci retracement on a weekly basis is waiting.
At the Bitcoin bullish end, the daily R1 Pivot Point waits around the $6,350 level and, slightly above, we can find the monthly S1 Pivot Point level.
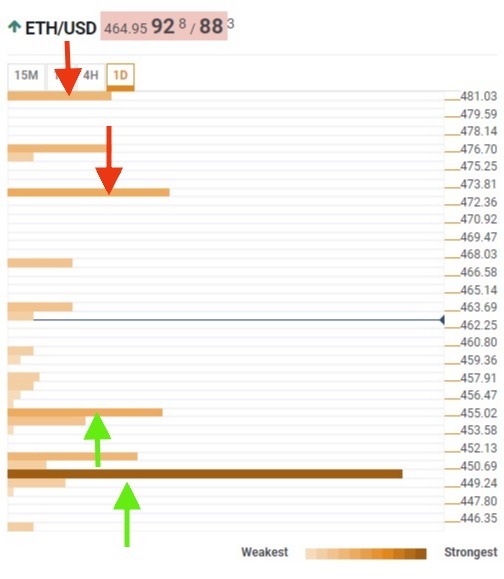
ETH/USD 1D
Ethereum is in a similar situation, far away from any significant support or resistance. ETH/USD trades now at $465, and it's not until the $450 level that the Ethereum should find some meaningful support, in this case, the 61.8% Fibonacci retreat in the daily range. As the ultimate safety net, Ethereum has weekly and monthly lows placed at the $449 level.
If there are not a lot of barriers underneath the current price, there are fewer on the upside. Nothing to consider until ETH/USD reaches the $473 to $476 range, where it would first meet the 23.6% retracement level on the Fibonacci scale and a little higher, the day's highs as a benchmark.
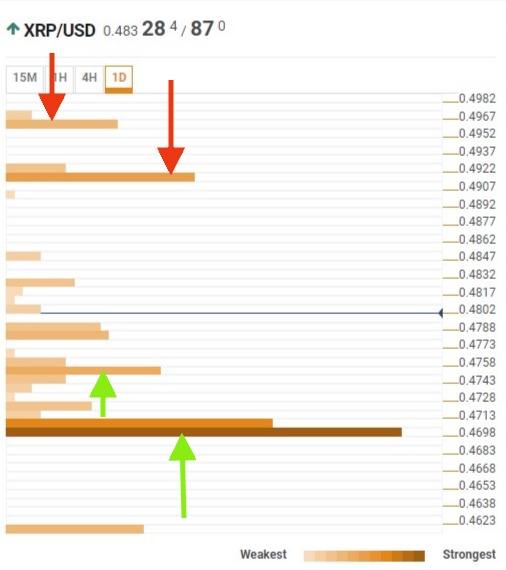
XRP/USD 1D
Of the three assets analyzed with the help of our technical convergence tool, XRP/USD is the one that enjoys the most solid support. Just one cent below the current price, $0.485 is the 61.8% drop in Fibonacci on a daily calculation. But only two cents below, Ripple has two critical supports with monthly and weekly minimums.
On the upside, it is not until the $0.493 level that the XRP/USD can meet some resistance with the 23.6% Fibonacci retracement level in the weekly timeframe. A little higher, at the $0.495 level, we should expect the day's highs as the level to beat.
Author

Tomas Salles
FXStreet
Tomàs Sallés was born in Barcelona in 1972, he is a certified technical analyst after having completing specialized courses in Spain and Switzerland. He expanded his technical training following the guidance of great experts on the financial markets.


