Top 3 buy zones for Bitcoin as buy signal flashes on BTC price chart
- Bitcoin buy signal appears on the daily chart, with key momentum indicators showing BTC is oversold.
- Three key buy zones emerge as Bitcoin traders face mass liquidations after BTC tumbled below $90,000.
- Bitcoin could collect liquidity close to $85,000 as institutional investors pull capital from spot BTC ETFs.

Bitcoin (BTC) hovers around the $87,000 level on Wednesday after traders faced massive liquidations following the largest cryptocurrency’s crash under the $90,000 support level. echnical indicators on the daily price chart generate a buy signal while crypto traders remain fearful, according to the Crypto Fear & Greed Index.
Bitcoin buy zones and BTC price forecast
At the time of writing, Bitcoin hovers close to the $87,000 level on Wednesday. On the BTC/USDT daily price chart, a key momentum indicator, the Relative Strength Index (RSI), generates a buy signal for Bitcoin.
RSI reads 26 and dropped under the 30 level, meaning Bitcoin is oversold on the daily timeframe.
The Moving Average Convergence and Divergence (MACD) indicator flashes red histogram bars under the neutral line, meaning there is an underlying negative momentum in the Bitcoin price trend and the asset could correct further.
Bitcoin’s support at $85,418—Wednesday’s low—, and two fair value gaps: $76,900 to $80,216 and $81,500 to $85,072. These are the key levels to watch for sidelined buyers to accumulate BTC before a potential recovery.
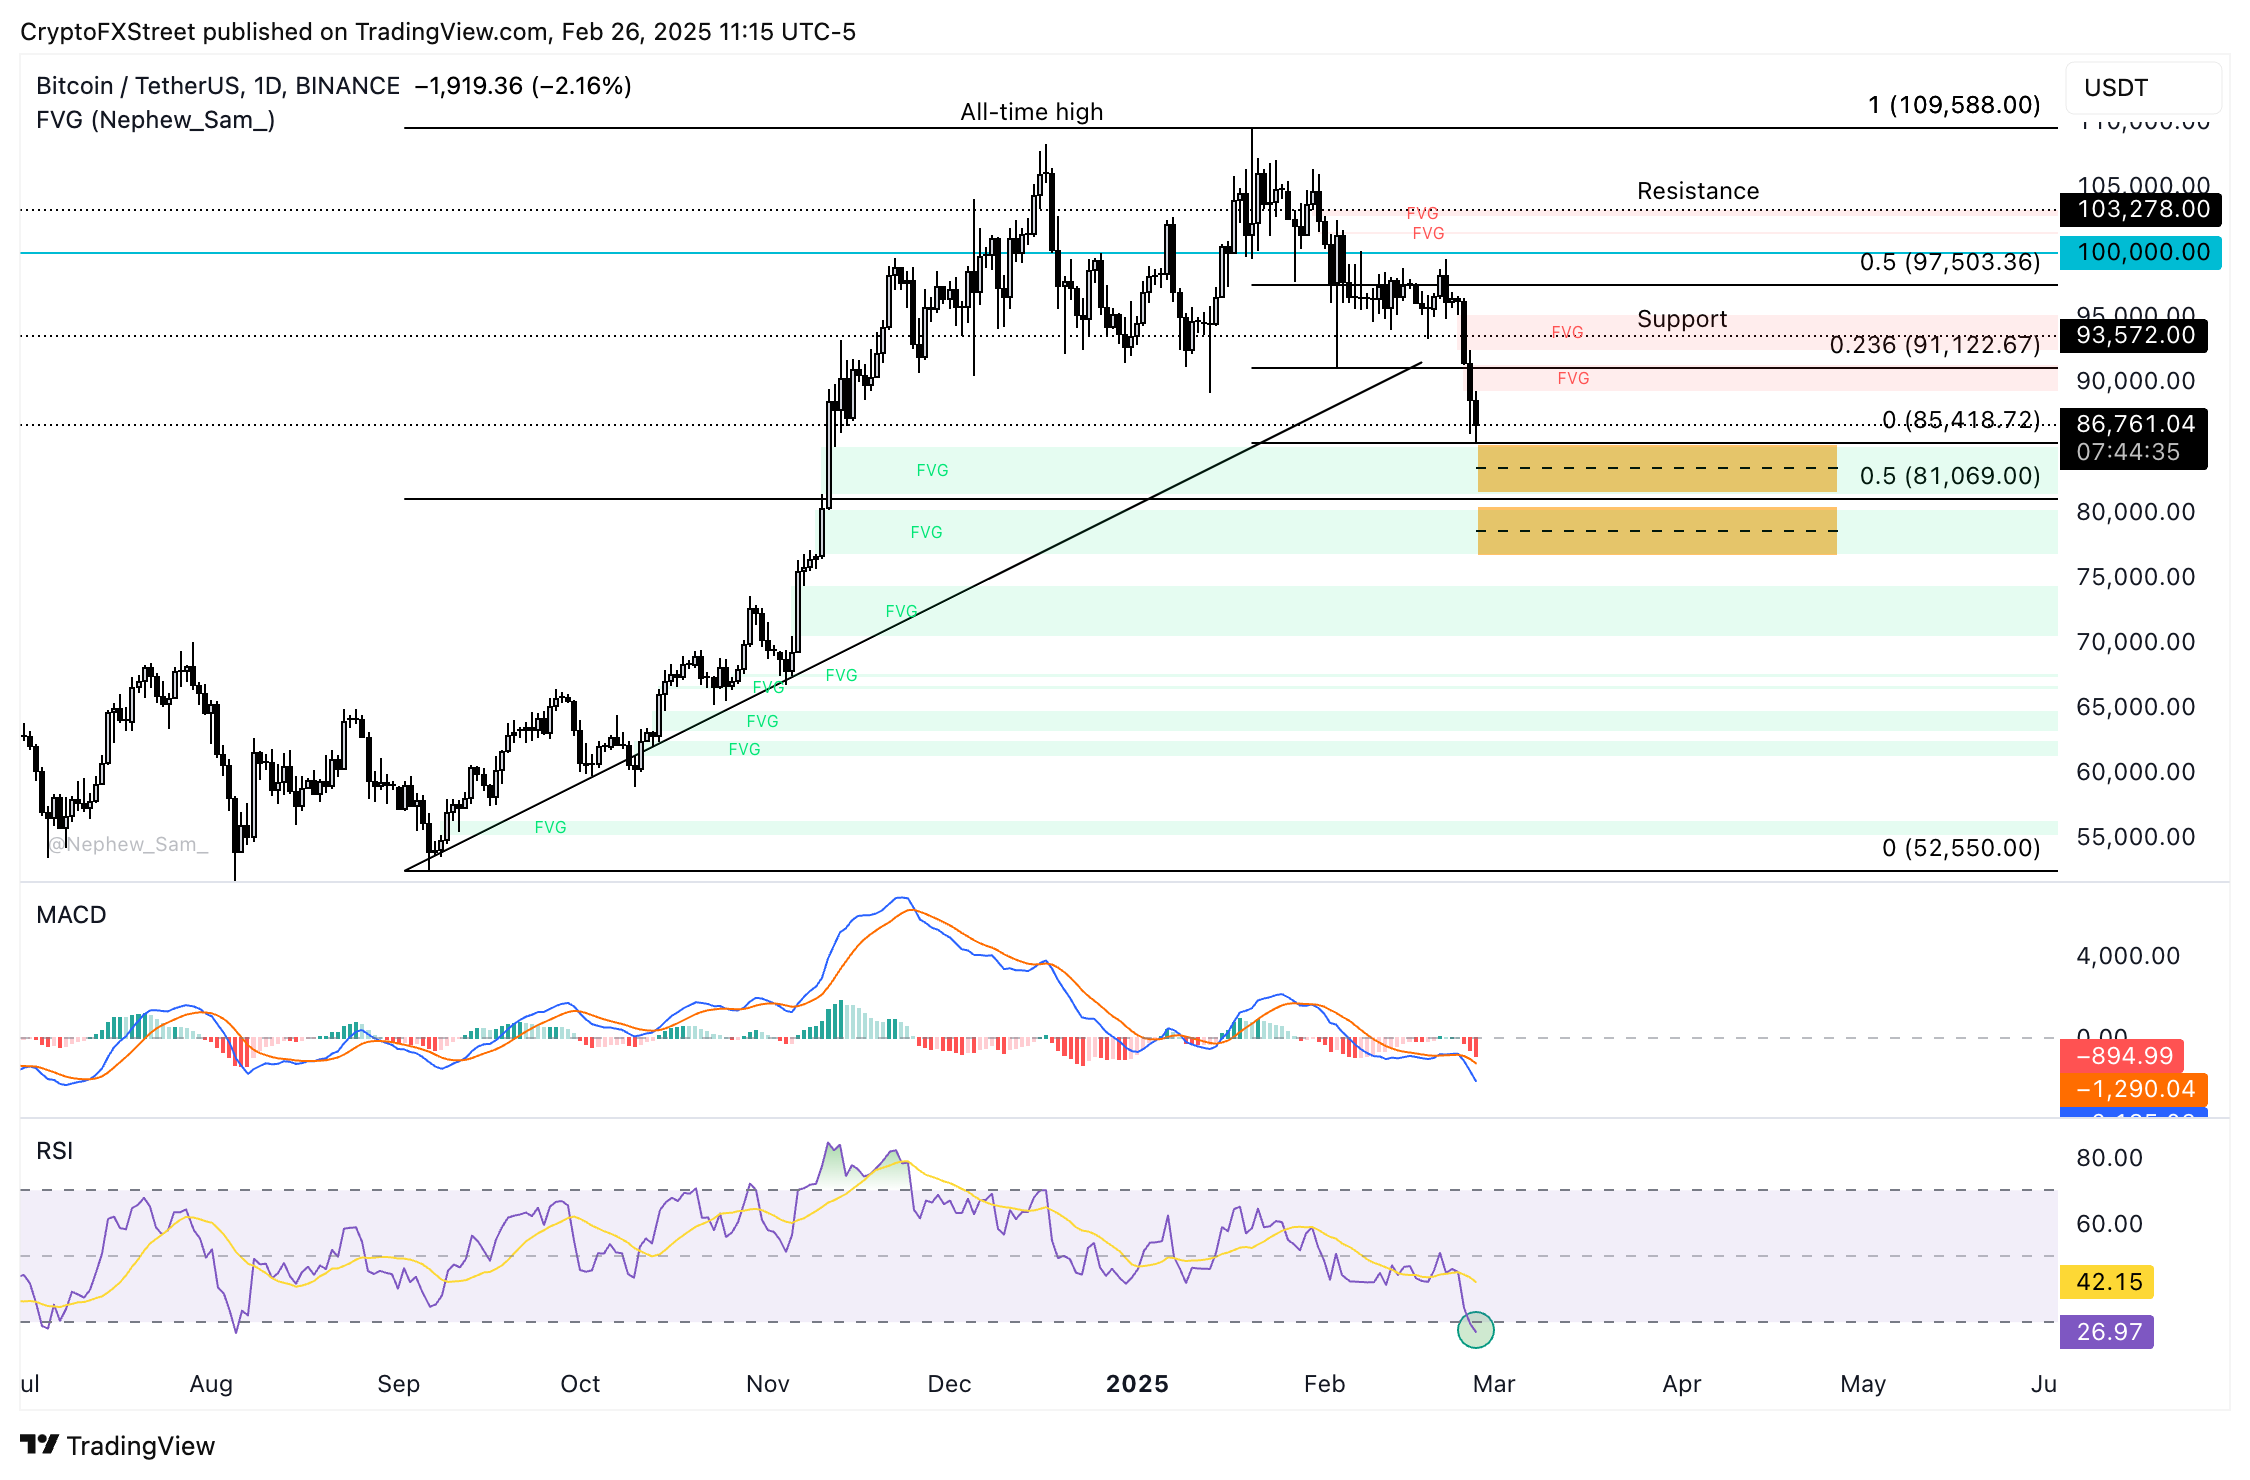
BTC/USDT daily price chart
Bitcoin traders face $211.81 million in liquidations, while on Tuesday, the number hovered around $750 million. Institutional traders are pulling capital from USbased spot Bitcoin Exchange Traded Funds (ETFs), as Farside Investors data reveals massive outflows from the investment product.
Consistent outflows are typically considered bearish for Bitcoin price in the short-term and signal that it is likely that institutional investors are losing interest in the cryptocurrency.
Ruslan Lienkha, Chief of Markets at YouHodler, shared his Bitcoin price target with FXStreet in an exclusive commentary.
“According to technical analysis, the next target for Bitcoin's price is around the $70,000 level, which serves as a strong support zone. However, we will only see this level if negative sentiment dominates the equity markets. US stock indices have been in the red for several consecutive days, but it is still too early to conclude that the broader uptrend has ended—it could simply be a market correction,” he said.
At the time of writing, Bitcoin trades at $86,761, down nearly 6% on the day.
Author

Ekta Mourya
FXStreet
Ekta Mourya has extensive experience in fundamental and on-chain analysis, particularly focused on impact of macroeconomics and central bank policies on cryptocurrencies.


