Top 3 Bitcoin, Ethereum & Ripple price prediction: buyers gathering strength for another bullish leg
- The money keeps flowing into the Crypto sphere, but bulls remain sidelined
- Main Cryptocurrencies reach accelerated moving averages, but not able to overcome them

The three main Cryptocurrencies are still attracting buyers, hinting at a possible bullish mid-term scenario.
Investors might be a bit out of place with the shy rises being registered during this week, after being used to big ranges in the Crypto sphere. There is no reason to be concerned. This is an opportunity to see less explosive developments, but much more sustainable. With the Cryptos in consolidation mode, a less volatile behavior might be a very important factor for a more solid bull market.
BTC/USD 4H chart
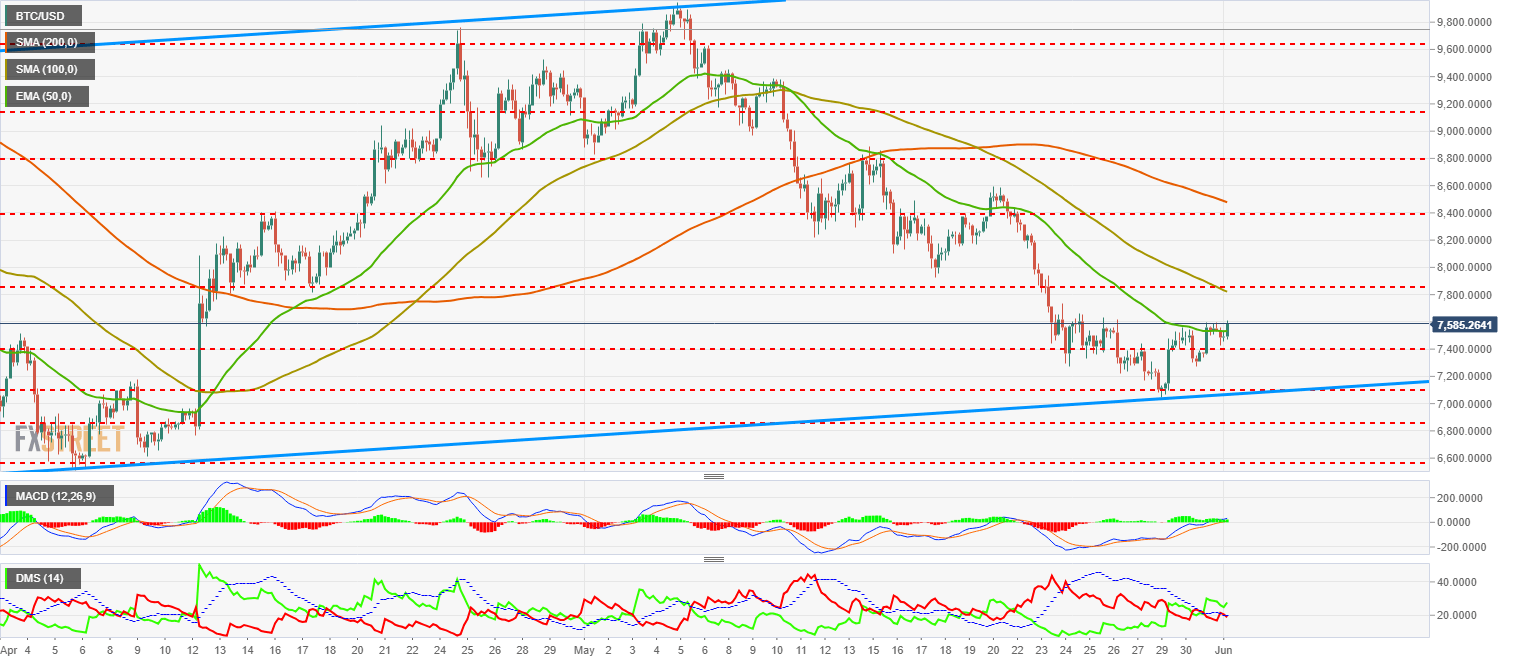
Bitcoin price is still contained by the top of its current range, right now at $581.50. BTC/USD is trading during the early European session above the 50-EMA but has not been able to break above $7600. This is a probable bullish continuation scenario in the next hours, targeting the 100-SMA around $7800. It looks quite probable that once that level is reached, Bitcoin might await the 50-EMA to reach from the downside to then continue rising towards the 200-SMA.
On the upside, besides meeting the 100-SMA, the next barrier is at the $7855. If that gets broken, Bitcoin could rally all the way up to $8400.
On the downside, the margin is still minimum, with a first but weak support at the 50-EMA, followed below by the price congestion area at the $7400 mark. The base of the channel that rules the price scenario at $7095.
MACD in the Bitcoin 4-hour chart is trading fully above the 0 line that indicates bullish momentum. The most common pattern is indicating a probable testing of the conquered level, so don't expect aggressive bullish moves. Bullish lateral action with buyers increasing their positions is the most likely scenario.
Directional Movement Index in the same chart is matching the exact bullish pattern. Buyers are still moving above the ADX while sellers diminish their strength and are trading below the trend strength indicator. There is room for bullish developments.
ETH/USD 4H chart
-636634437944223962.png)
Ethereum is trading at a more consistent price level than the Bitcoin, but with a bearish bias as the formation that rules it now. After consolidating the $565 level, ETH/USD is now trading around $581, slightly above the 50-EMA but not being able to conquer such moving average.
On the upside, ETH/USD needs to consolidate above the exponential average as a necessary step to attack the $620 level, where it will probably meet with the 100-SMA and the channel ceiling. Once that important barrier is cleared, next target is at $660, where it projects to meet the 200-SMA.
On the downside, the first immediate support is at the price congestion level at $560, with the intermediate trendline just below $555. If that support was lost, the scenario would get severely damaged, with bearish targets at $520 and $480.
MACD in the Ethereum 4-hour chart has not been able to break the mid-line of the indicator, so its profile is a bit weaker than in the Bitcoin's case.
Directional Movement Index in the same chart shows a similar profile than the Bitcoin one but still in a less advanced development. Sellers are below the 20 level that indicates the existence of trend strength and ADX is still below such level. Once the ADX clears again above such level, bulls will reactivate immediately.
XRP/USD 4H chart
-636634438219381415.png)
Ripple is trading very close to a clean scenario that might allow a gradually bullish development. Ripple is stuck, as its counterparts, above the 50-EMA.
On the upside, XRP/USD is very close to a price resistance at $0.63, and a bit above, at the $0.6359, to the 100-SMA.
On the downside, the first support is fragile at $0.611, followed below by the $0.599 level and a third support at the price congestion level of $0.584.
MACD in the 4-hour Ripple chart has indeed overcome the 0 line. The indicator has barely any inclination nor opening, and a confirmation pattern is the most likely scenario. Bullish profile in the mid-term.
Directional Movement Index in the same chart shows the sellers below the signal level (20) with buyers in a slight but gradual increase. ADX is still resisting above the trend strength signal.
Author

Tomas Salles
FXStreet
Tomàs Sallés was born in Barcelona in 1972, he is a certified technical analyst after having completing specialized courses in Spain and Switzerland. He expanded his technical training following the guidance of great experts on the financial markets.


