Top 3 Bitcoin, Ethereum, Ripple: BTC loses dominance as altcoins gain traction
- Bitcoin price has remained somewhat stable in the last two months trading between $50,000 and $60,000.
- The altcoin market had a significant recovery gaining more than $240 billion in market capitalization in the last week.
- Bitcoin’s dominance fell to 48.4% while Ethereum continues outperforming.

The cryptocurrency market remains in a significant uptrend after a massive $300 billion market capitalization recovery in the past two weeks. Ethereum is slowly outperforming Bitcoin as the flagship cryptocurrency remains quite stable.
Bitcoin price must climb above key level for a chance to new all-time highs
On the daily chart, Bitcoin price is getting rejected from the 26 EMA resistance level which is a significant barrier on the way up. A breakout above $55,610 could quickly drive Bitcoin price toward $57,233 at the 78.6% Fibonacci retracement level.
BTC/USD daily chart
Climbing above this Fib level can easily push the flagship cryptocurrency toward its previous all-time high at $64,854 as there is almost no resistance ahead.
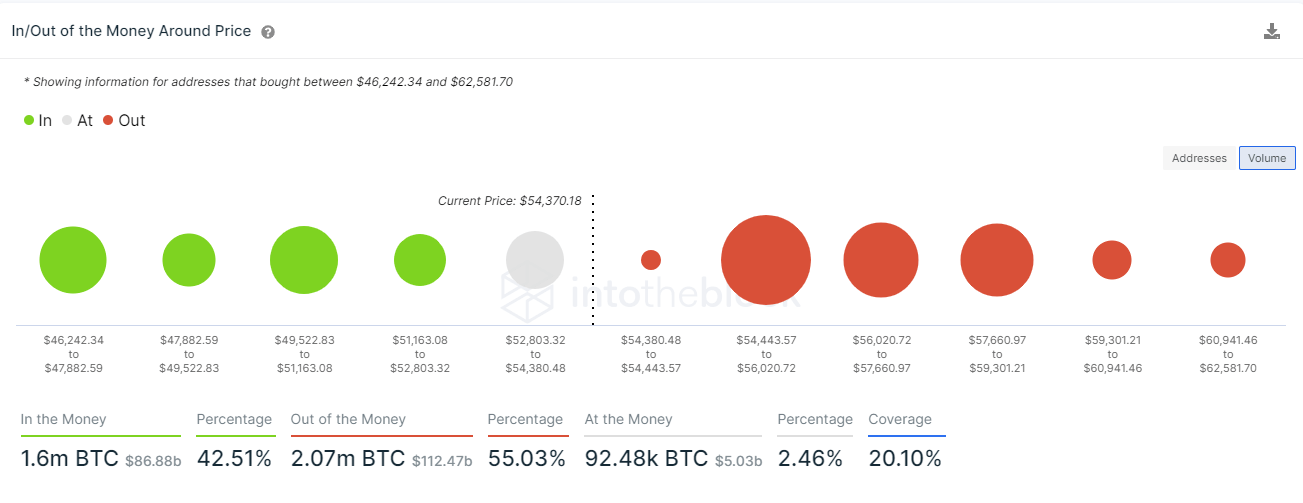
BTC IOMAP chart
However, the In/Out of the Money Around Price (IOMAP) chart shows a robust resistance area between $54,443 and $56,000 where 1.5 million addresses purchased almost 800,000 BTC.
The most critical support area is located between $49,522 and $51,163 which means Bitcoin price could touch this range.
Ethereum price faces massive sell signals
The TD Sequential indicator has presented a sell signal in the form of a green ‘9’ candlestick on the 6-hour chart and two green ‘8’ candlesticks on the 4-hour and 12-hour charts.
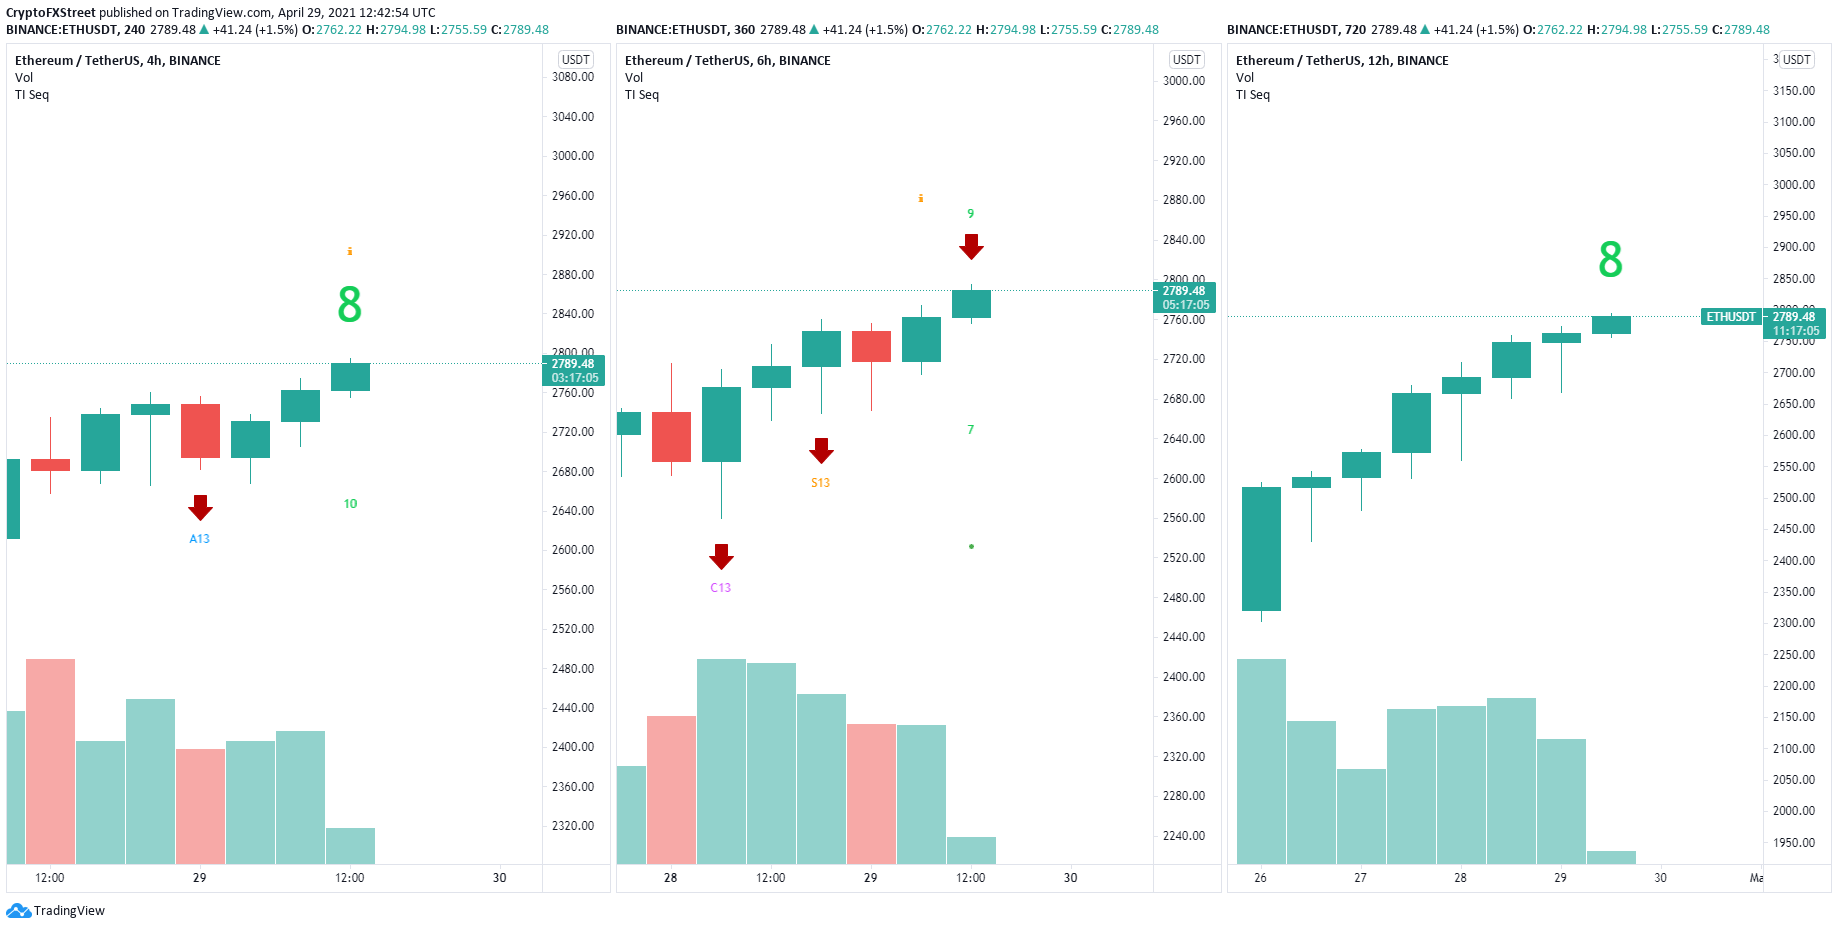
ETH/USD Sell Signals
Considering that the TD Sequential already presented a sell signal in-between both charts, the likelihood of both green ‘8’s to transform into two more sell signals is significantly high.
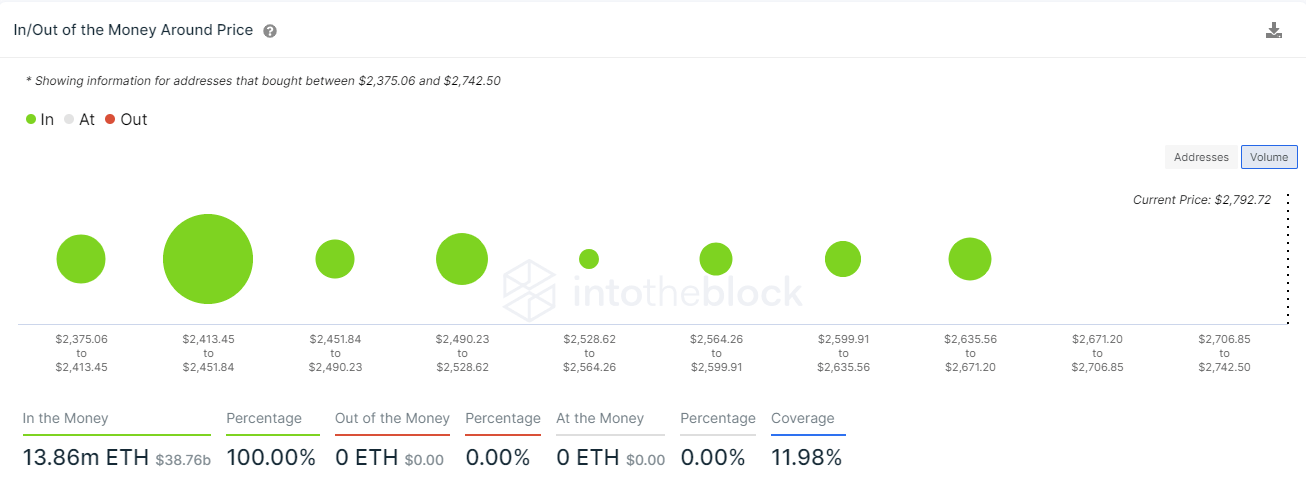
ETH IOMAP chart
The IOMAP chart shows only one significant support area between $2,413 and $2,451 where 8 million ETH was purchased by 274,000 addresses. Confirmation of all three signals can quickly send Ethereum price down here.
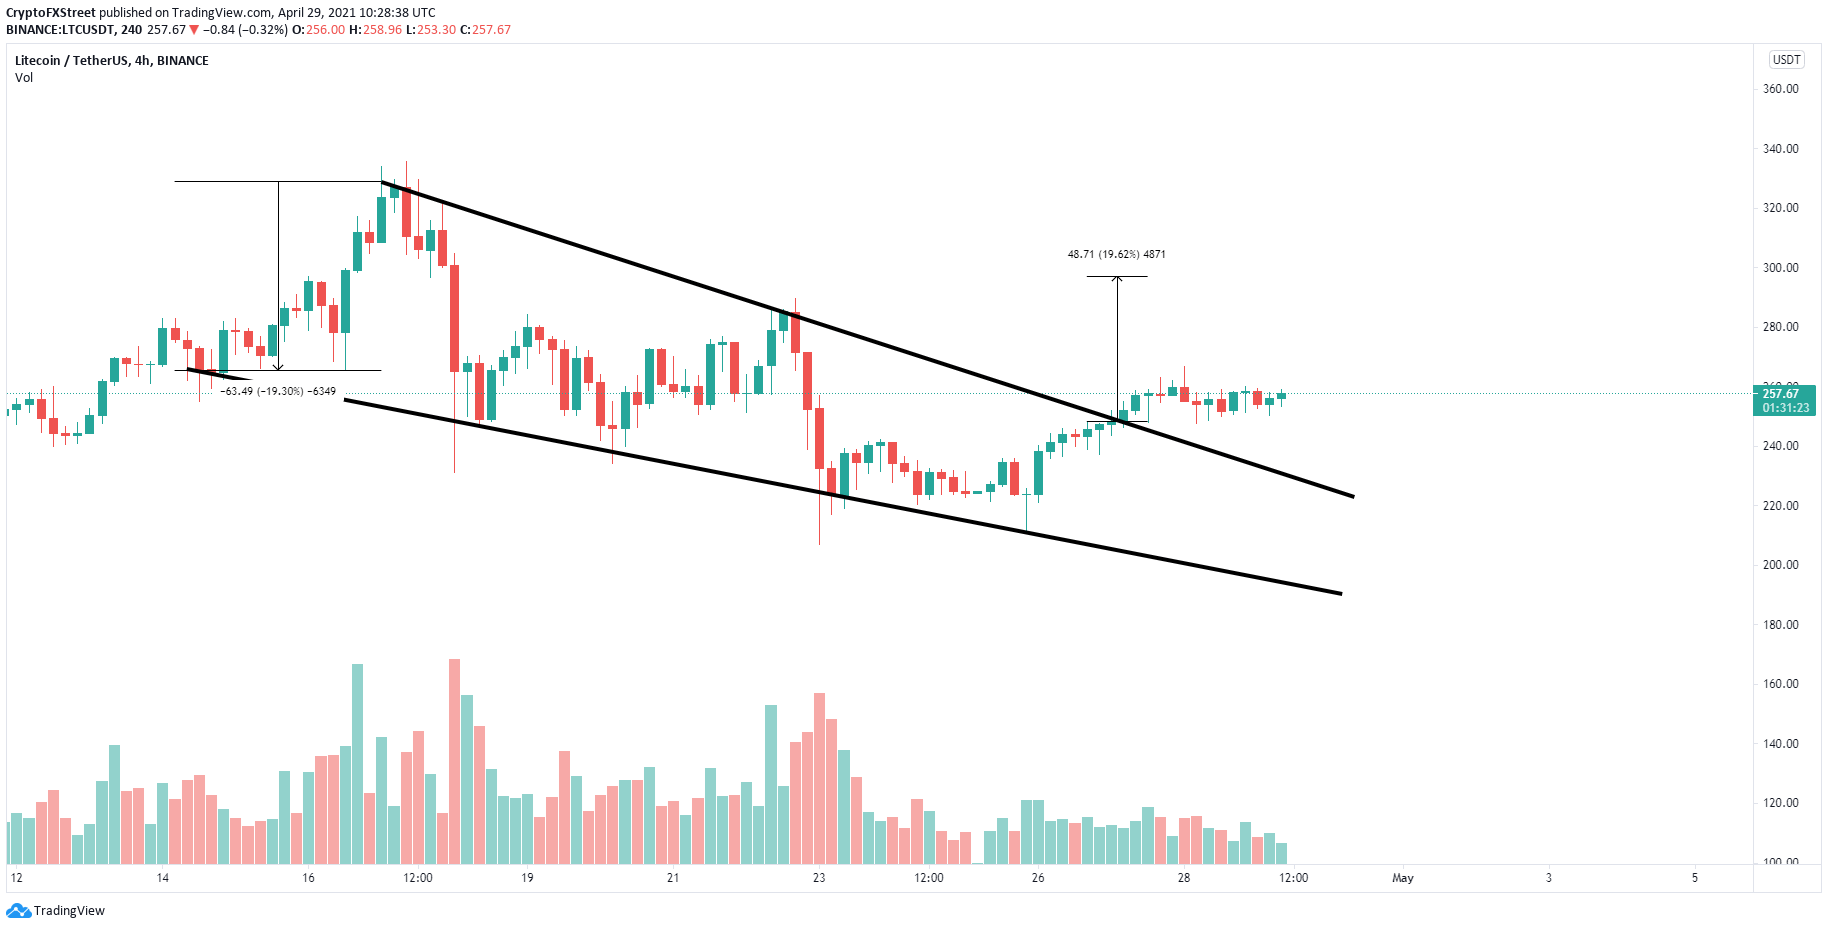
XRP price needs to stay above this level
On the 4-hour chart, XRP price had a breakout from a descending wedge pattern with a price target of $1.61 in the longer-term. This target has not been met yet and XRP trades just at the 100 SMA level.
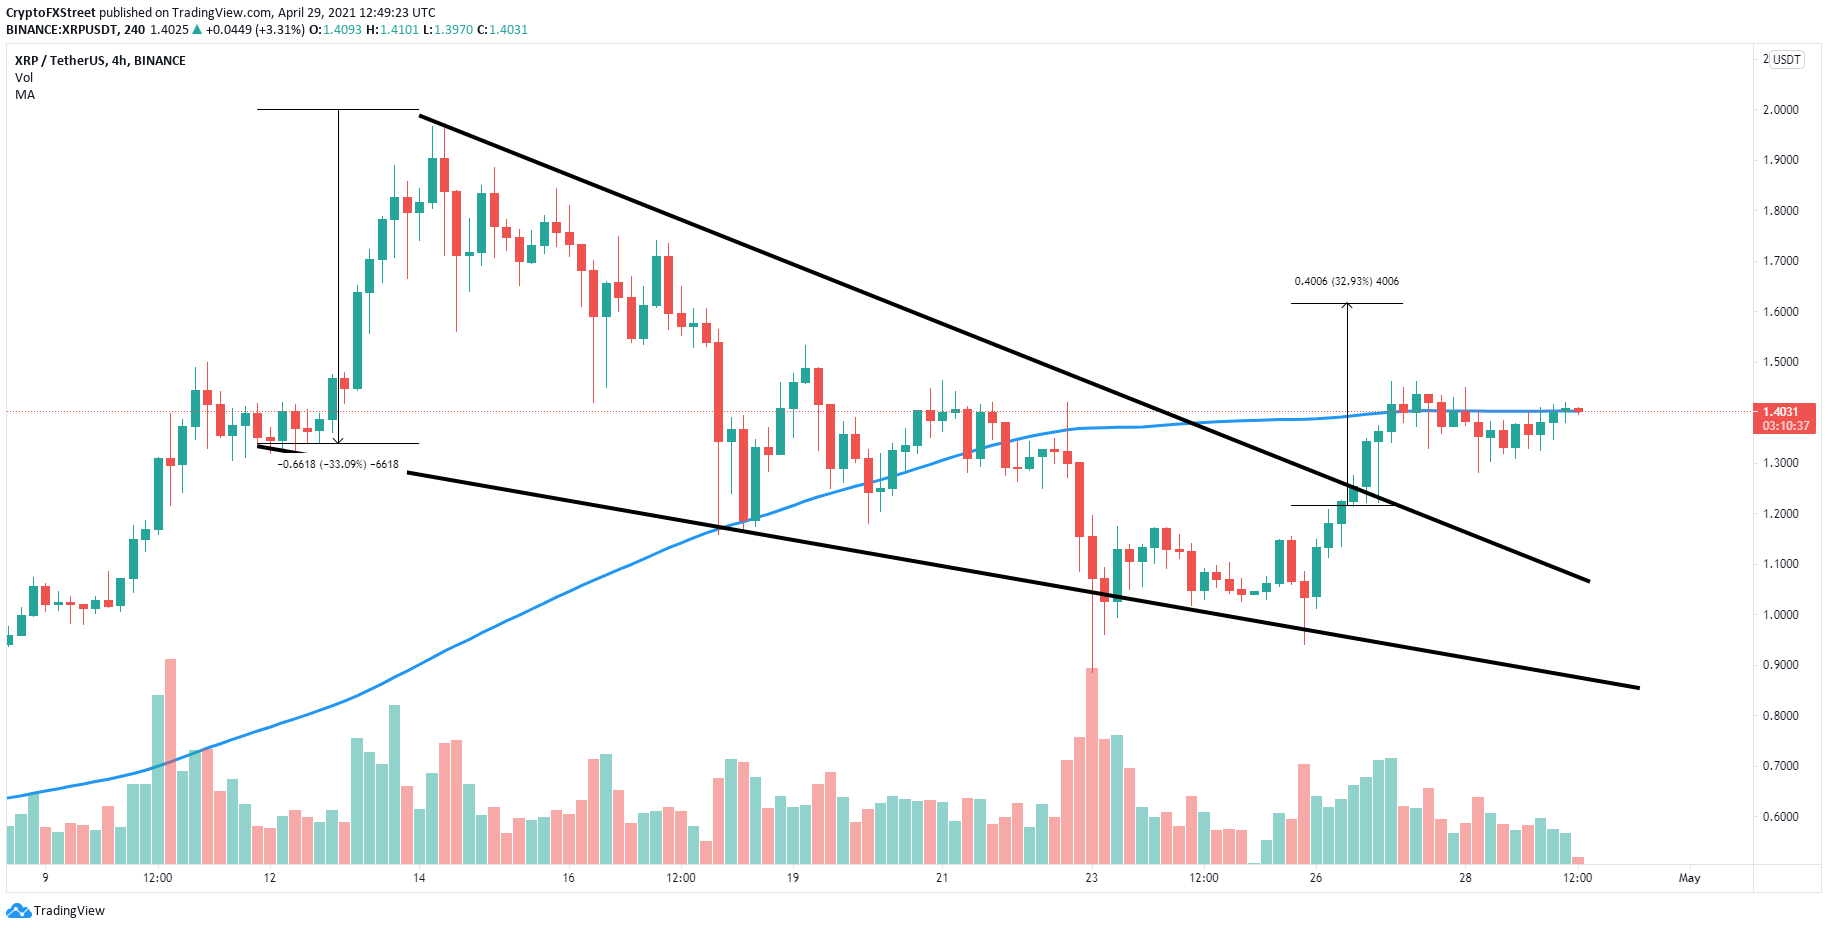
XRP/USD 4-hour chart
If XRP price can see a notable 4-hour candlestick close above the 100 SMA at $1.40, then it will likely jump toward $1.61.
However, if the 100 SMA is lost, the digital asset can quickly fall to $1.1, as it is the previous resistance trend line.
Author

Lorenzo Stroe
Independent Analyst
Lorenzo is an experienced Technical Analyst and Content Writer who has been working in the cryptocurrency industry since 2012. He also has a passion for trading.


