This is how long it would take for Polkadot to initiate a 210% recovery
- Polkadot, although not making any recovery currently, is on the path to note a rally by November 10.
- Short-term traders can capitalize on Polkadot’s high volatility, which is resulting in vast fluctuations.
- Newer investors should refrain from entering the Polkadot market as the potential risk-adjusted returns for DOT are negative at the moment.

Polkadot is among the cohort of cryptocurrencies that have yet to witness any recovery since the recent spikes in prices were wiped out by the dips in August. Standing at its June lows, DOT needs support from its investors as well as the broader market cues since, by itself, it is unable to sustain a rally.
Polkadot is struggling to mark a rise
The 24-hour chart highlights that Polkadot is still in the danger zone, forming lower lows despite the dip of August taking place two weeks ago. Trading at $7.37, the next best bet for DOT to engage in a rally is somewhere around November 10.
The timeline has been deduced by the repeated pattern of the Relative Strength Index (RSI), where DOT took 67 days to rise from the oversold zone to the overbought (OB) zone for the first time this year and another 88 days during May to August period.

Considering that average, the next time RSI reaches the OB zone would be after almost 74 days. In the same period, DOT needs to reclaim the support of the 38.2% Fibonacci retracement level in order to engage in recovery to its local top of $23.21. Once that happens, DOT will have a chance to rally on and complete its 214% recovery.
While this rise demands patience from investors, DOT has much more to offer its short-term traders. The volatility on Polkadot is extremely high, which is visible by the fluctuations.

The widening Bollinger Bands is an indication of the same. This leaves enough room for scalpers and short-term traders as the closest lower high is just 30% away.
However, first-time Polkadot investors should hold off for now as the market is not in a good state.
Returns on Polkadot suffer
At the moment, the risk-adjusted returns (Sharpe Ratio) on Polkadot stand at negative 3.10, levels which were last noted back in July. Fear of another market collapse looms above investors’ heads following the August dip, and it is valid as well since most of the market is observing losses.
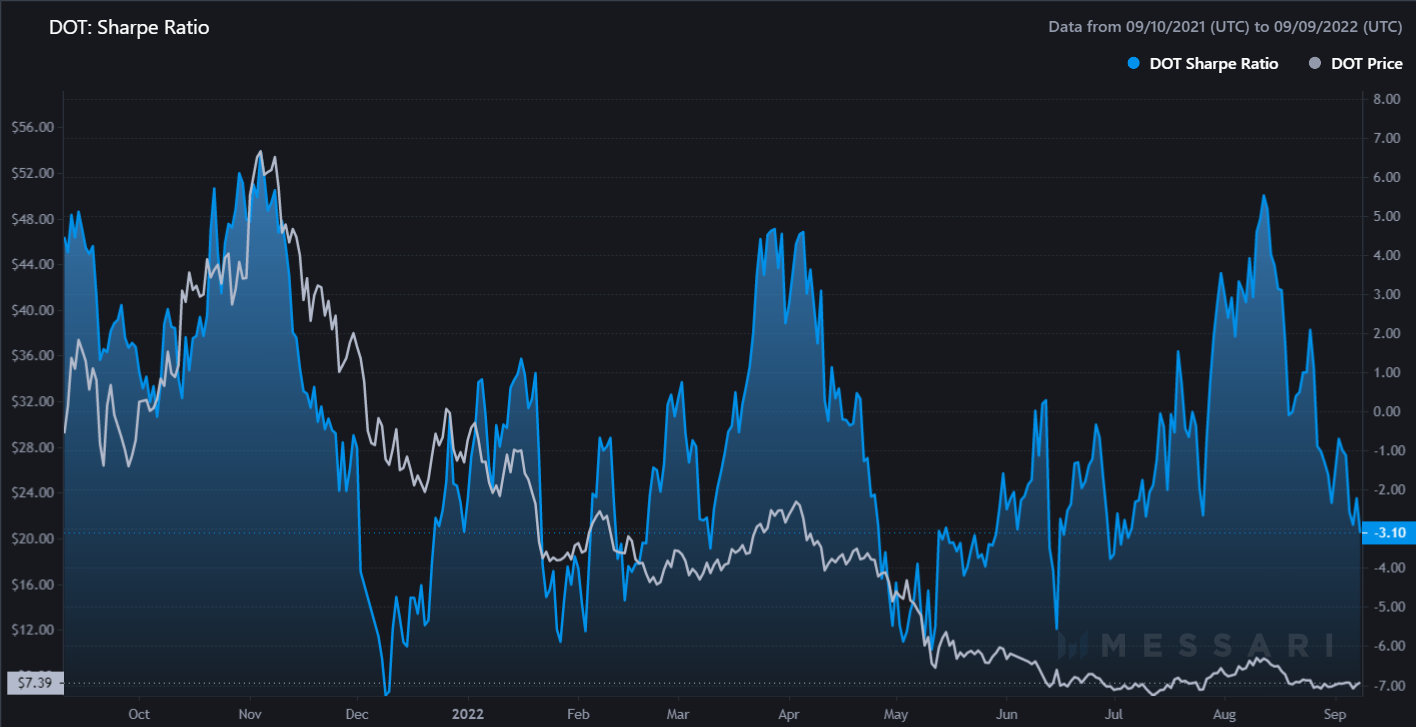
Polkadot sharpe ratio
Author

Aaryamann Shrivastava
FXStreet
Aaryamann Shrivastava is a Cryptocurrency journalist and market analyst with over 1,000 articles under his name. Graduated with an Honours in Journalism, he has been part of the crypto industry for more than a year now.


