|

THETA/USD Elliott Wave technical analysis [Video]

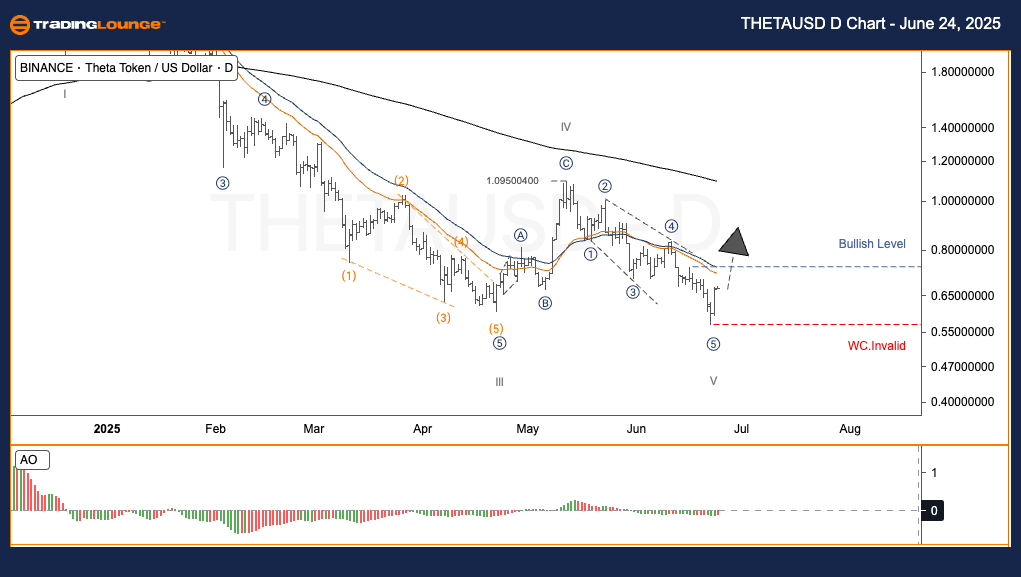
THETA/USD Elliott Wave technical analysis – Daily chart

  • Function: Trend-following.

  • Mode: Motive.

  • Structure: Impulse.

  • Current position: Wave 5.

  • Next direction (higher degree): To be monitored.

  • Wave cancellation level (invalidation): Not specified.

THETA/USD trading strategy

Following a completed 5-wave downward sequence, THETAUSD is now presenting signs of potential reversal. The key resistance to watch is the $0.75 level. If the price successfully breaks this zone, it could signal a bullish trend reversal.

Trading strategies

  • Approach:

  • Short-term traders (swing trade):

    • If THETAUSD remains above $0.75, there's a higher probability for an uptrend to begin.

  • Risk management:

    • If the price drops below $0.57, this would invalidate the recovery scenario.

Chart

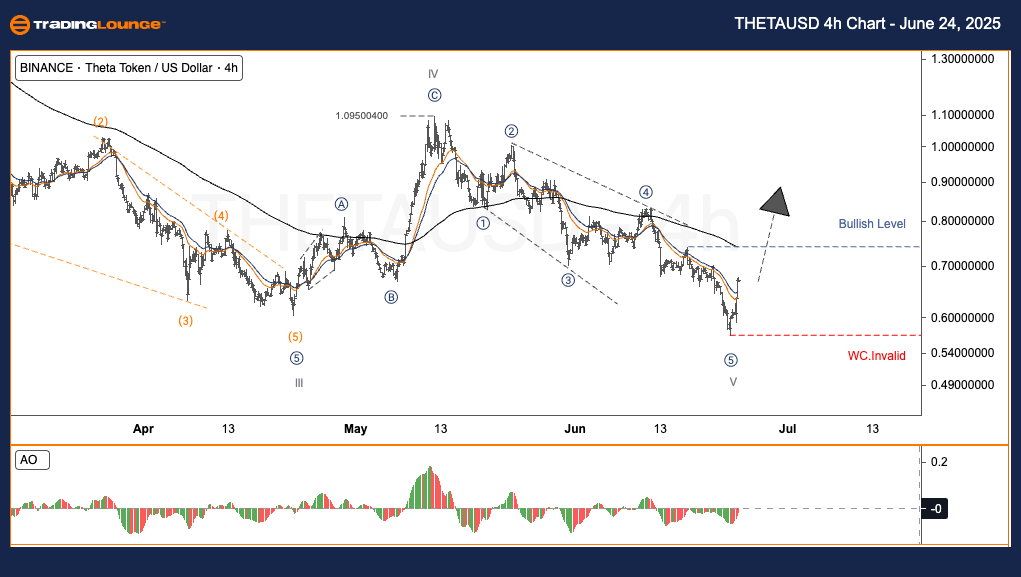
THETA/USD Elliott Wave technical analysis – Four-hour chart

  • Function: Trend-following.

  • Mode: Motive.

  • Structure: Impulse.

  • Current position: Wave 5.

  • Next direction (higher degree): To be monitored.

  • Wave cancellation level (invalidation): Not specified.

THETA/USD trading strategy

Following a completed 5-wave downward sequence, THETAUSD is now presenting signs of potential reversal. The key resistance to watch is the $0.75 level. If the price successfully breaks this zone, it could signal a bullish trend reversal.

Trading strategies

  • Approach:

  • Short-term traders (swing trade):

    • If THETAUSD remains above $0.75, there's a higher probability for an uptrend to begin.

Risk management:

  • If the price drops below $0.57, this would invalidate the recovery scenario.

Chart

THETA/USD Elliott Wave technical analysis [Video]

Author

Peter Mathers

Peter Mathers

TradingLounge

Peter Mathers started actively trading in 1982. He began his career at Hoei and Shoin, a Japanese futures trading company.

More from Peter Mathers
Share:

Editor's Picks

Sonic Labs’ vertical integration fuels recovery in S token

Sonic, previously Fantom (FTM), is extending its recovery trade at $0.048 at the time of writing, after rebounding by over 12% the previous day. The recovery thesis’ strengths lie in the optimism surrounding Sonic Labs’ Wednesday announcement to shift to a vertically integrated model, aimed at boosting S token utility. 

Midnight Price Forecast: NIGHT warms up as Hoskinson reveals March mainnet release

Midnight edges higher by 2% at press time on Thursday, driven by its founder announcing the mainnet release by late March at the Consensus 2026 event. The technical outlook for Midnight highlights a potential bottom formation that could ignite the next bullish trend.

Cardano Price Forecast: ADA eyes short-term rebound as derivatives sentiment improves

Cardano (ADA) is trading at $0.257 at the time of writing on Thursday, after slipping more than 4% so far this week. Derivatives sentiment improves as ADA’s funding rates turn positive alongside rising long bets among traders.

Top Crypto Gainers: Pippin rally logs over 75% gains, Aster and Kaia push higher

Altcoins, such as Pippin (PIPPIN), Aster (ASTER) and Kaia (KAIA) continue to trade in the green, defying the broader market pullback as Bitcoin (BTC) dropped to below $68,000. PIPPIN continues to rally and ASTER and KAIA show short-term recovery with possibilities of a breakout rally.

Bitcoin Price Annual Forecast: BTC holds long-term bullish structure heading into 2026

Bitcoin (BTC) is wrapping up 2025 as one of its most eventful years, defined by unprecedented institutional participation, major regulatory developments, and extreme price volatility.

Bitcoin: The worst may be behind us

Bitcoin (BTC) price recovers slightly, trading at $65,000 at the time of writing on Friday, after reaching a low of $60,000 during the early Asian trading session. The Crypto King remained under pressure so far this week, posting three consecutive weeks of losses exceeding 30%.