|

TheGraph price is at risk of a 25% drop as whales go into a selling spree

  • TheGraph price is contained inside a parallel channel on the 4-hour chart.
  • A key indicator has just presented a sell signal for GRT.
  • A significant number of whales have sold their GRT holdings in the past two weeks.

TheGraph price has been trading inside a defined range between $2 and $1.4 for the past week and a half. However, it seems that bears have the upper hand in the short-term.

TheGraph price faces strong selling pressure due to whales

GRT seems to be facing a lot of selling pressure in the short-term as a large portion of whales holding at least 10,000,000 coins have exited the market. Since February 21, the number of these large holders dropped from 115 to 108 currently. 

grt price

GRT Holders Distribution

Besides the pressure from the whales, the TD Sequential indicator has also just presented a sell signal on the 4-hour chart, right at the top of a parallel channel. TheGraph price could quickly drop towards $1.44, a 25% move. 

grt price

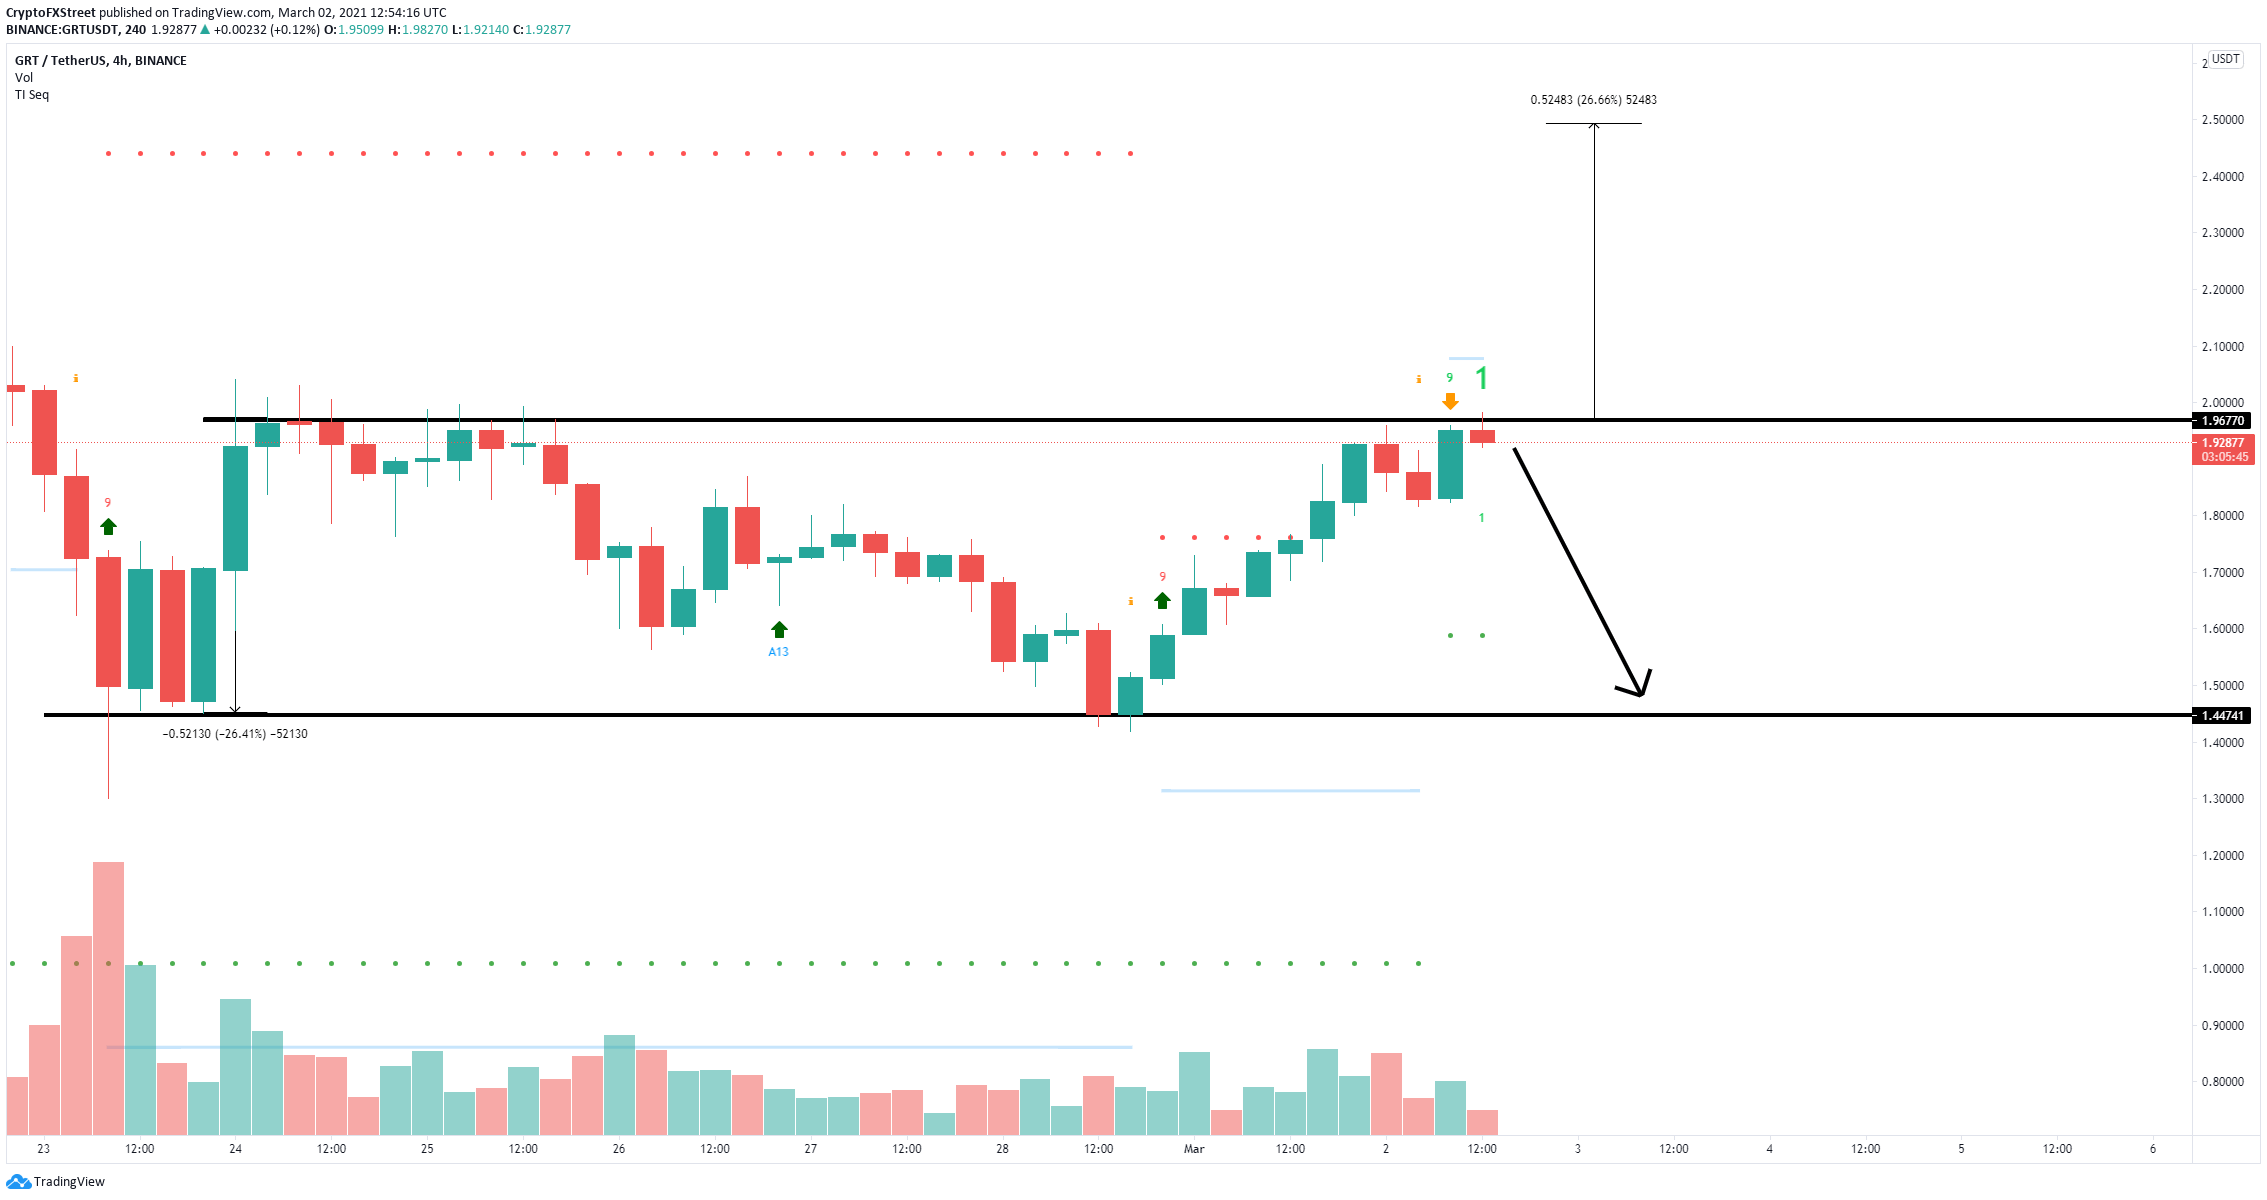
GRT/USD 4-hour chart

On the flip side, the only hope for the bulls is to push TheGraph price above $2 to invalidate the sell signal and confirm a breakout above the parallel channel. This move would have a price target of $2.5.   

Author

Lorenzo Stroe

Lorenzo Stroe

Independent Analyst

Lorenzo is an experienced Technical Analyst and Content Writer who has been working in the cryptocurrency industry since 2012. He also has a passion for trading.

More from Lorenzo Stroe
Share:

Editor's Picks

BNB Price Forecast: Correction extends as bearish signals point to deeper losses

BNB, formerly known as Binance Coin, continues to extend its losses, trading below $573 at the time of writing on Friday, losing over 7% so far this week. Muted institutional demand, rising short bets and falling Open Interest signal growing downside bias.

Bitcoin network activity hits new high despite stalled prices — CryptoQuant
Bitcoin's onchain activity has climbed to its strongest level of 2026 even as the top crypto continues to trade under bearish pressure, according to a Thursday report from CryptoQuant. The recovery in network activity is being driven almost entirely by transaction volume rather than higher-value economic transfers.
Cardano Price Forecast: Derivatives and on-chain losses compound bearish trend

Cardano (ADA) remains under pressure, trading below $0.165 and losing over 11% so far this week. Weakening derivatives metrics and deteriorating on-chain data support further correction on ADA. Cardano derivatives metrics support a negative outlook.

Crypto Overview: Bitcoin extends decline amid US-Iran negotiation concerns – BCH, HYPE lead losses
The broader cryptocurrency market feels the weight of strained US-Iran negotiations, pushing Bitcoin (BTC) below $63,000 on Friday. Israeli missile strikes over Lebanon bend the first clause of the peace agreement, raising concerns over the renewed passage through the Strait of Hormuz.
Experts agree: Bitcoin nears bottom, but weak demand raises doubts
Bitcoin (BTC) is trading above $63,000 at the time of writing on Friday after rebounding from the key 200-week Simple Moving Average (SMA) near $62,000, a level widely viewed as key long-term support. The recovery may suggest that Bitcoin has found a floor after a sharp correction that spanned more than a month, but some warning signs persist.