- A software company, The9, signed a deal to purchase $2 million worth of Filecoin mining machines.
- This move comes after The9 had previously signed a $10 million agreement with a Filecoin mining machine vendor.
- FIL price is getting squeezed in a rising wedge pattern, indicating a 17% drop shortly.
The development around Filecoin, its mining machines and hosting have caused FIL prices to climb violently in the last few days. However, this surge could be coming to an end as a bearish pattern looms.
The9 signs second Filecoin deal in under two months
On Tuesday, The9, a Shanghai-based online game operator, signed a $2 million Filecoin mining machine purchase and hosting agreement with a Filecoin mining service provider.
Filecoin has been growing increasingly popular among Chinese counterparts due to the mining incentives. Hence, The9’s investment deal makes sense. Additionally, the company is known to own and operate an independent node on the Filecoin blockchain.
Moreover, The9 also owned approximately 8 Pebibytes of effective storage mining power in the Filecoin network. This share has increased to 80 Pebibytes after the recent deal was struck.
The news of this caused the Filecoin price to skyrocket 25% in under 16 hours on March 30.
FIL price surge could face blockade
The FIL price has created three higher highs and lows in the last 13 days. A rising wedge pattern is formed when the swing points are joined using trend lines.
The technical formation has a bearish bias that is confirmed after a breakdown of the lower trend line. In Filecoin’s case, a breach of the $138.95 level will trigger a 17% crash, determined by measuring the distance between the swing high and low at the broadest part.
This target places the Filecoin price at $114.55.
Interestingly, the target is extremely close to the 50% Fibonacci retracement level at $116.13.
Adding credence to the bearish outlook is the preemptive cycle top signal portrayed by the Momentum Reversal Indicator (MRI) on the daily chart. This sign suggests that the Filecoin price might be due for a reversal toward its lower trendline.
Therefore, a breakdown of the rising wedge’s lower boundary could result in a 17% drop to $114.50.
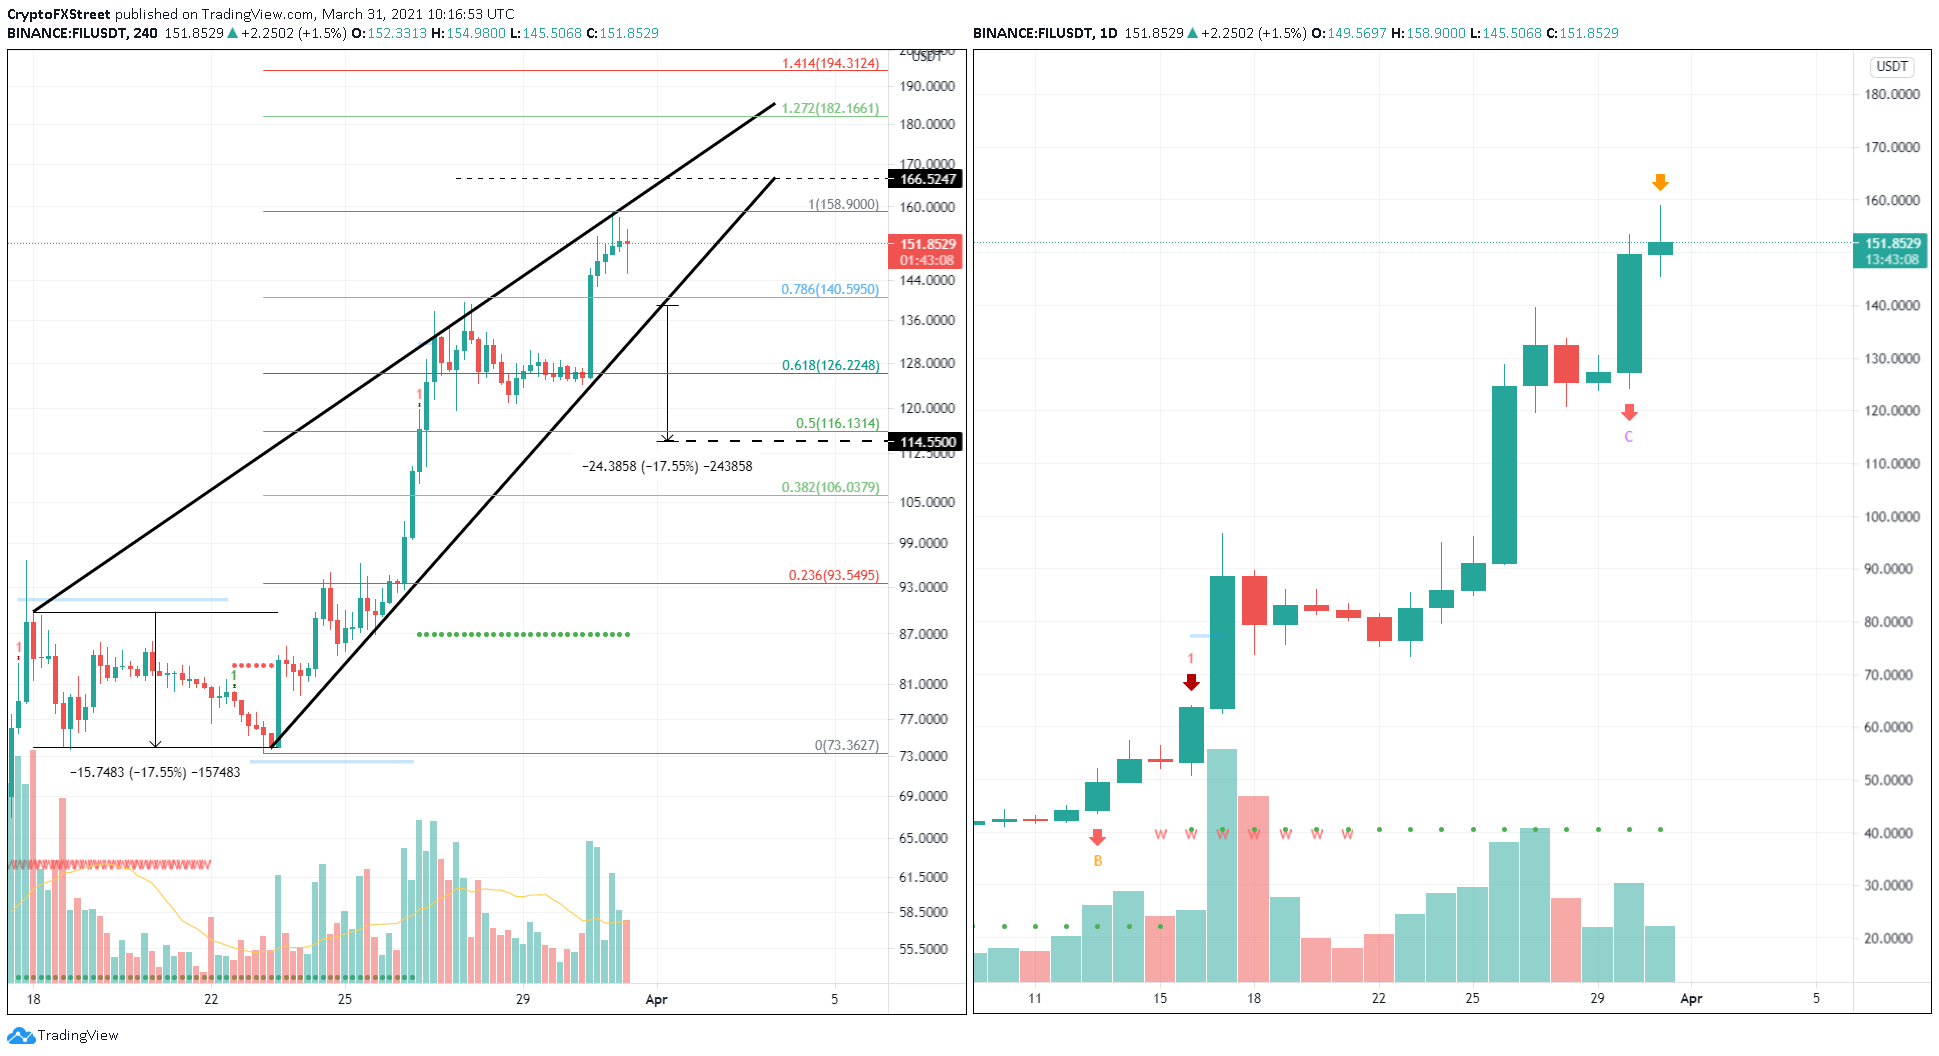
FIL/USDT 4-hour, 1-day chart
On the other hand, a sudden spike in bullish momentum leading to a decisive close above the upper trend line at $158.90 could jeopardize the bearish thesis.
In such a scenario, the FIL price could surge nearly 5% to $166.52. This move would invalidate the bearish outlook. If the bullish momentum persists, then investors can expect a move toward the 127.2% Fibonacci extension level at $182.16.
Information on these pages contains forward-looking statements that involve risks and uncertainties. Markets and instruments profiled on this page are for informational purposes only and should not in any way come across as a recommendation to buy or sell in these assets. You should do your own thorough research before making any investment decisions. FXStreet does not in any way guarantee that this information is free from mistakes, errors, or material misstatements. It also does not guarantee that this information is of a timely nature. Investing in Open Markets involves a great deal of risk, including the loss of all or a portion of your investment, as well as emotional distress. All risks, losses and costs associated with investing, including total loss of principal, are your responsibility. The views and opinions expressed in this article are those of the authors and do not necessarily reflect the official policy or position of FXStreet nor its advertisers. The author will not be held responsible for information that is found at the end of links posted on this page.
If not otherwise explicitly mentioned in the body of the article, at the time of writing, the author has no position in any stock mentioned in this article and no business relationship with any company mentioned. The author has not received compensation for writing this article, other than from FXStreet.
FXStreet and the author do not provide personalized recommendations. The author makes no representations as to the accuracy, completeness, or suitability of this information. FXStreet and the author will not be liable for any errors, omissions or any losses, injuries or damages arising from this information and its display or use. Errors and omissions excepted.
The author and FXStreet are not registered investment advisors and nothing in this article is intended to be investment advice.
Recommended Content
Editors’ Picks
Ripple's move above this key level could trigger nearly 50% rally for XRP
Ripple has overcome a critical resistance level and flipped into a support floor on the weekly time frame. This development happened while XRP tightly consolidated for roughly 250 days. Investors can expect XRP to kickstart a massive rally.
Optimism price outlook with nearly $90 million worth of OP tokens flooding markets on Friday
Optimism volatility has shrunk in the ours leading to the network’s cliff unlock. It joins the likes of dYdX and Sui, which have similar events on their calendars. As token unlocks are often considered bearish catalysts, investors should brace for a reaction after the event.
Top 3 Price Prediction Bitcoin, Ethereum, Ripple: Retail watches from the sidelines with a bias for shorts
Bitcoin could clear $73,777 peak as BTC bulls resurface. Ethereum might fall 10% before next leg up as ETH RSI teases with sell signal. XRP could lose $0.6000 threshold as Ripple bulls fail to show up.
Jito price could hit $6 as JTO coils up inside this bullish pattern
Jito price action shows a potential cup and handle formation. Based on theoretical measurement rules, a successful breakout could yield a 56% rally to $6.0. A breakdown of the $3.86 support level would create a lower low for JTO and invalidate the bullish thesis.
Bitcoin: BTC may have recovered, but is it out of the woods?
Bitcoin’s (BTC) upward momentum has shown a significant decline for the past two weeks or so. This development led to a bearish signal on the weekly and an uncertain outlook on the monthly.