Tezos Price Forecast: XTZ edges closer to a 20% bull rally
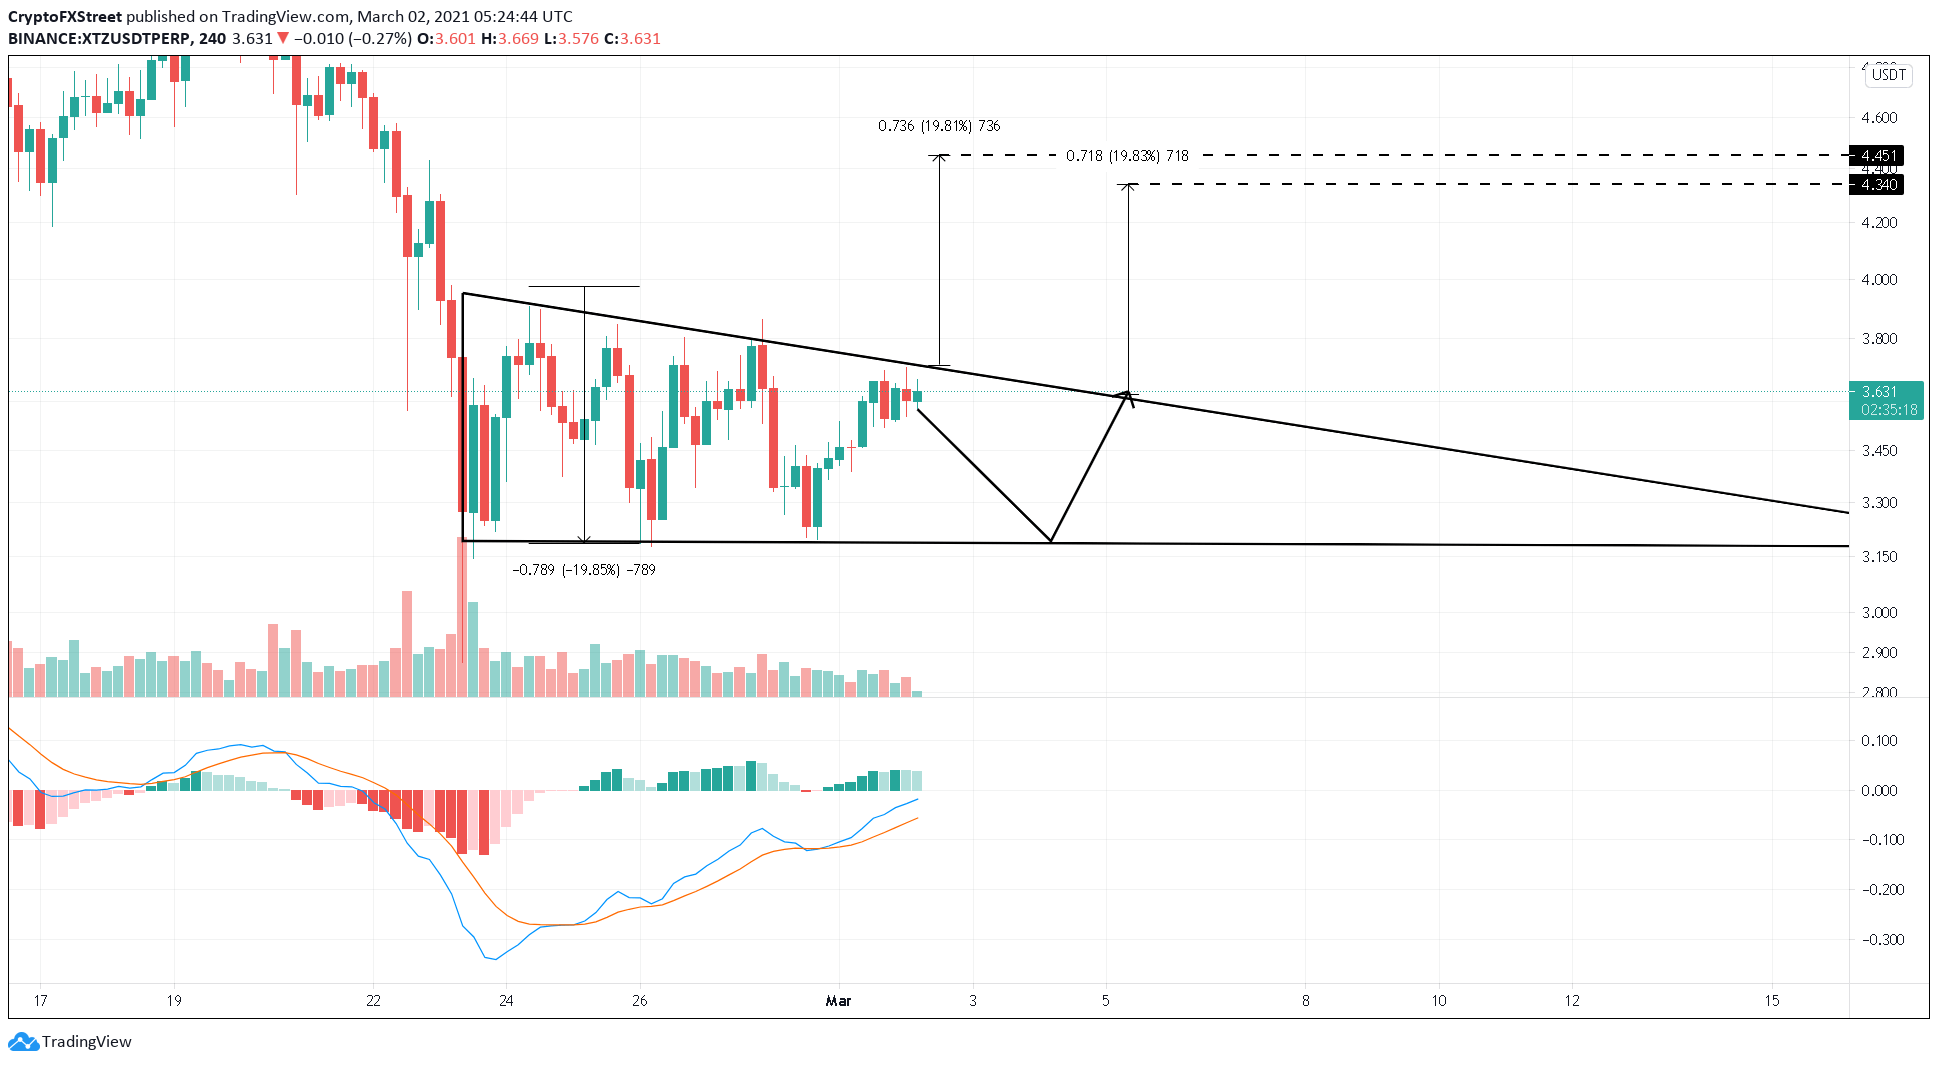
- Tezos price is consolidating in a descending triangle pattern, which suggests a 20% upswing.
- A bullish breakout would result in XTZ heading to $4.5 or $4.3.
- However, close below the horizontal support at $3.2 would result in a 20% downswing to $2.57.

Tezos price slid into consolidation after a 44% drop from February 20 to 23. The consolidation pattern seems to have found support at $3.2, where XTZ has bounced off thrice. These swing lows could be considered a triple bottom pattern, suggesting that a reversal could be in play.
Tezos price hints at a bullish breakout
Tezos price witnessed aggressive sellers persisting after the 44% drop. Due to this bearish momentum, each bullish swings were lower than the previous ones, resulting in a series of lower highs. However, each time the sellers pushed XTZ lower, it bounced off the horizontal demand barrier at $3.2. By joining these swing highs and swing lows, a descending triangle forms. This technical formation forecasts a target equal to the distance between the pivot high and flat support measured from the breakout point.
In this case, if Tezos price manages a 4-hour candlestick close above $3.5, then a 20% upswing to $4.51 seems likely.
Adding credence to this bullish thesis is the Moving Average Convergence Divergence (MACD) indicator’s green histograms that have formed above the zero-line. Additionally, the MACD line or 12 four-hour exponential moving average (EMA) crossed above the signal line or 26 EMA on February 25. This move represents a bullish crossover which is still in effect suggesting a positive outlook.
An alternative scenario that Tezos price could witness is a rejection at the triangle’s hypotenuse resulting in a bounce from the flat support. In this scenario, a four-hour candlestick close above $3.62 will result in a 20% upswing to $4.34.
XTZ/USDT 4-hour chart
Regardless, investors should note that a four-hour candlestick close below the horizontal support at $3.2 will invalidate the bullish thesis and result in a 20% downswing to $2.57.
Author

Akash Girimath
FXStreet
Akash Girimath is a Mechanical Engineer interested in the chaos of the financial markets. Trying to make sense of this convoluted yet fascinating space, he switched his engineering job to become a crypto reporter and analyst.


