Terra’s LUNA price freefall suddenly grinds to a halt flaunting bullish signals
- Relief as LUNA price rebounds from support established at $1.88.
-
Multiple buy signals come to life as LUNA price pushes its bullish mission to $3.00.
-
Traders should consider booking early profits at $2.00, citing immense resistance along a descending trend line.

LUNA price heads north after breaking a two-week losing streak from August’s peak at $2.61. This turnaround could suggest that retail investors are returning amid growing speculation for a bullish impulse targeting $3.00.
Is LUNA price ready to move north?
Odds appear to be leaning on the upside as LUNA price bounces off support at $1.88. The most challenging task for the bulls is to confirm a break beyond the 50-day Simple Moving Average (SMA) at $2.00. A four-hour to a daily close above this resistance will encourage buyers to put aside their doubts and get on board for gains eyeing $3.00.
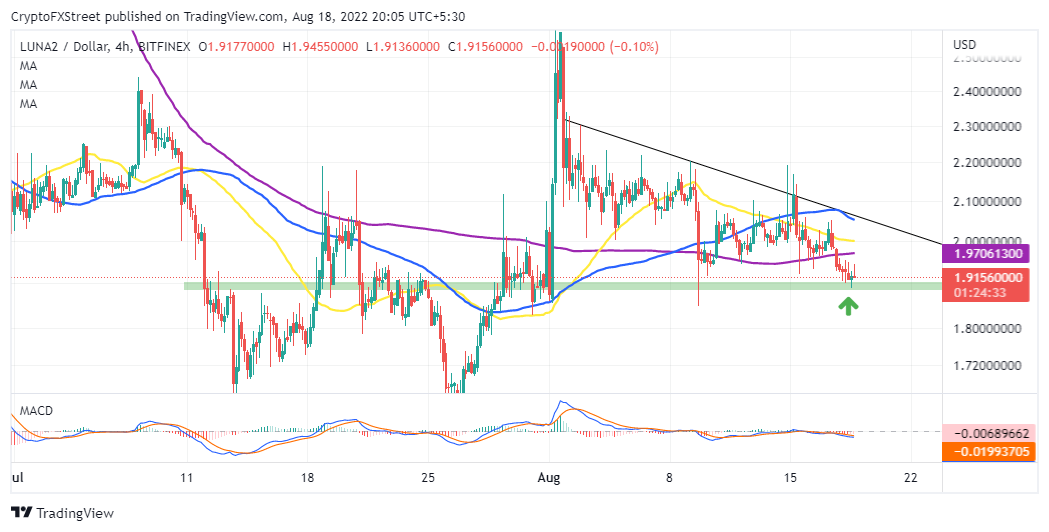
LUNA/USD four-hour chart
The Relative Strength Index (RSI) in the same four-hour timeframe shows that bears are resilient and would need more persuasion if LUNA price is to cement its uptrend. Therefore, traders must keenly follow the RSI’s movements in the near term. If it makes a comeback above the midline and forms a bullish divergence with the price, buyers will win the tug of war and secure the recovery path.
Aiding the new uptrend is a buy signal from the TD Sequential indicator. As observed on the three-hour chart below, this call to investors to consider buying LUNA manifested in a red nine candlestick. It hints at a weakening downtrend, giving way to a potential uptrend.
Usually, a buy order is recommended when the low of the sixth and seventh candles in the count is exceeded by the low of the eighth and ninth bars.
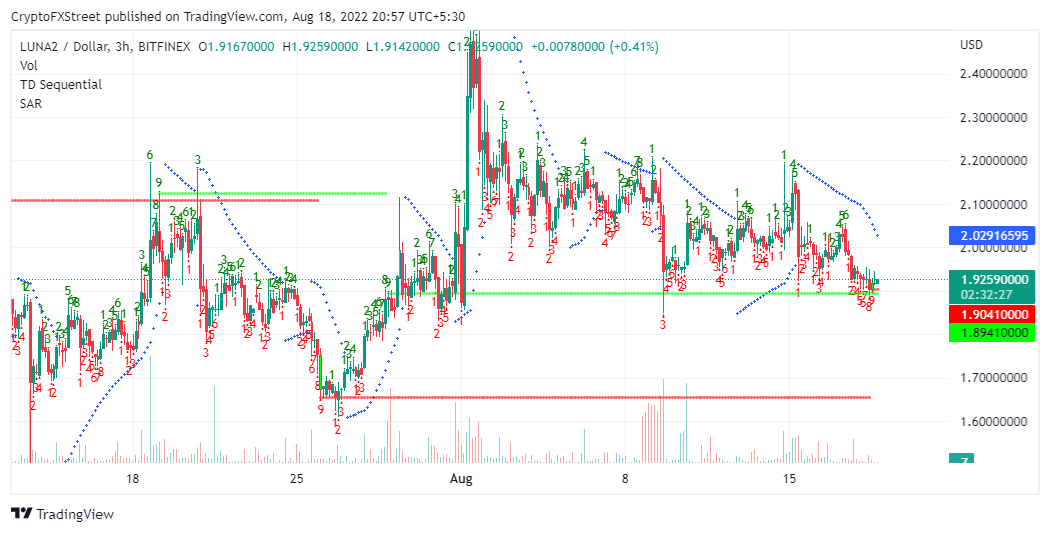
LUNA/USD three-hour chart
For traders, it would be safer to settle for profit at $2.00, keeping in mind that LUNA price has not broken above the descending trend line on the four-hour chart since early August.
The Parabolic SAR indicator on the three-hour chart may hinder a significant recovery unless it flips below LUNA price. If buyers lose grip of the expected uptrend, losses could build up to $1.80 and $1.60 sequentially.
Author

John Isige
FXStreet
John Isige is a seasoned cryptocurrency journalist and markets analyst committed to delivering high-quality, actionable insights tailored to traders, investors, and crypto enthusiasts. He enjoys deep dives into emerging Web3 tren



