Technical Tuesday – Wisely and slowly

In brief
- The cryptocurrency markets were mixed as the prices of BTC has been flip-flopping within a narrow range.
- Data shows that the current short-term consolidation could be a good setup for a further rise in BTC prices.
- ETH bulls look tired as 250 remained a significant resistance, while LTC, TRX, and KNC in focus.
Market overview
The cryptocurrency markets were a mixed bag on Tuesday Asia morning as the BTC prices continued its sideways trading below the USD10000 mark, changing hands near the 9700 handles while BCH and XRP were slightly in the green.
The fact that BTC’s short-term indecision may able to support a price appreciation in the coming weeks. A survey from Sentix shows that the Bitcoin Overconfidence Index has decelerated, which could explain why BTC bulls seem to have slowed down. However, Patrick Hussy, Managing Director at Sentix, said that while the sentiment has calmed down, the basic conviction is holding firm, and this could provide a good setup for a further rise in the price.
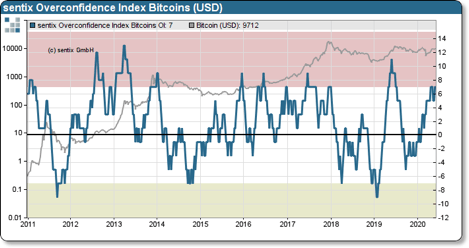
Source: Sentix
Source: Tradingview
We also expect BTC’s market dominance will back in focus, as the number seems to bottom in the 65 areas, and we may see a rebound from here. If seen, that could be evidence showing that markets’ demand for Bitcoin relative to the demand for altcoins is set to increase, and that could be something that BTC and altcoins traders keep a close eye on.
Elsewhere in the altcoin space, we believe TRX will remain in focus as we expect the news surrounding the 4.0 upgrade could remain the primary driver of the price. BAT continued its rally despite the news of the Brave browser reportedly redirected its users to the company's referral links when navigating to different platforms.
Price Analysis
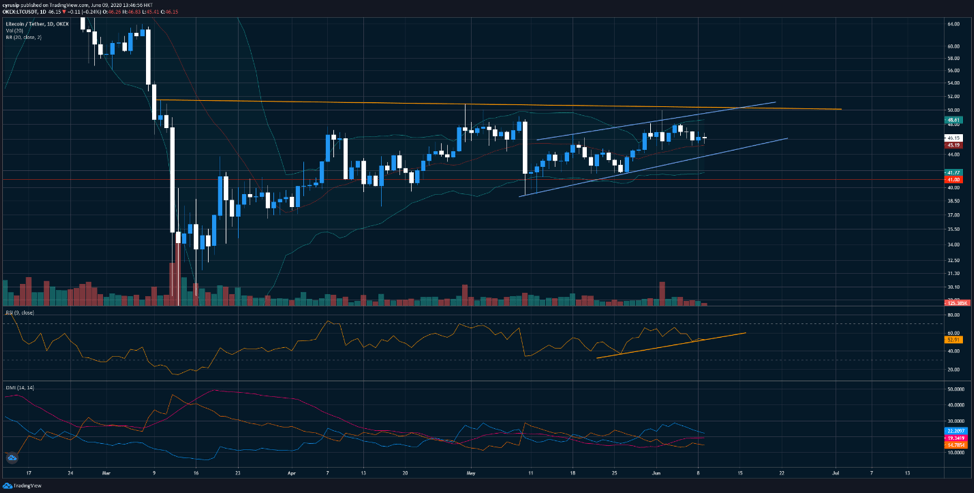
BTCUSDT – retest supports before going up?
BTCUSDT remained in a triangle formation as the price has been mostly moving sideways in the past week. We believe that the price may retest the lower support of the triangle before producing a breakout.
The RSI and the stochastic may able to support this assumption. The RSI has produced a lower high this week, which considered as a bearish divergence to the price. The stochastic also has been moving lower, despite the chance that the last line may go above the slow line —the two indicators showing that the upside momentum has been somewhat fading.
However, the ultimate oscillator has ticked up early this week. This may signal the bias of the downside could be limited.
Level-wise, the lower support of the triangle is near 9200 to 9300 levels. Anything below that could increase the downward momentum. While on the high on June 2 at 10300 could be the upper levels to watch.
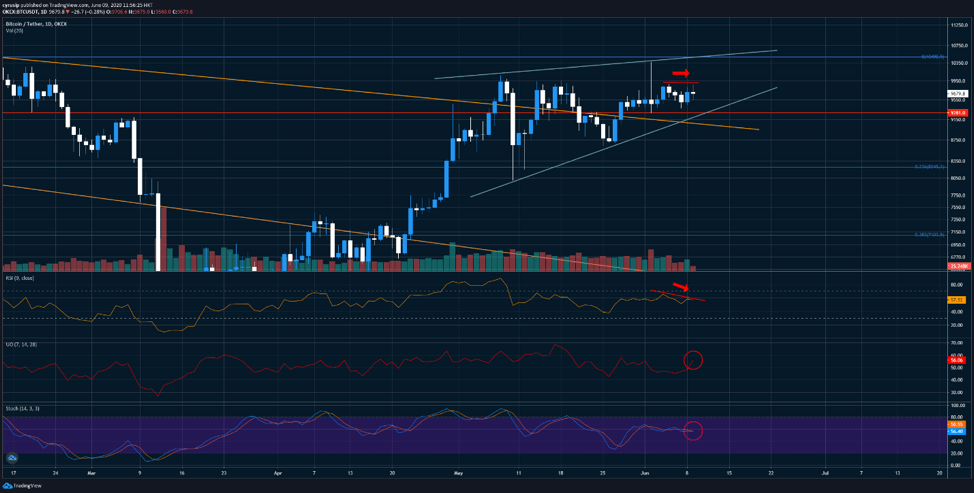
Source: OKEx; Tradingview
ETHUSDT – bulls are getting tired?
A correction could be on the way for ETHUSDT as the bulls seem to get tired, and the bears may soon takeover.
As we mentioned in our previous publications, the levels of 250 have been strong resistance for the pair. Although the pair attempted to break above such levels last week, it failed to maintain it.
We see multiple momentum indicators showing signs of slowing down, which may support the case of a short-term correction. With the MOM indicator has produced a bearish divergence, while the MACD has been narrowing.
78.6% Fibonacci retracement near 223 could be the first level to watch. If seen, that could increase the likelihood of further correction to 210 area. On the other hand, if the support at 250 levels is confirmed, that could lay the foundation for testing the February high of 288, though it seems unlikely in the short-term.
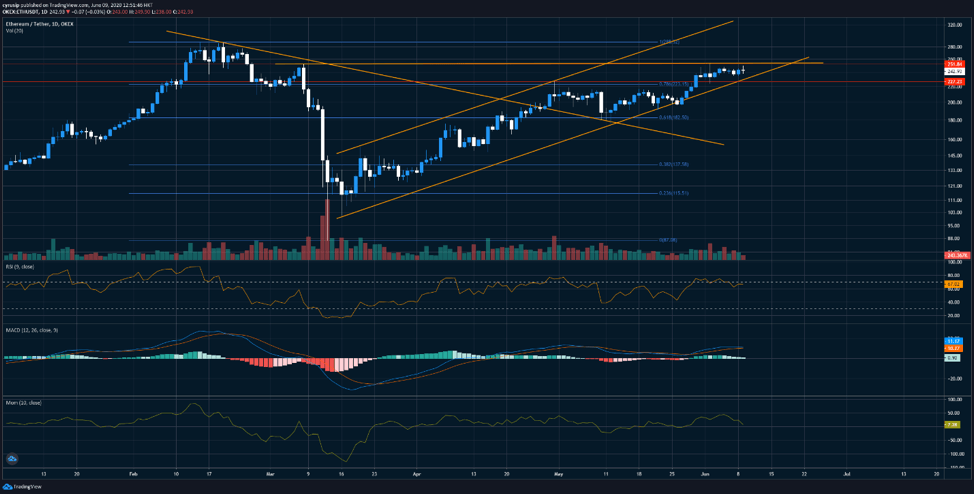
Source: OKEx; Tradingview
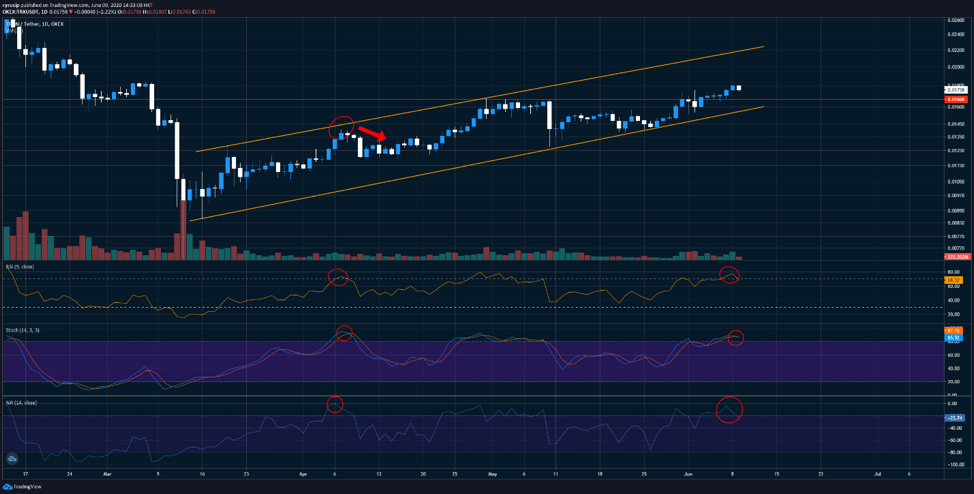
LTCUSDT – make it or break it moment?
LTCUSDT has been in sideways trading after another attempt to break the 50 levels last week, and the seventh-largest crypto may need an imminent rebound before the bears are taking over.
The pair has reached the middle line of the Bollinger bands, a crossing below the middle line could strengthen the case of having a reversal.
Also, the RSI has reached the recent channel support levels. A further down of the RSI my indicate that the positive momentum has been lowering and may not be able to support the price at current levels.
44 could be the first level to watch. If seen, a retest of 41 could become more likely.
Source: OKEx; Tradingview
TRXUSDT – correction is due?
Technical indicators suggest that TRXUSDT could remain overbought and a correction could push the price back to the lower support of the channel.
The RSI has been flirting in/near the overbought zone in the past few days. Also, the Williams %R remained over -20%. Both readings indicate that the pair has been overbought. On top of that, the stochastic has just produced a bearish crossover that also considered a bearish signal.
0.01620 could be the area to watch.
Source: OKEx; Tradingview
KNCUSDT – test the resistance-turned-support after the breakout?
KNCUSDT has been one of the best performing altcoins on the OKEx trading platform in the Tuesday session, surged more than 16%.
The jump produced a breakout from the recent triangle pattern, and also pushed the price further into the overbought zone, as the RSI and the William %R both have suggested the condition.
Although the pair may be overbought, it may not represent an imminent correction of the price. The pair may first retest the area between 0.753 to 0.757, to see if that's able to turn that from a resistance to support.
However, the trade volume may worry the bulls here, as it shows a bearish divergence to the price.
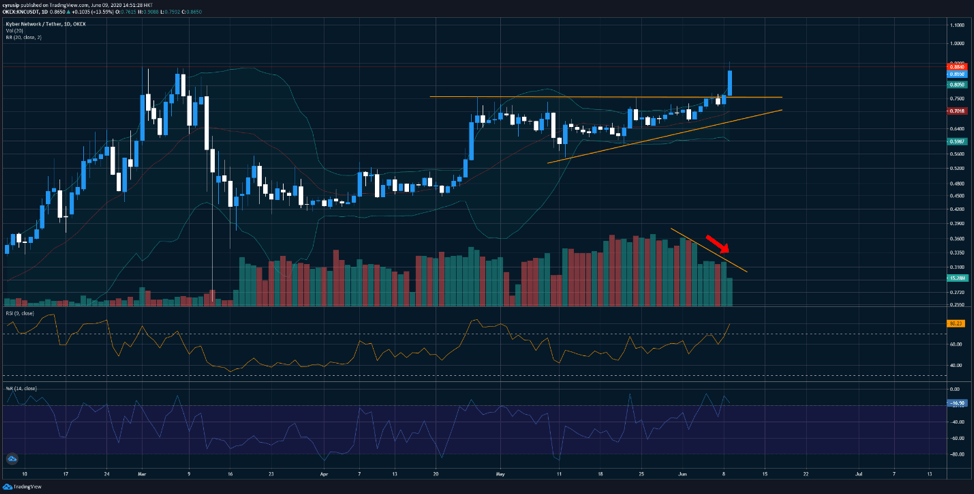
Source: OKEx; Tradingview
Author

Cyrus Ip
OKEx
Cyrus Ip has the privilege to work with OKEx as a Research Analyst, where he found some of the brightest talents in the crypto space.


