Sui Price Forecast: Technical breakout aims for $4.00, supported by TVL growth
- Sui extends its breakout above the descending channel and reclaims the 100-day EMA at $3.07 as support.
- Sui’s DeFi Total Value Locked nears the $2 billion mark, indicating rising investor confidence.
- Sui Open Interest and volume continue to increase, adding to the bullish outlook.

Sui (SUI) surges over 5% and trades at around $3.21 on Thursday, buoyed by steady investor interest in the broader cryptocurrency market and a robust Decentralized Finance (DeFi) ecosystem.
Sui’s DeFi TVL approaching $2 billion
Interest in the high-performance Layer-1 blockchain protocol, designed to provide a scalable platform for decentralized applications (dApps), has been steadily increasing. According to DefiLlama data, the Total Value Locked (TVL), which represents the value of all tokens held in smart contracts across all protocols on the network, stands at $1.95 billion.
The increase in TVL from $1.54 billion on May 23 indicates growing investor confidence in SUI. At the same, it has a positive impact on the price of Sui, as tokens held in smart contracts tend to reduce the potential selling pressure on exchanges.
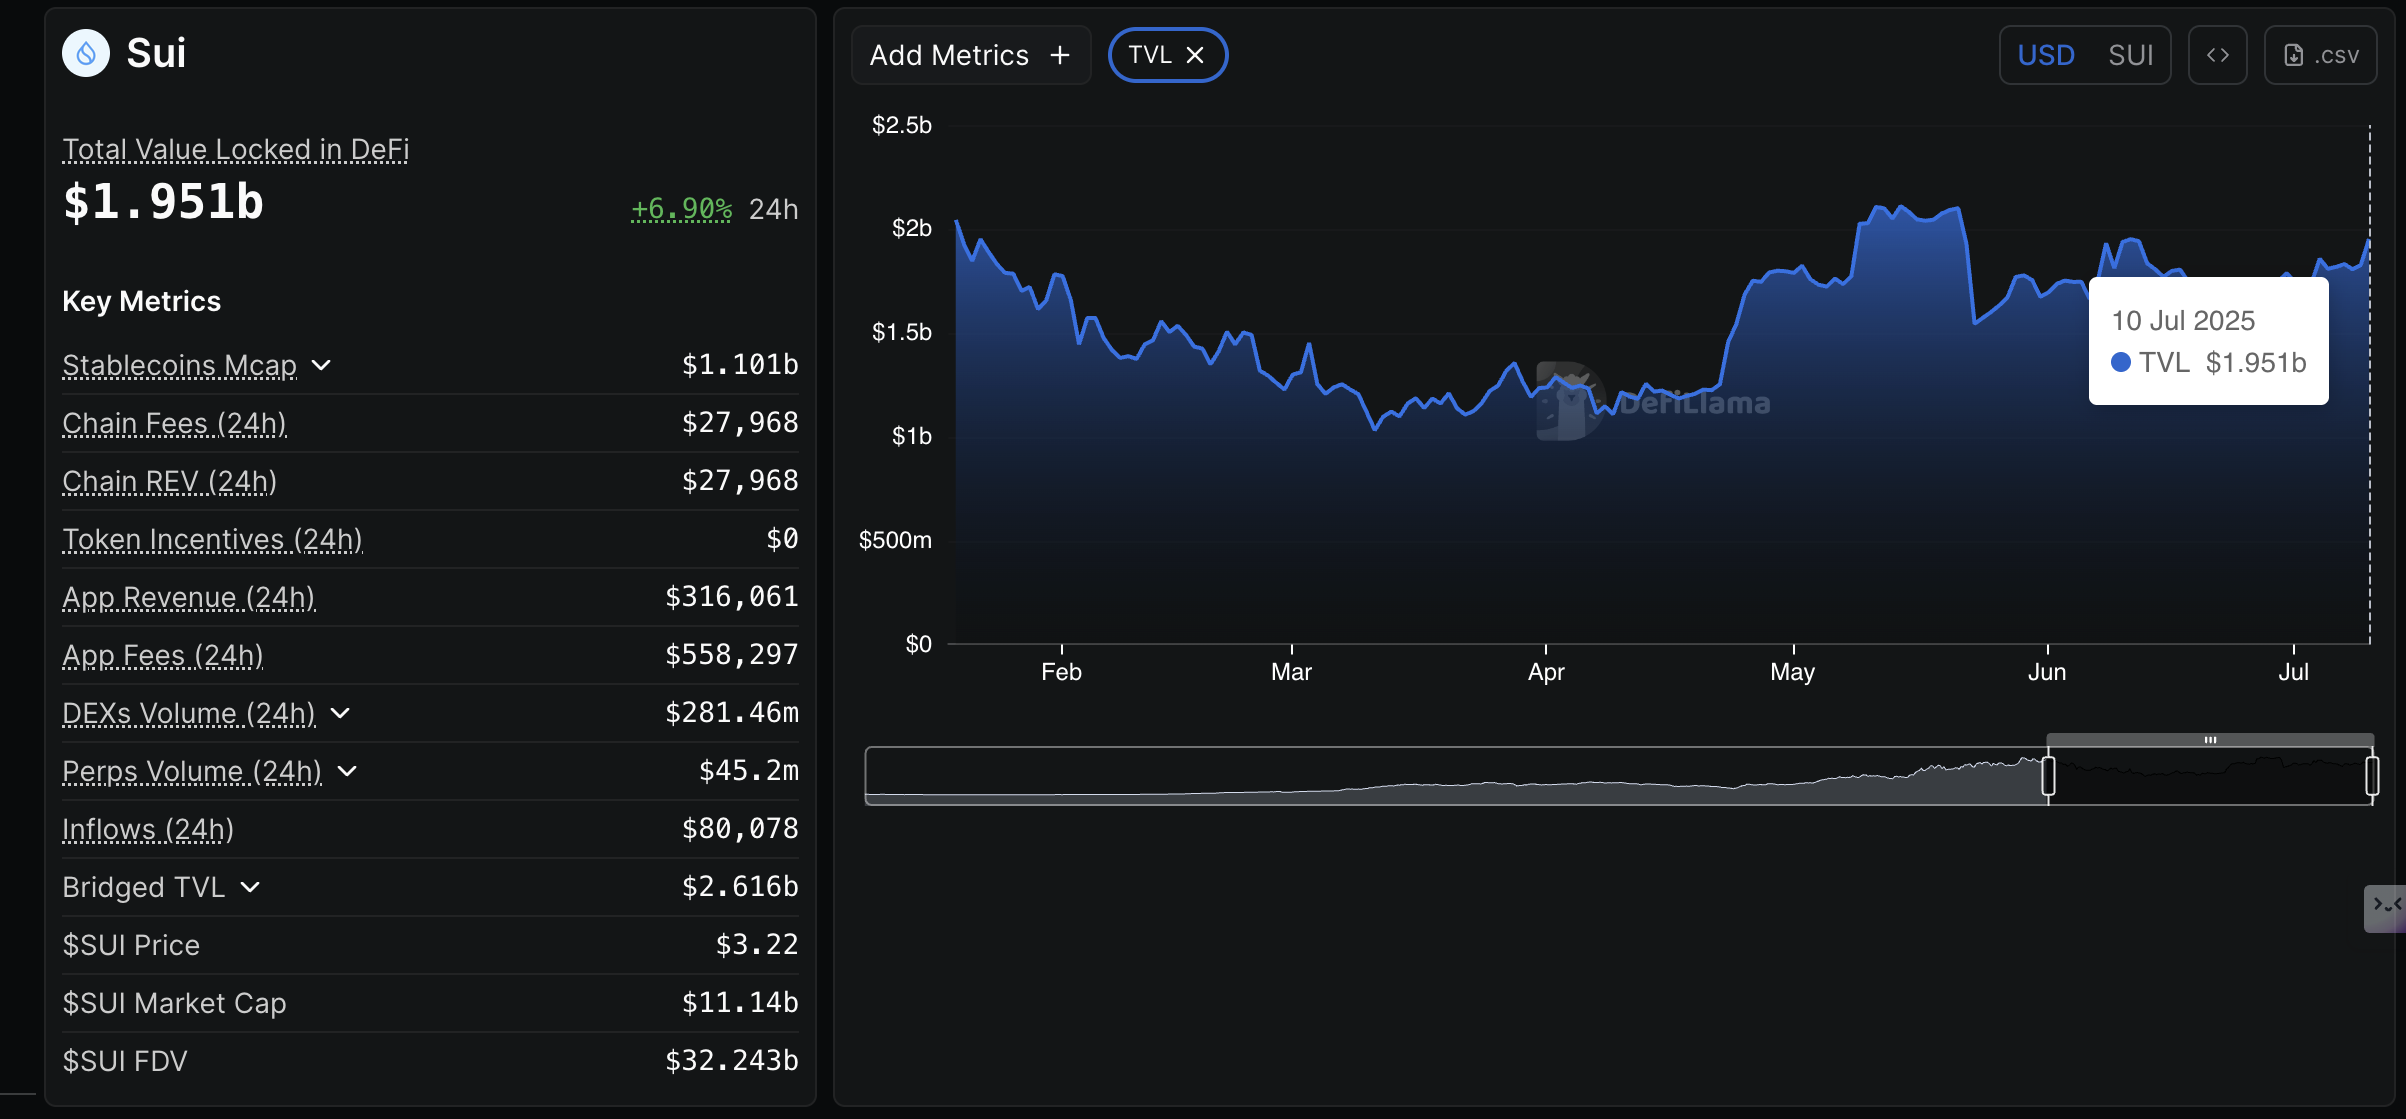
Sui DeFi TVL data | Source: DefiLlama
The derivatives market has also steadied in the last few weeks, as evidenced by a 14% increase in the Open Interest (OI) to $1.45 billion over the past 24 hours. A subsequent rise in trading volume by 74% to $5.43 billion underpins the surge in risk-on sentiment as traders bet more on future price increases.
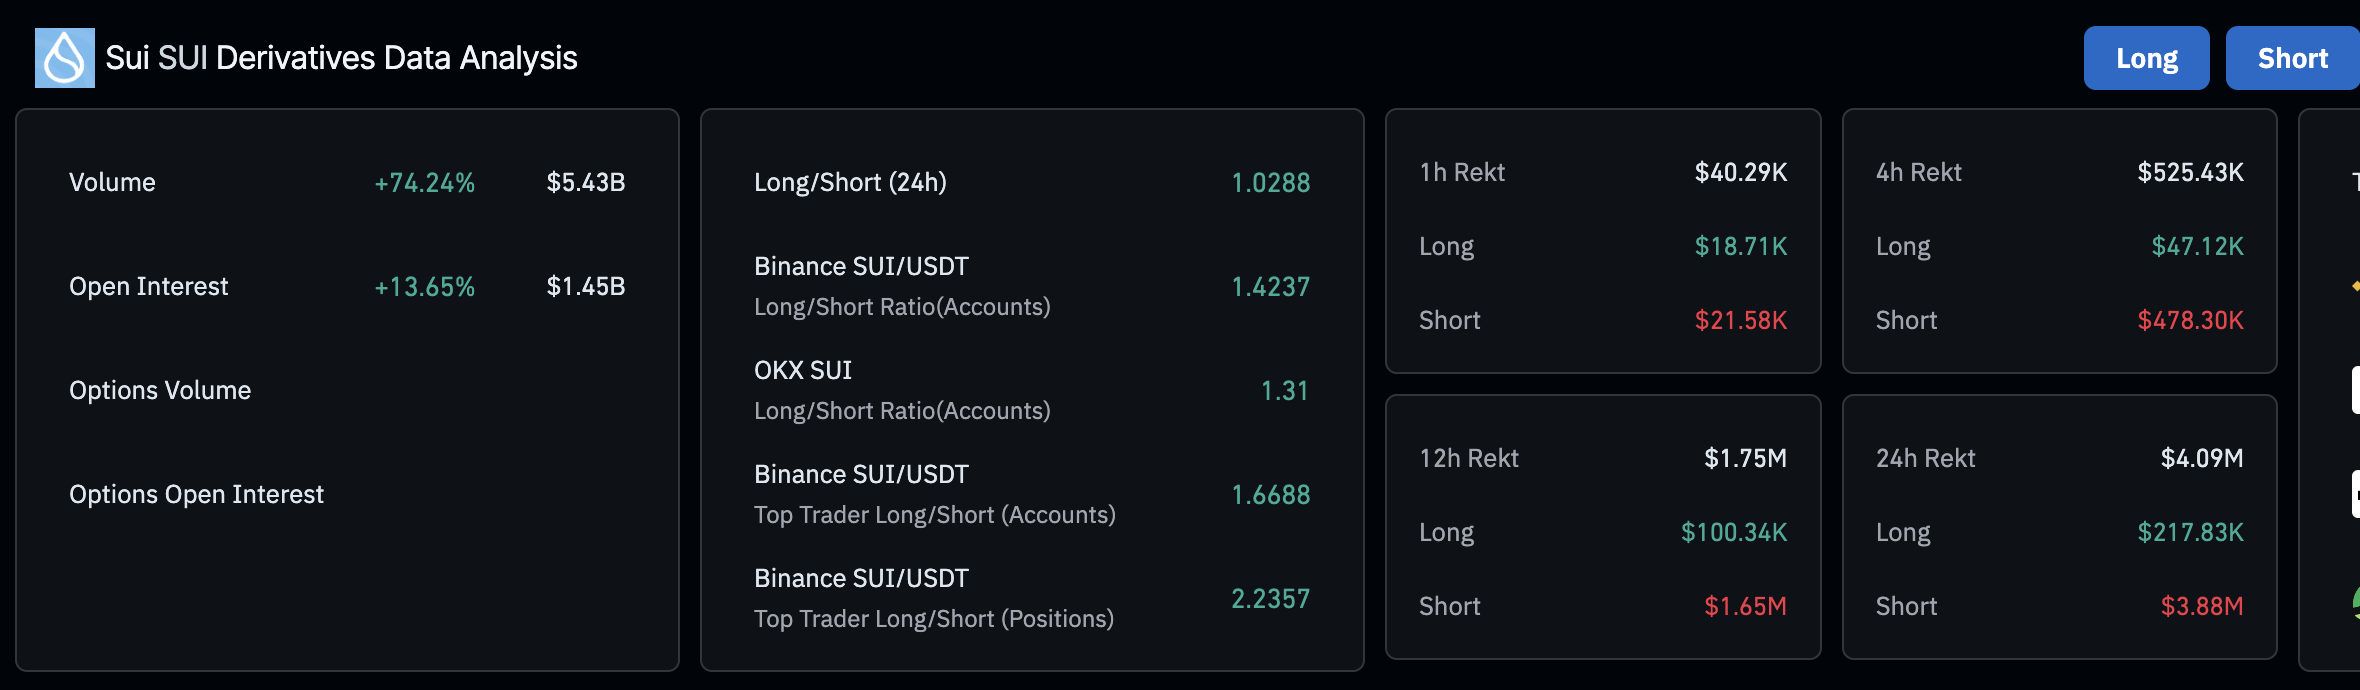
Sui derivatives market data | Source: CoinGlass
CoinGlass data highlights a positive long-to-short ratio of 1.0288, indicating a stronger bullish bias. Liquidations swelled to $4 billion in the past 24 hours, impacting short position traders more significantly, with $3.88 million wiped out, compared to approximately $217 million in long positions.
Technical outlook: Sui gains bullish momentum
Sui is largely in bullish hands, having accelerated the breakout from the descending channel, marking the third consecutive day of gains. The token currently sits above key moving averages, including the 200-day Exponential Moving Average (EMA) at $3.00, the 50-day EMA any $3.02 and the 100-day EMA at $3.07. All of which could provide support if the uptrend snaps, resulting in a sharp pullback.
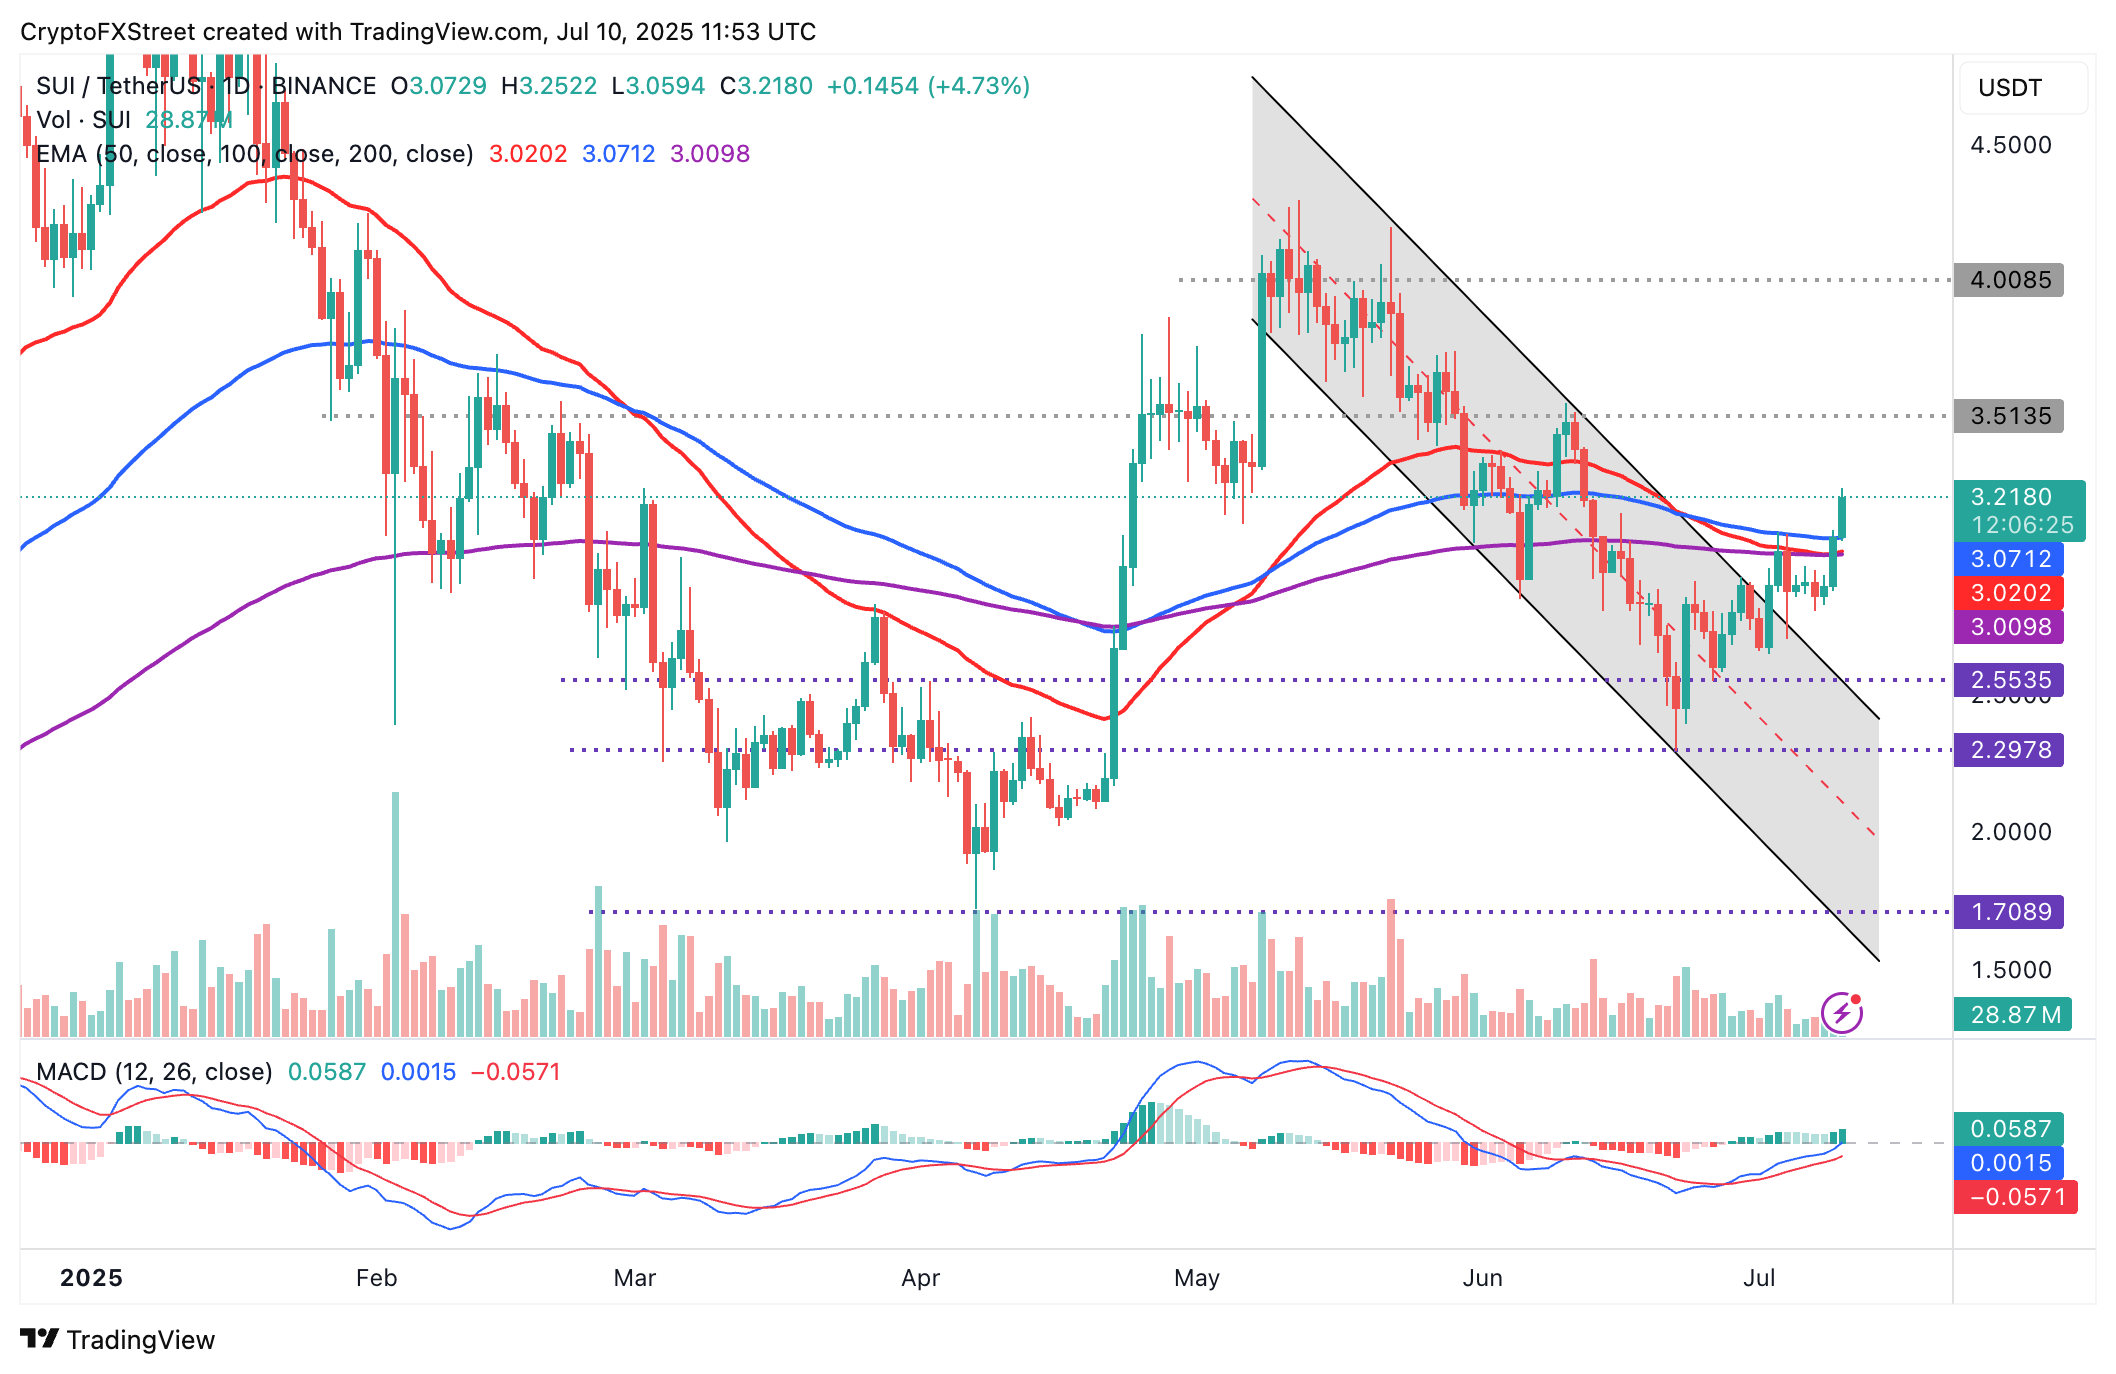
SUI/USDT daily chart
Still, traders should temper their bearish expectations, particularly because the Moving Average Convergence Divergence (MACD) indicator continues to uphold a buy signal triggered on June 28. This bullish outlook tends to catalyze risk-on sentiment, encouraging investors to seek exposure.
Key levels to monitor as Sui edges higher include the supply level at $3.50, last tested as resistance on June 11 and the round-figure seller congestion zone at around $4.00.
Open Interest, funding rate FAQs
Higher Open Interest is associated with higher liquidity and new capital inflow to the market. This is considered the equivalent of increase in efficiency and the ongoing trend continues. When Open Interest decreases, it is considered a sign of liquidation in the market, investors are leaving and the overall demand for an asset is on a decline, fueling a bearish sentiment among investors.
Funding fees bridge the difference between spot prices and prices of futures contracts of an asset by increasing liquidation risks faced by traders. A consistently high and positive funding rate implies there is a bullish sentiment among market participants and there is an expectation of a price hike. A consistently negative funding rate for an asset implies a bearish sentiment, indicating that traders expect the cryptocurrency’s price to fall and a bearish trend reversal is likely to occur.
Author

John Isige
FXStreet
John Isige is a seasoned cryptocurrency journalist and markets analyst committed to delivering high-quality, actionable insights tailored to traders, investors, and crypto enthusiasts. He enjoys deep dives into emerging Web3 tren


