Stellar Price Prediction: XLM technicals point to a 40% rally
- Stellar price has traded sideways for the last month and is searching for a catalyst.
- 3.618 Fibonacci extension level of the 2019-2020 bear market is the first profit target for a channel breakout.
- Key moving averages remain in an uptrend.

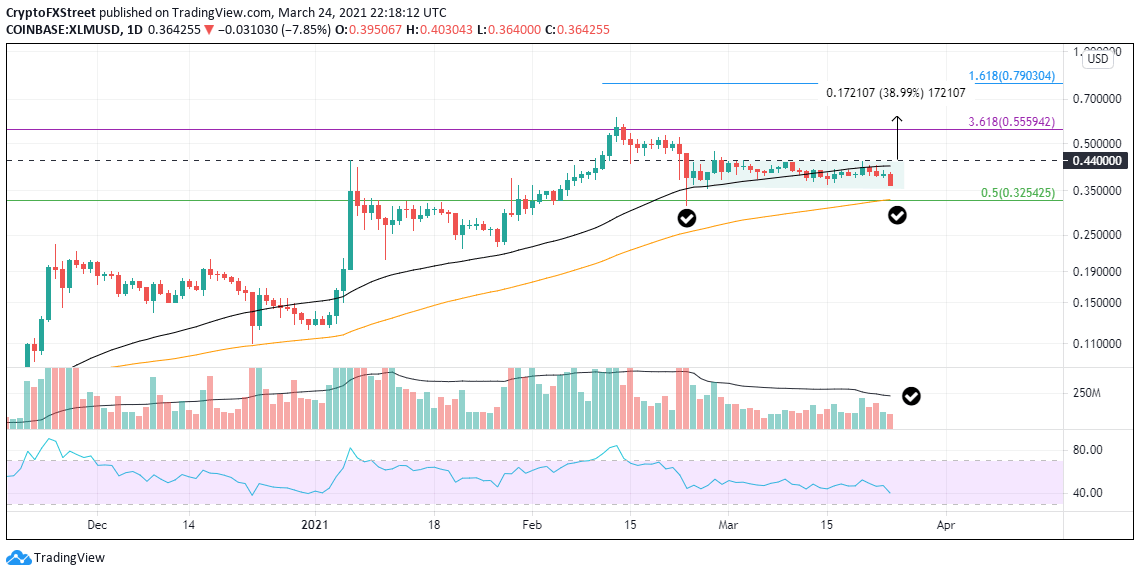
Stellar price has traded in a tight sideways channel since the 50% crash in February, just below the January 6 high at $0.44 and around the 50-day simple moving average (SMA). Traders remain as reluctant today as they were a month ago, setting the backdrop for an impulsive move.
Stellar price correcting in time, not price
XLM is searching for a catalyst, and the upcoming Bitcoin option expiration on Friday might just be the anecdote to solving the sideways channel. The daily volume figures are not showing any distribution during the channel as the daily average volume has fallen by almost half, from 630 million to 230 million over the last month.
Since the current channel follows a long and powerful gain, the key moving averages remain in an uptrend, volume does not show distribution, and the Relative Strength Index (RSI) is no longer overbought, it is timely to examine the resistance and price targets for an upside breakout.
A daily close above the upper channel line at $0.440 will put XLM on course to test the 3.618 Fibonacci extension level of the May 2019–May 2020 bear market at $0.555 and then the all-time high at $0.608, representing a 40% gain from the breakout.
An overly ambitious price target is the 1.618 Fibonacci extension of the February bear market at $0.790.
XLM/USD daily chart
Of course, the Stellar price channel could break to the downside, but the risk is contained to a 9% decline due to imposing support at the intersection of the 100-day SMA, the 0.50 retracement level of the 2019-2020 bear market, and the February 23 low around $0.320.
There is an old saying traders should remember; 'be beware of the shakeout before the breakout.'
Author

Sheldon McIntyre, CMT
Independent Analyst
Sheldon has 24 years of investment experience holding various positions in companies based in the United States and Chile. His core competencies include BRIC and G-10 equity markets, swing and position trading and technical analysis.


