Stellar and ApeCoin Price Prediction: XLM and APE at risk of further losses as technical weakness grows
- Stellar price closes below its critical support at $0.2537, hinting at a correction ahead.
- ApeCoin touches the lower boundary of an ascending triangle formation, a breakdown would signal a downtrend.
- Momentum indicators for both altcoins show weakness, further supporting the bearish thesis.

Stellar (XLM) and ApeCoin (APE) are showing signs of weakness as both altcoins struggle to hold above key support levels. XLM slips below its crucial support at $0.2537, raising the risk of a deeper correction. Meanwhile, APE is breaking below the lower boundary of an ascending triangle formation, a breakdown would signal a downtrend. Momentum indicators for both tokens are weakening, suggesting that bearish momentum is gaining traction and hinting at a downleg ahead.
Stellar Price Prediction: XLM is poised for a downleg as it closed below key support
Stellar price failed to close above the descending trendline on June 11 and declined by nearly 8% over the next three days, finding a cushion at the daily support level of $0.2537 over the weekend. However, XLM closed below this support level on Tuesday. At the time of writing on Wednesday, it trades at $0.2519, below the key support.
If XLM continues its correction, it could extend the decline to retest the April 16 low of $0.2306.
The Relative Strength Index (RSI) on the daily chart reads 37, indicating strong bearish momentum and approaching oversold conditions. Additionally, the Moving Average Convergence Divergence (MACD) indicator on the daily chart displayed a bearish crossover last week. It also shows rising red histogram bars below its neutral level, indicating bearish momentum and suggesting a downward trend.
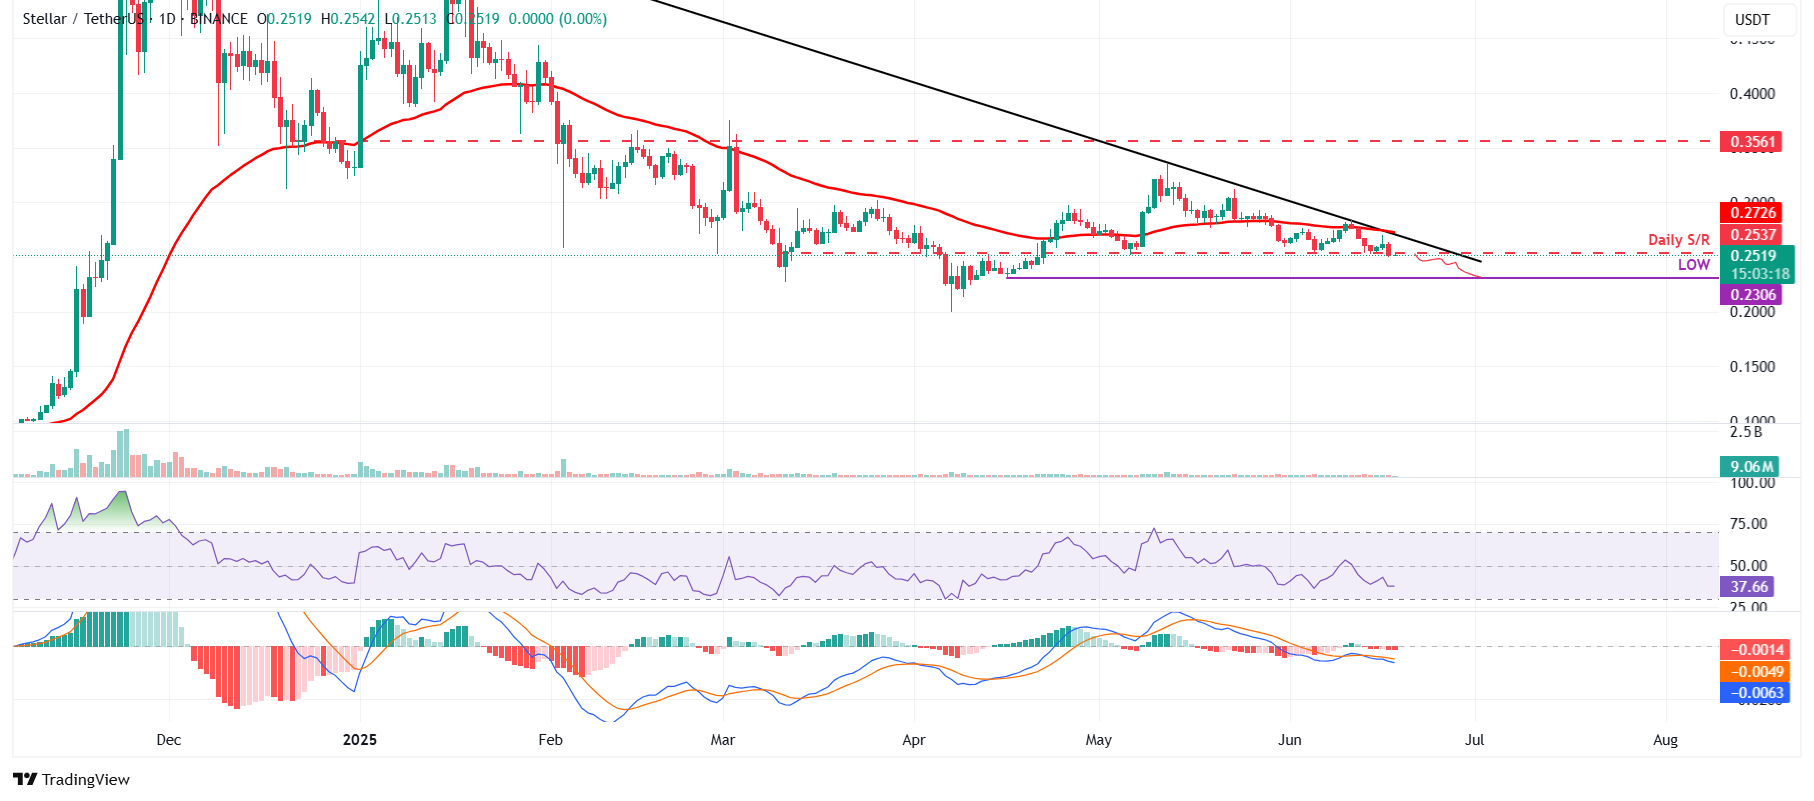
XLM/USDT daily chart
However, if XLM recovers, it could extend toward the 50-day Exponential Moving Average (EMA) at $0.2726.
ApeCoin Price Prediction: APE on the verge of a breakdown
ApeCoin price has produced multiple higher lows and roughly equal highs since early February. Connecting these swing points using a trend line reveals an ascending triangle formation in the daily chart. The breakdown of this pattern supports a bearish bias, and the target is typically determined by measuring the distance between the first swing high and the first swing low to the breakdown point. At the time of writing on Wednesday, APE is nearly its lower boundary of this chart pattern, around $0.64.
If APE breaks below the lower boundary of this pattern at around $0.64, it could extend the rally toward its technical target of $0.24. Investors should be cautious of this theoretical move, as any downside move could encounter support around key levels, such as $0.59, $0.46 and $0.34, where traders could book some profits.
The RSI on the daily chart reads 45, below its neutral level of 50, indicating increasing bearish momentum. Moreover, the MACD indicator also displayed a bearish crossover last week. It also shows rising red histogram bars below its neutral level, indicating bearish momentum and suggesting a downward trend.
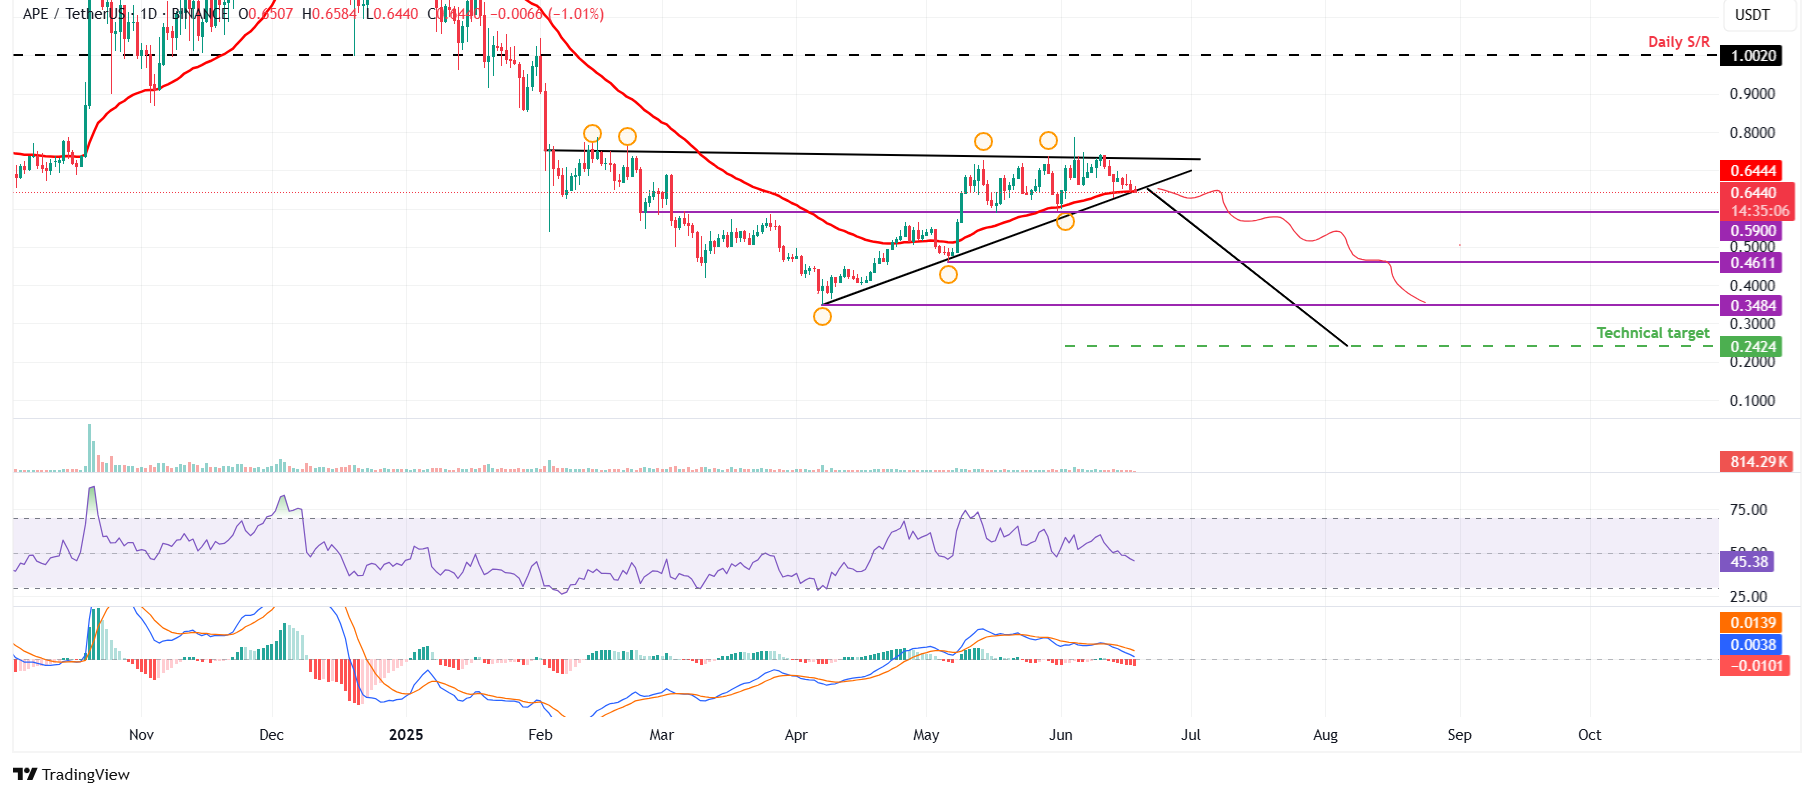
APE/USDT daily chart
However, if APE recovers, it could extend the recovery toward its upper boundary of the pattern around $0.72.
Author

Manish Chhetri
FXStreet
Manish Chhetri is a crypto specialist with over four years of experience in the cryptocurrency industry.


