Stablecoin activity drops after May peak

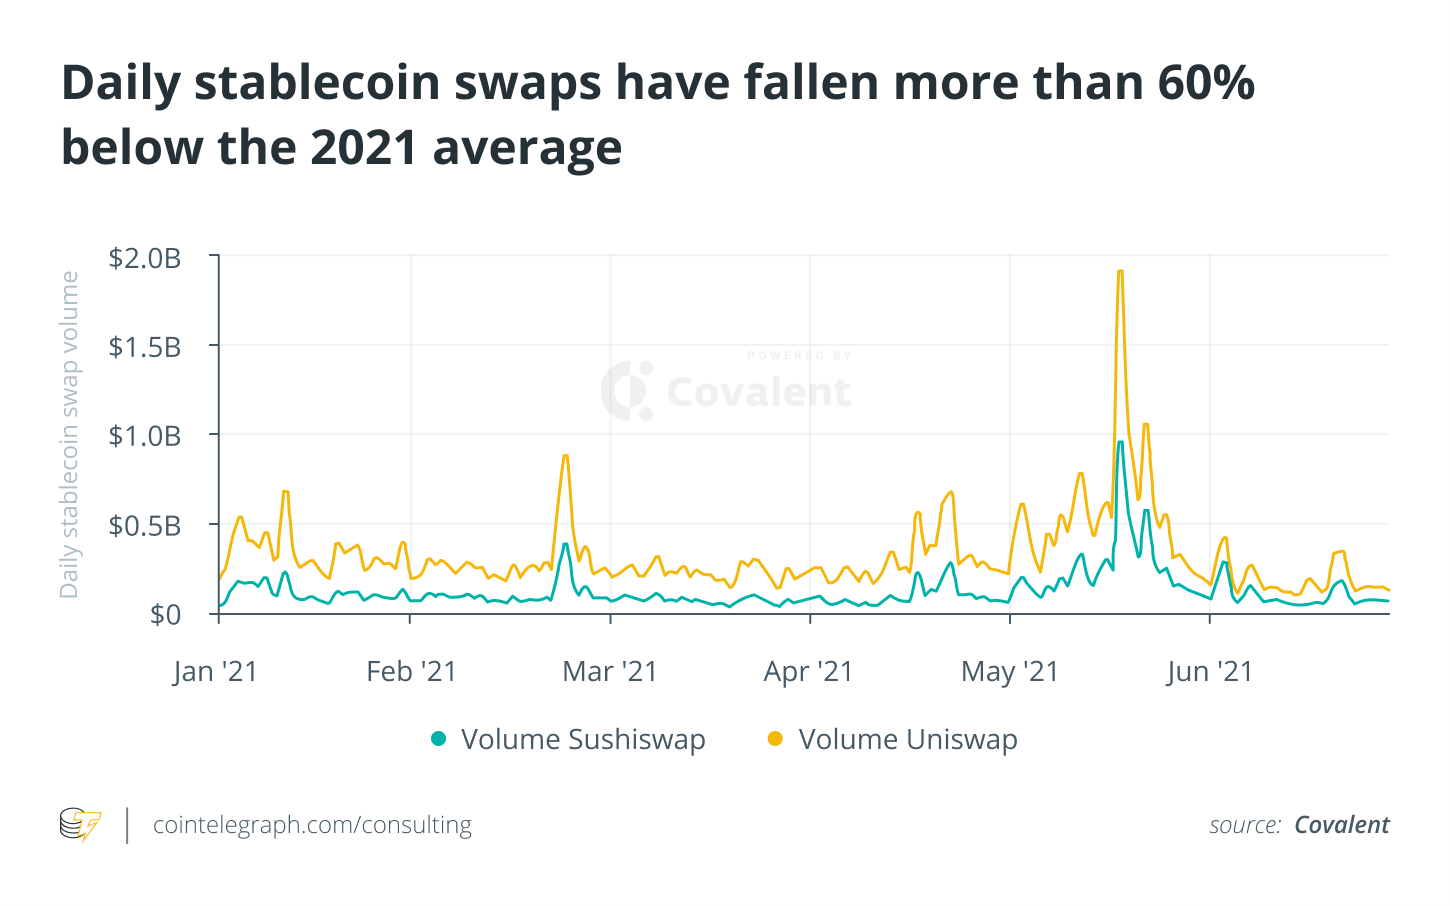
Stablecoin usage lost steam amid the recent crypto market downturn. From peaking at nearly $2 billion on May 19, the daily transaction volume has fallen off its 2021 average by about 60%. The significant drop begs the question about stablecoin activity in the current market environment.
Unsurprisingly, the two cryptocurrencies that remain in a tight race for stablecoin dominance are Tether (USDT) and USD Coin (USDC). However, the market holds a fine distinction between the two, particularly with their corresponding reserve holding.
Credit rating agency Fitch Ratings even warned recently about Tether's risk triggering a destabilization in short-term credit markets, since its reserves are not all in cash. On the other hand, Fitch cites USDC as an example of a fully backed safe asset since it keeps the United States dollars on a one-to-one basis in custody accounts.
Stablecoin analysis
Still, users flock to Tether for a number of purposes. Data from Covalent reveals that Tether exceeded the total transactions of USDC by at least 500,000. USDT had 2.9 million total transactions from January to June while USDC had 2.4 million. But in terms of dollar volume, USDC beats Tether, $21.4 billion to $19.3 billion, respectively.
Moreover, there are some signs of institutional avoidance of Tether. Rather, institutional users seem to prefer using MakerDAO’s DAI, even though USDT has exceeded DAI’s total number of transactions and total trading volume by a long shot.
Data from Covalent shows that DAI's average transaction value was $50,000 at its peak in May, which was the highest swap value of all stablecoins. With this record, DAI also outperforms other stablecoins by average swap size, hitting around $10,900. In contrast, Tether seems to be the top choice of smaller retail accounts, with its average transaction value of $6,600.
One more outlier is TerraUSD (UST), another U.S. dollar stablecoin that pales in comparison to Tether and USDC's volume, but outshines the two, much like DAI, in average transaction value. UST averages $10,660 per swap, denoting the preference of bigger accounts for this stablecoin.
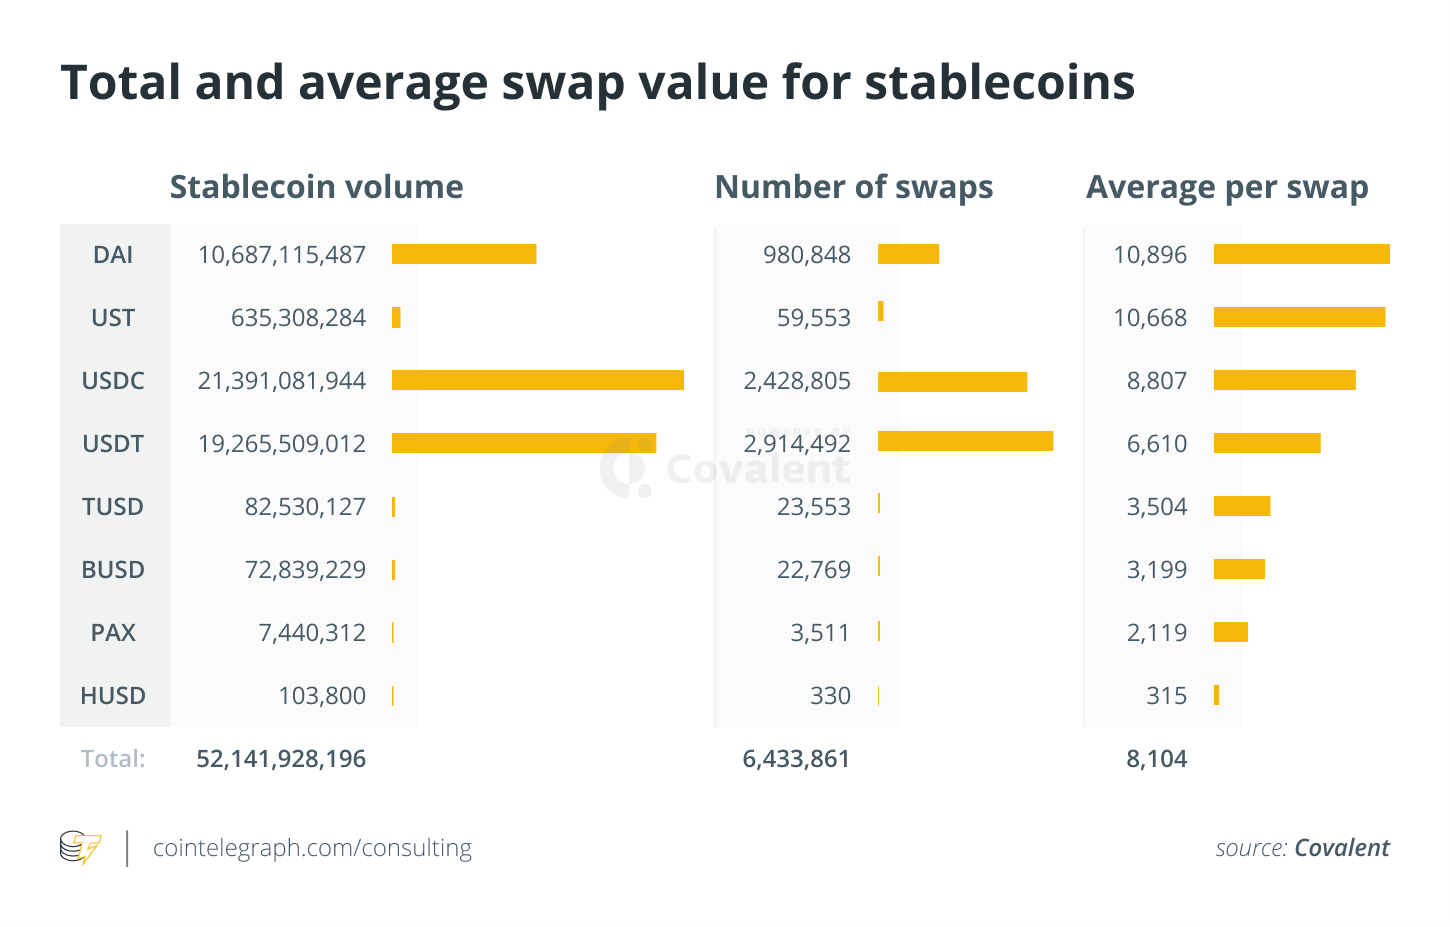
However, UST only ranks fourth among stablecoins by the number of swaps, comprising just 2% of the swaps facilitated by the leader, USDT.
Among the two major stablecoins, Tether outpaces USDC by roughly 500,000 swaps. However, USDC outpaces Tether by average swap size of around 33%, which provides USD Coin an advantage by the total swap value.
Data also looks into which DEX has the most stablecoin trading volume, and the numbers point to Uniswap. The first half of the year saw Uniswap tower above the number of stablecoin transactions at SushiSwap. In January, Uniswap closed in on 1.4 million daily swaps versus SushiSwap's roughly 200,000.
Uniswap v2 powers 88% of all stablecoin swaps and still remains an enviable spot for transactions, despite the rollout of Uniswap v3 back in May. It has become evident that Uniswap is more of a go-to for stablecoin liquidity.
With an average transaction volume of several thousand dollars, Ethereum's ever-growing transaction fees do not seem to be a problem. However, as stablecoins garner mainstream adoption and the average stablecoin transaction volume decreases, users may look to more affordable stablecoin blockchains.
Cointelegraph’s Market Insights Newsletter shares our knowledge on the fundamentals that move the digital asset market. With market intelligence from one of the industry’s leading analytics providers, Covalent, the newsletter dives into the latest data on social media sentiment, on-chain metrics and derivatives.
Author

Cointelegraph Team
Cointelegraph
We are privileged enough to work with the best and brightest in Bitcoin.




