SPX6900, Pepe Price Prediction: Meme coins to watch as Bitcoin targets new all-time highs
- Pepe ticks higher for the third consecutive day, breaking out of a descending triangle pattern.
- SPX6900 edges higher by over 3%, extending Sunday's rise and pointing to an ascending triangle breakout.
- The technical outlook for the meme coins holds a bullish bias, teasing extended gains.

Meme coins Pepe (PEPE) and SPX6900 (SPX) edge higher at press time on Monday, signaling a bullish start to the week, after recovering significantly over the weekend as Bitcoin marked a record-high weekly close above $109,000.
As PEPE and SPX break out of key triangle patterns, the anticipation of an extended rally boosts optimism in the derivatives market. Further up, the technical outlook of PEPE and SPX indicates a breakout rally ready to soar.
PEPE triangle breakout fuels traders’ optimism
Pepe edges higher by over 1% at press time on Monday, extending the 3.41% surge from Sunday. The meme coin surpasses a critical resistance trendline formed by connecting the highs of May 23 and June 10. It is worth noting that the trendline formed a descending triangle pattern with base support at the $0.00000900 floor.
As Pepe exits the triangle pattern, bulls face opposition at the month-long resistance at $0.00001037, last tested on Thursday. A potential close above that level could extend PEPE’s breakout rally to $0.00001196, the May 17 low, followed by the highest price of June at $0.00001362.
The Moving Average Convergence/Divergence (MACD) indicator displays an uptrend in the MACD and signal line, still in negative territory but rising towards the zero line. Additionally, the green histogram bars rising from the reference line suggest increased buying pressure.
The Relative Strength Index (RSI) at 48 approaches the midline, indicating a shift in momentum to the neutral phase from the oversold boundary line (bearishness).
However, PEPE failing to close above $0.00001037 could retest the $0.00000900 support floor.
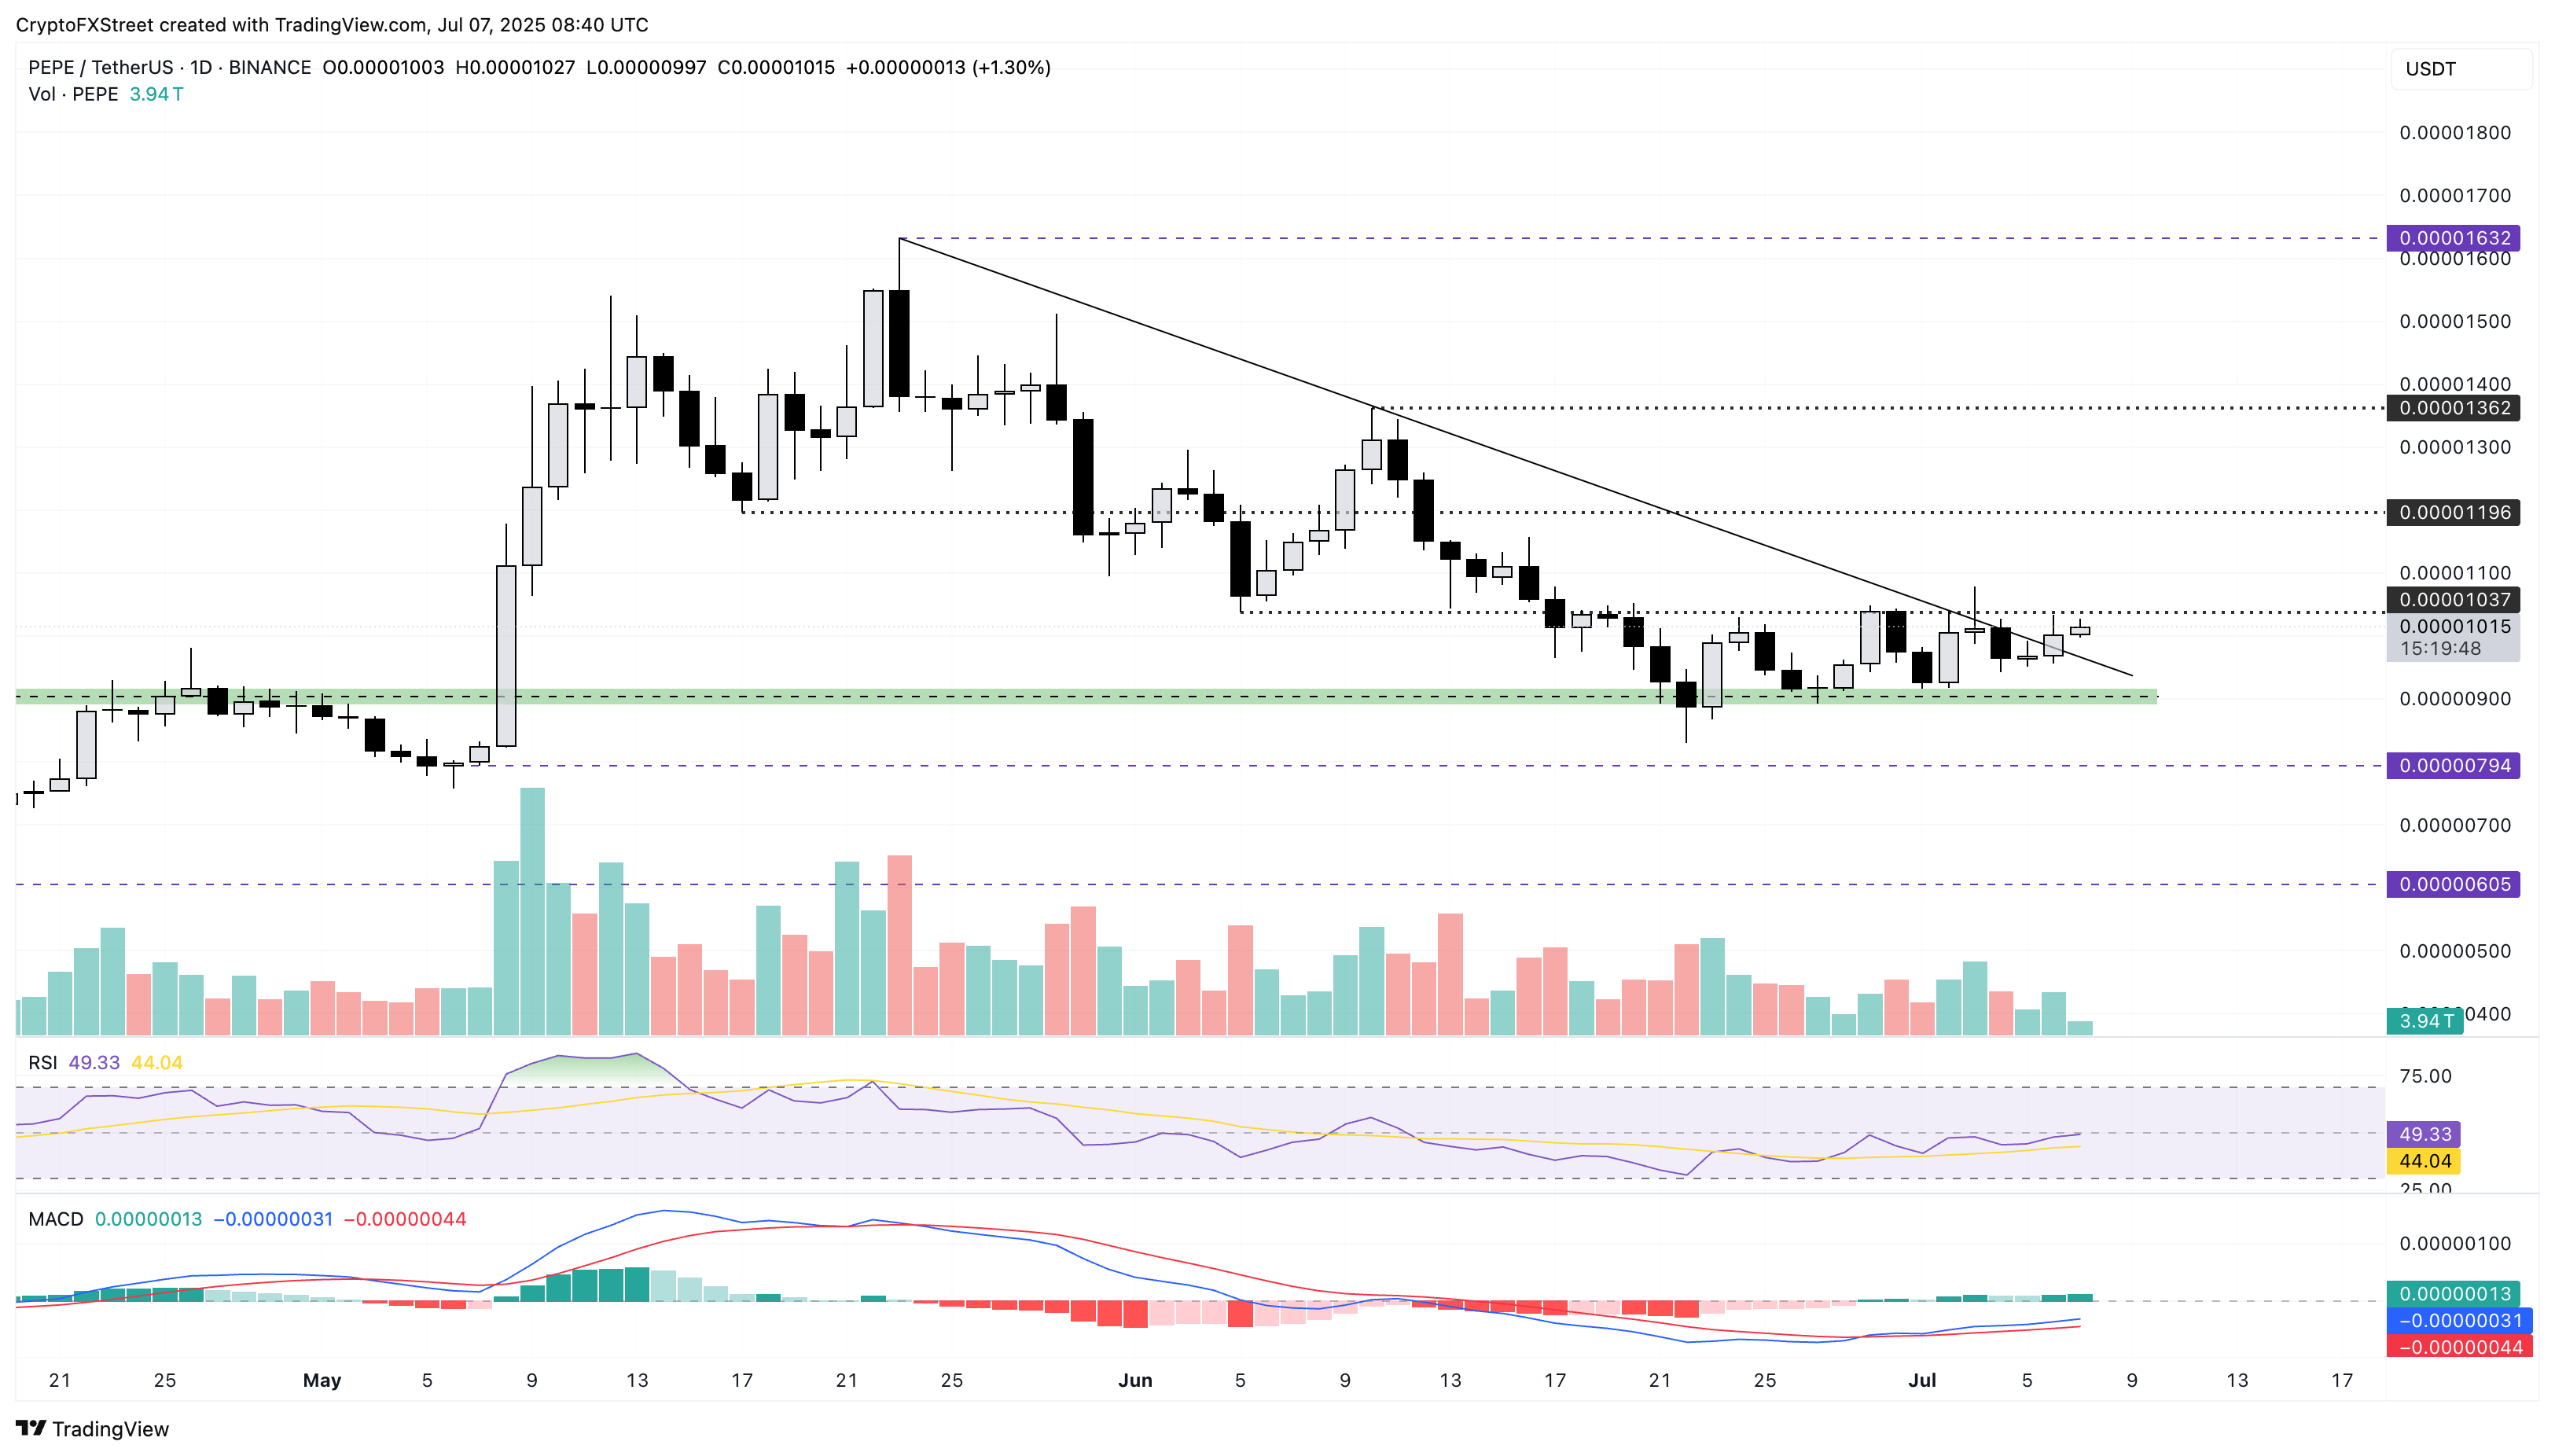
PEPE/USDT daily price chart.
Coinglass’ data adds credence to a short-term surge in optimism as Open Interest (OI) spikes by 2.25% in the last 24 hours, reaching $533.63 million. An OI surge relates to heightened buying, resulting in an increased inflow into the derivatives market.
Adding credence to the increased buying, the OI-weighted funding rate flips positive to 0.0052% on Monday from its low of -0.0052% on Sunday. The flipping suggests a shift in net traders’ activity, turning bullish as buyers are now willing to pay the premium to hold positions.

PEPE derivatives. Source: Coinglass
SPX6900 nears an ascending triangle breakout
Meme coin SPX6900 edges higher by over 3% at press time on Monday, adding gains over the 5.82% rise from Sunday. The recovery run in SPX nears the $1.36 supply zone, which has rejected the price recovery since the end of June, and forms an ascending triangle pattern coupled with a trendline connecting the June 21 and July 2 lows on the 4-hour chart shared below.
A potential daily close above $1.36 would mark the triangle pattern breakout, targeting the 78.6% Fibonacci retracement level at $1.56, drawn from the June 11 high of $1.74 to the June 21 low of $0.91.
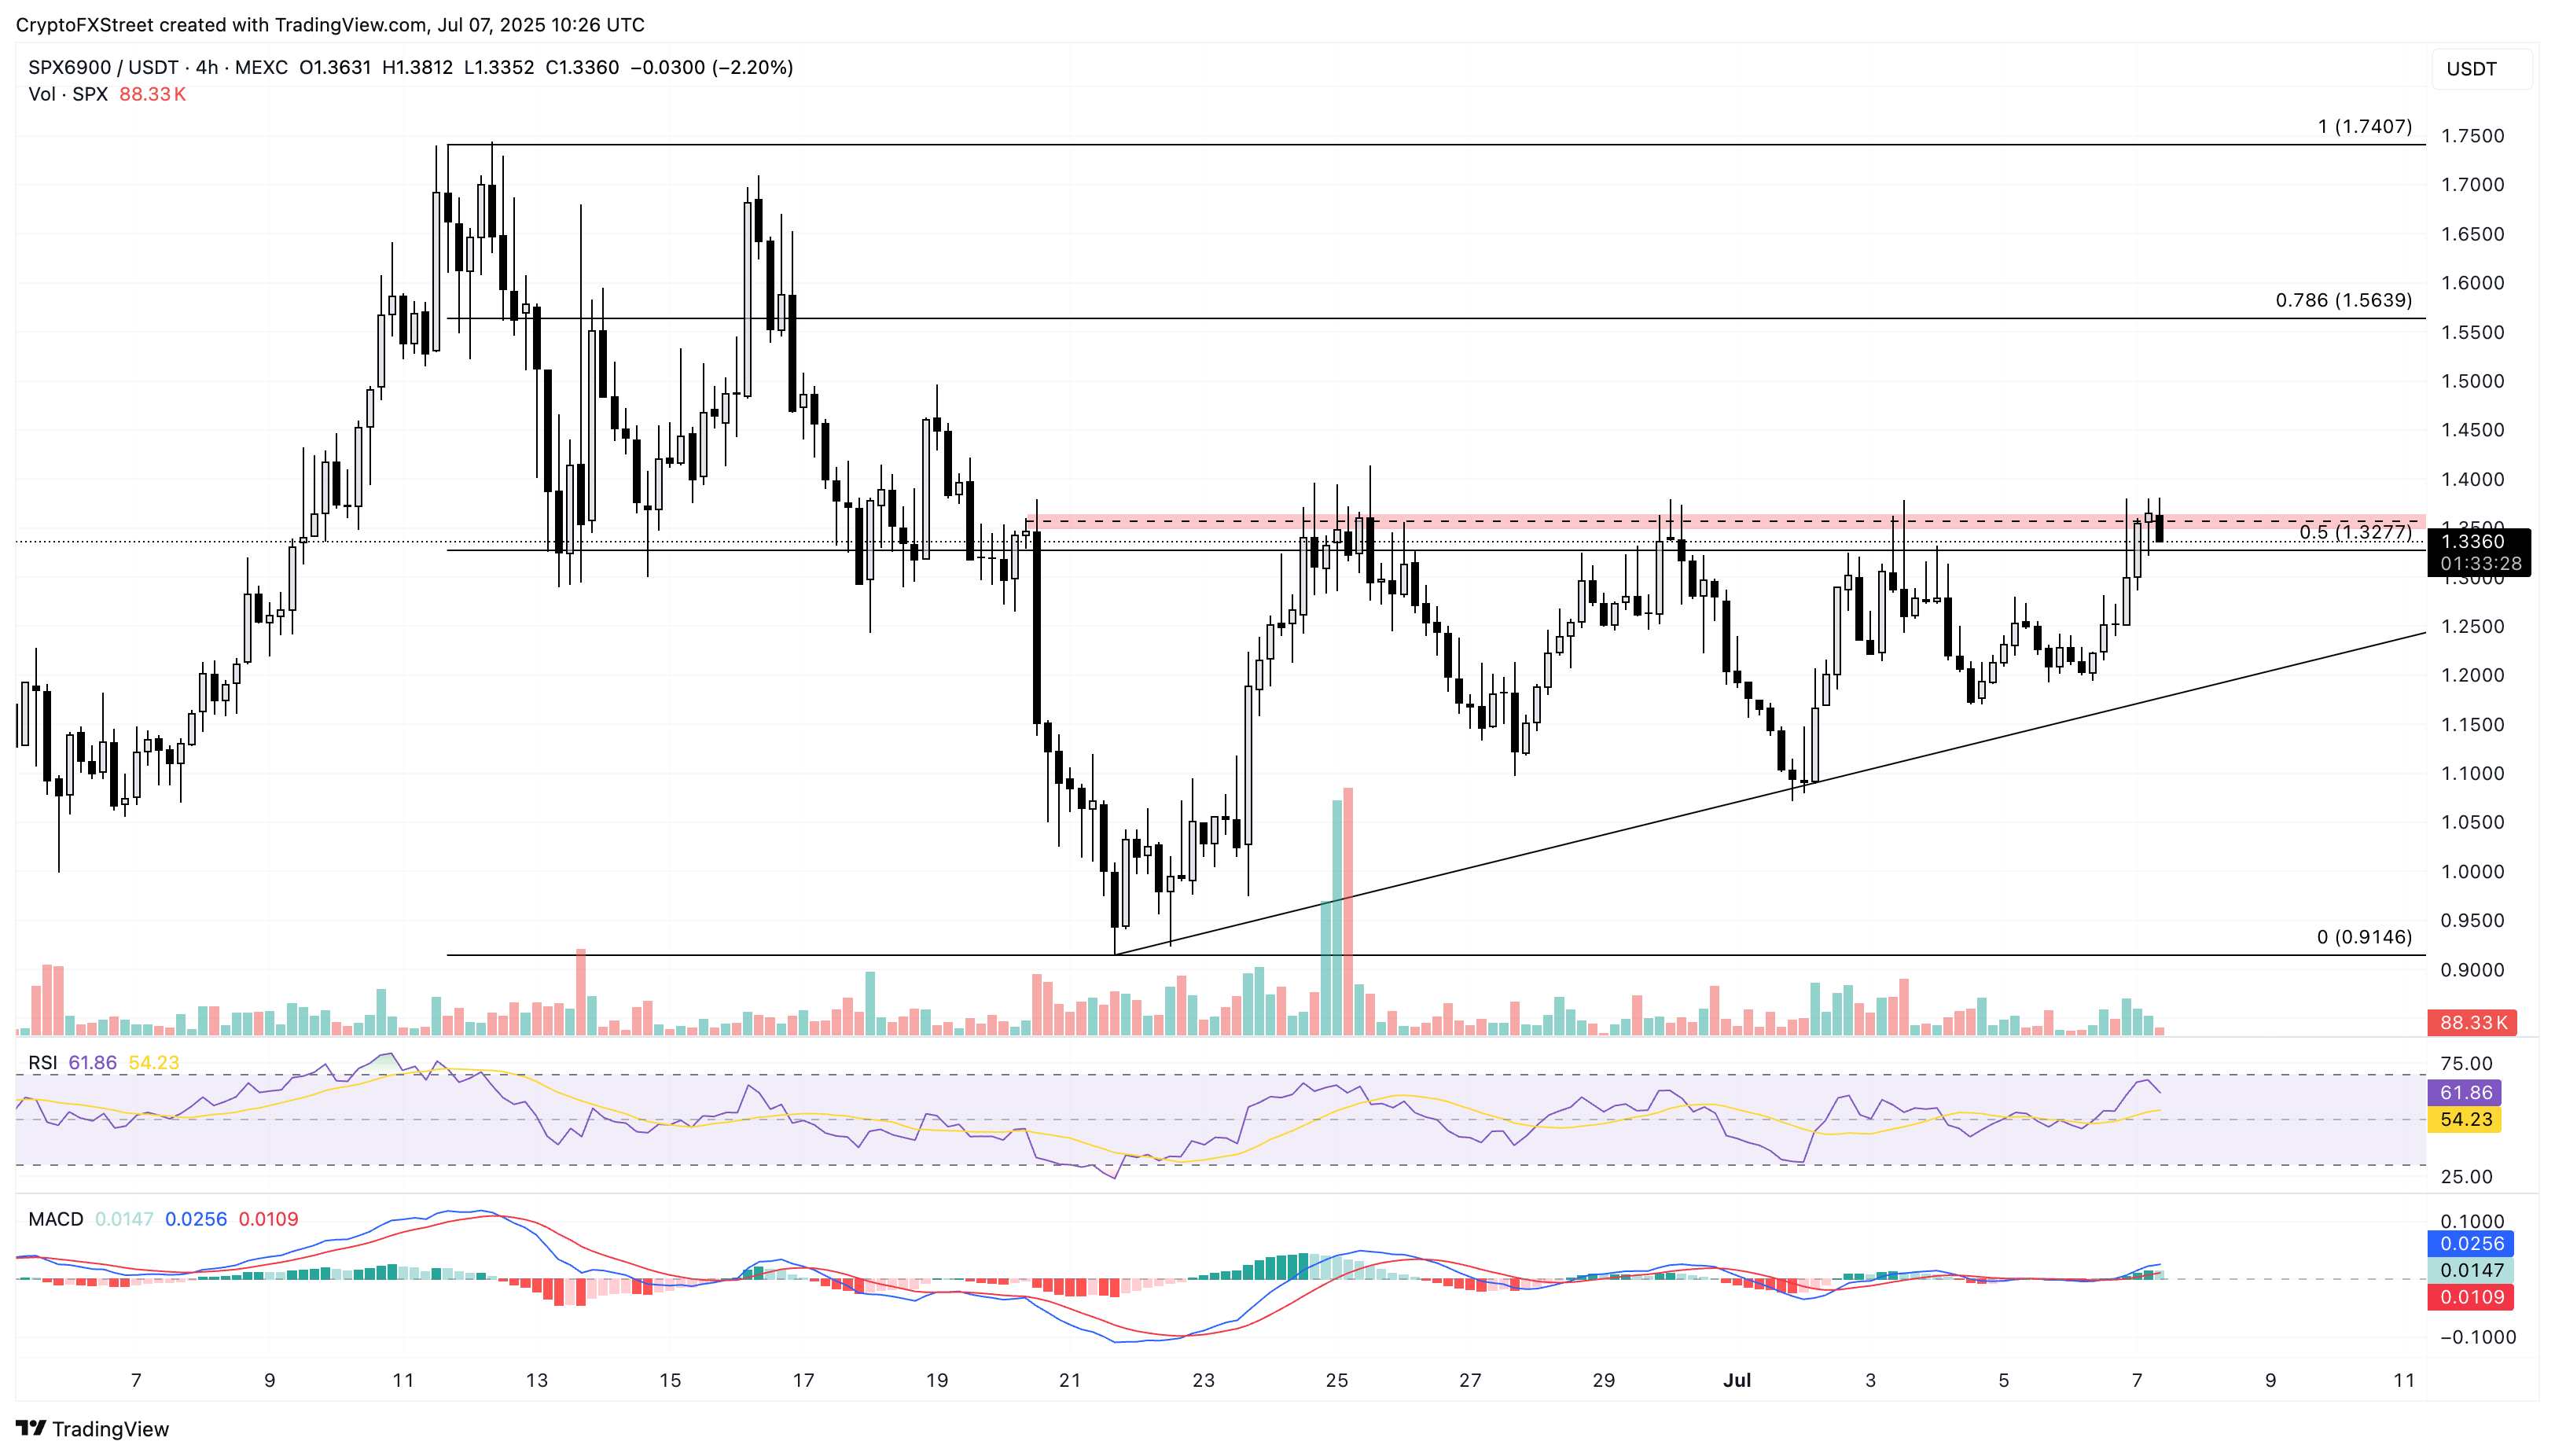
SPX/USDT daily price chart.
However, a reversal in SPX from the $1.36 supply zone could test the support trendline near $1.19.
The MACD indicator displays the MACD and signal line crossing into the positive territory. Still, the RSI line at 61 reverts from the overbought boundary zone, pointing to the downside, suggesting a decline in bullish momentum in the short term.
Coinglass data shows a 20% surge in SPX OI, reaching $142.10 million, suggesting increasing optimism among traders. The OI-weighted funding rate flips positive to 0.0066%, indicating increased buying activity.
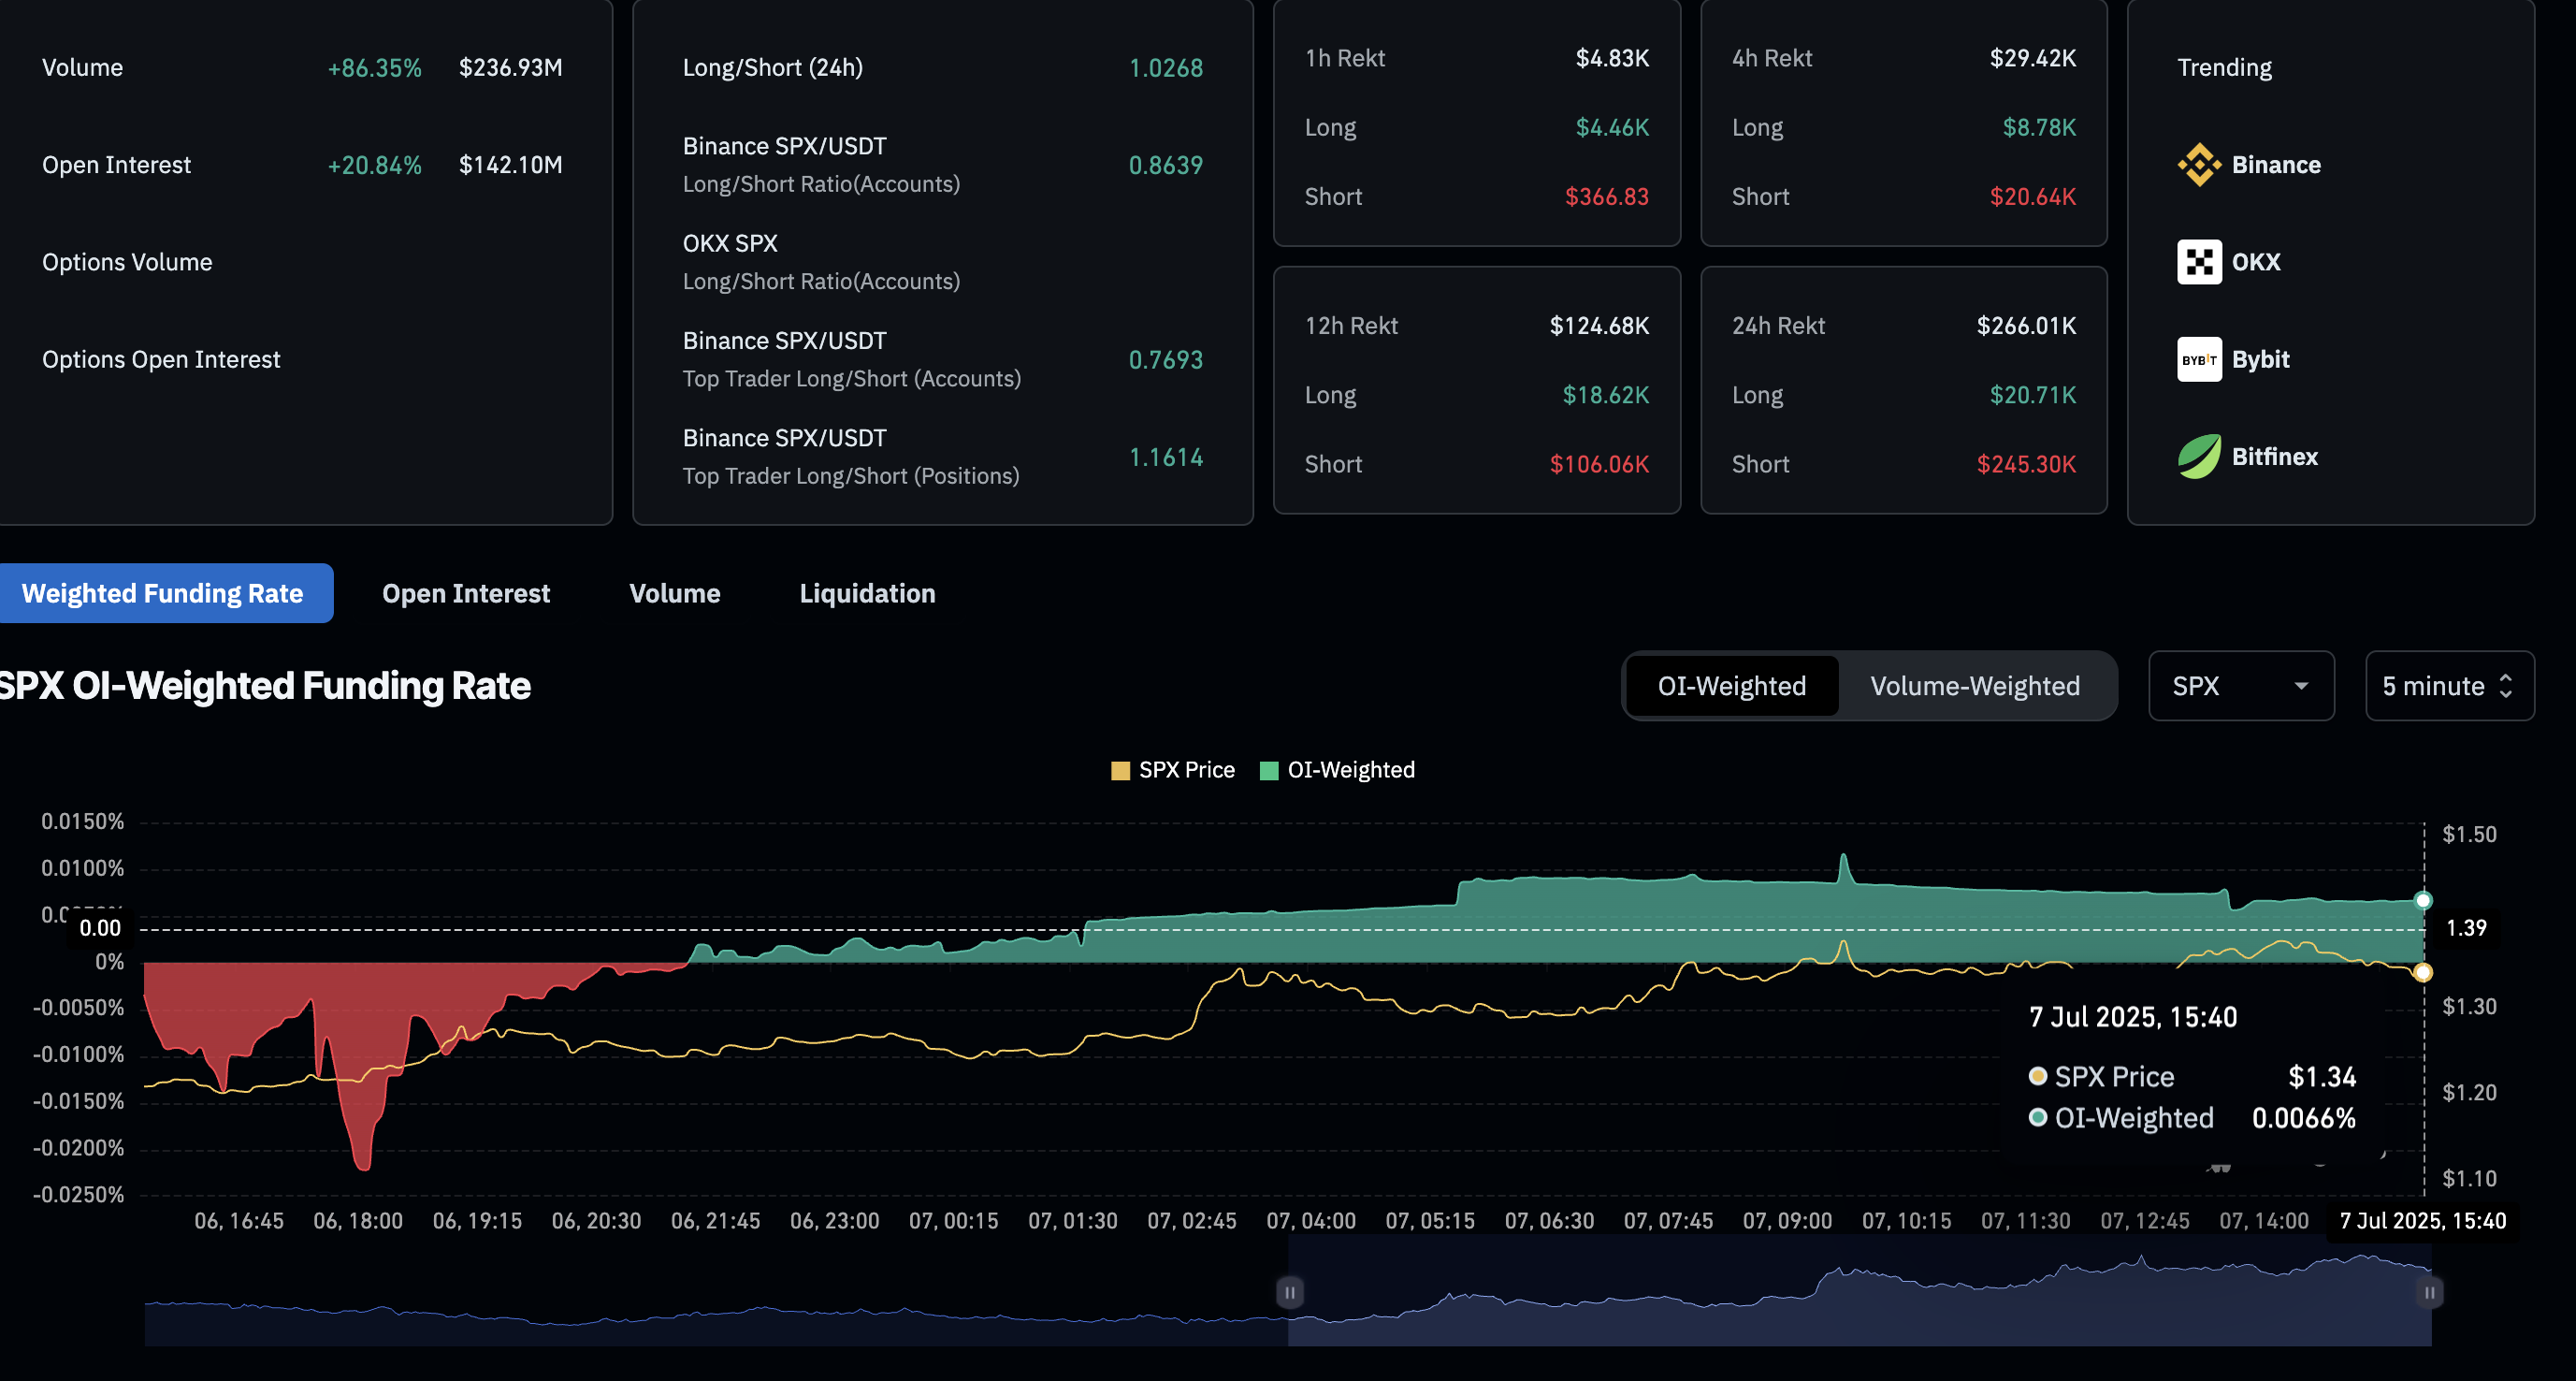
SPX derivatives. Source: Coinglass
Author

Vishal Dixit
FXStreet
Vishal Dixit holds a B.Sc. in Chemistry from Wilson College but found his true calling in the world of crypto.


