Solana price to retest all-time high at $195 as SOL remains unfazed by market crash
- Solana price crashed roughly 17% from its opening price on September 7 but recovered quickly.
- A continuation of the uptrend will push SOL to retest the all-time high at $195.42.
- If bears produce a lower low below $139.14, it will invalidate the bullish thesis.

Solana price stays strong despite the market crash on September 7 that wiped billions of dollars out of long positions. SOL is already scaling higher, hoping to retest the all-time high, but things could head south if BTC experiences another similar crash.
Market crash wipes out billions of dollars
On September 6, many altcoins experienced a sudden sell-off that recovered quickly. However, the daily candlestick close for this day was red. The next day, BTC dropped roughly 19%, ETH crashed 23%, and other altcoins dropped 40% or more.
This sell-off punished investors who jumped on the bandwagon late and can be visualized by the liquidation chart, which shows roughly $2.44 billion worth of long positions hit the dust. Moreover, $336 million worth of short positions also hit a dead end due to the sudden reversal of the uptrend.
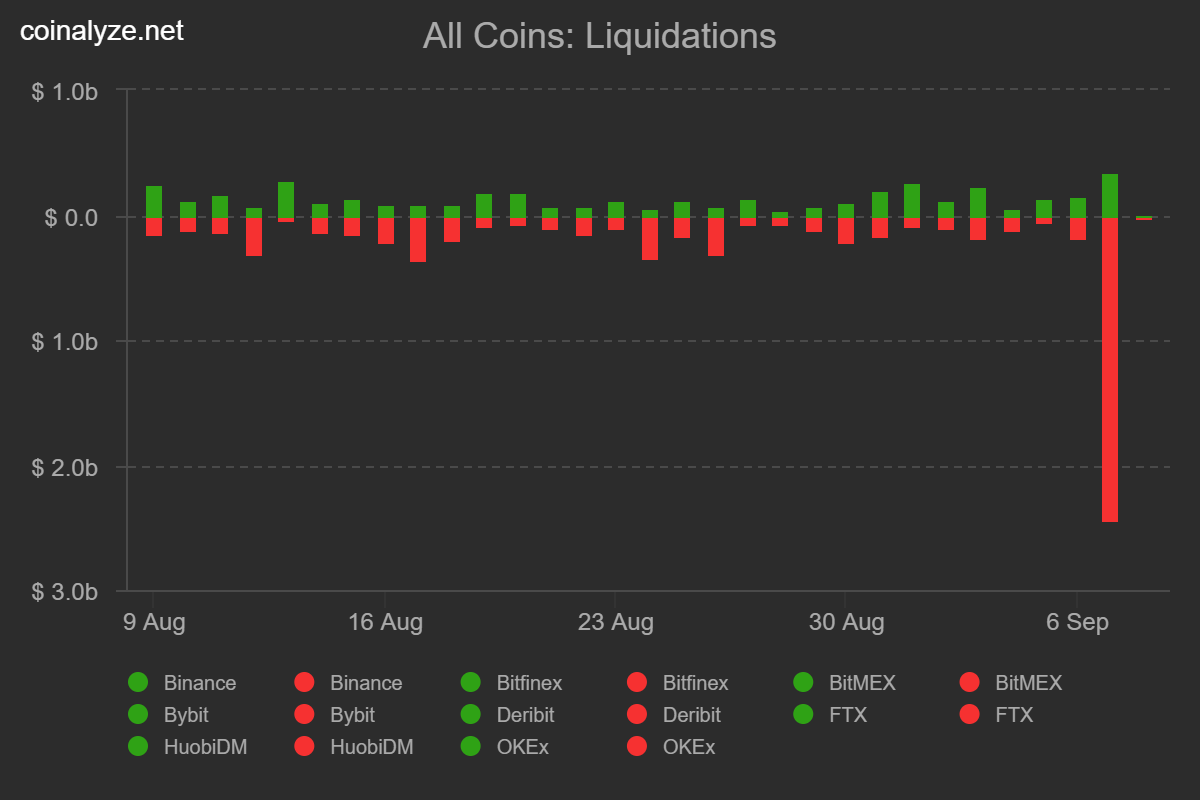
Liquidation chart
While this sell-off is relatively much less painful than May 19, where more than $5 billion worth of longs were wiped. Regardless, Solana price seemed to not care about the drop as it recovered the 16% downswing on a daily time frame and closed on a positive note.
Moreover, the current daily candlestick is also green and shows signs of continuing the uptrend which falls perfectly in line with the institutional demand. A recent report from CoinShares noted that Solana stood next to Ethereum with a $13.2 million weekly inflow for September. This massive demand notes a doubling in SOL's total inflows year-to-date.
Solana price aims to retest all-time high
Solana price dropped roughly 16% lower than the September 7 opening price but recovered quickly from the losses, closing the day green. This quick recovery is a testament to investors’ interest in SOL.
If this buying pressure continues to persist, Solana price will likely continue to climb and retest the all-time high at $195.42. In some cases, SOL might tag the 162% Fibonacci extension level at $196.63 and set up a new all-time high.
However, if the bid orders continue to pile up, Solana price could advance higher, allowing a retest of the 127.2% Fibonacci extension level at $262.34.
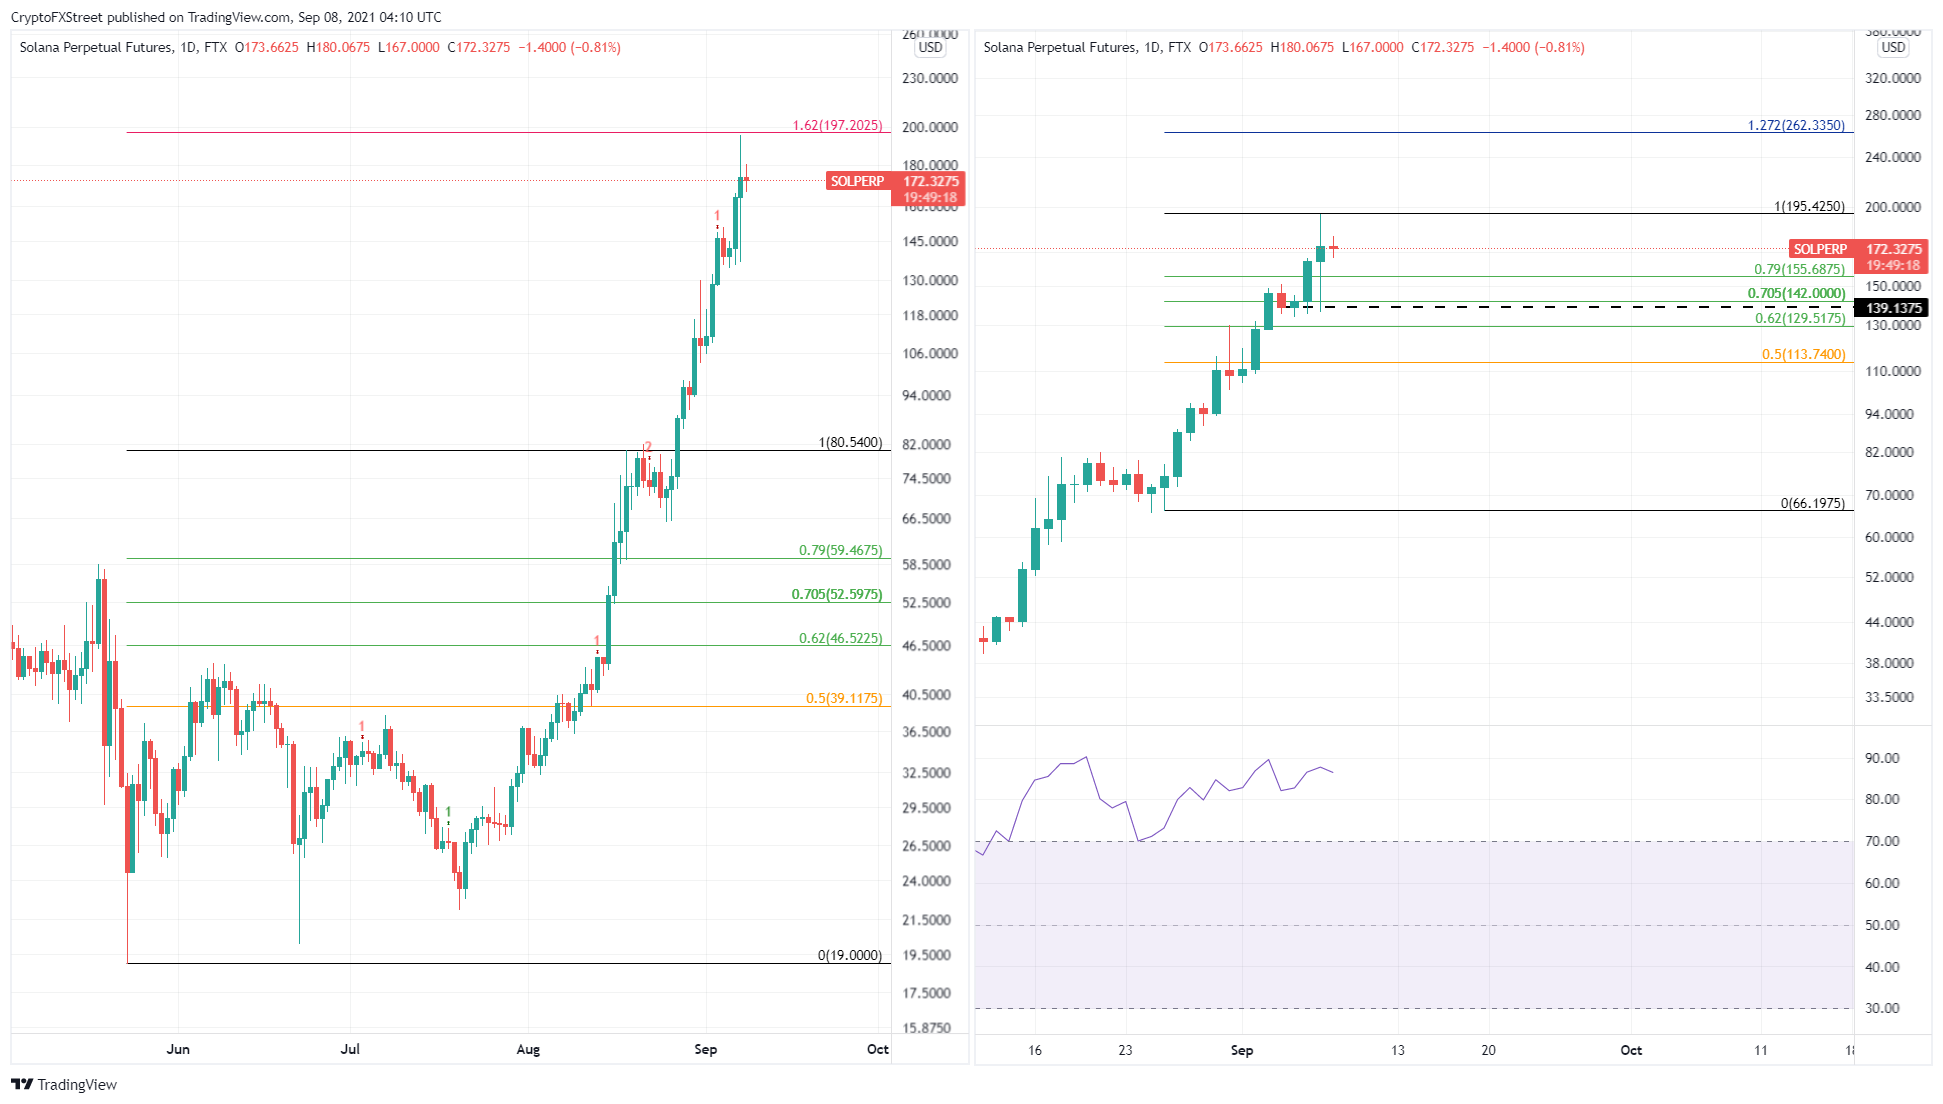
SOL/USDT 1-day chart
While things are seemingly good in the Solana ecosystem, investors need to exercise caution due to the exponential run-up. The Relative Strength Index (RSI) has been sitting in the overbought zone since August 13 and shows no signs of slowing down yet.
If investors begin to book profit and buying pressure drops, SOL could drop 18% to the 70.5% Fibonacci retracement at $142. However, if the bears produce a decisive close below the $139.14, it will invalidate the bullish thesis by setting up a lower low.
This development could further trigger a downswing to the 50% Fibonacci retracement level at $113.74.
Author

Akash Girimath
FXStreet
Akash Girimath is a Mechanical Engineer interested in the chaos of the financial markets. Trying to make sense of this convoluted yet fascinating space, he switched his engineering job to become a crypto reporter and analyst.


