Solana Price Forecast: SOL targets the $140 level amid declining bullish momentum
- Solana plunges alongside the broader crypto market pullback after consolidating for weeks.
- The momentum indicators suggest a downtrend continuation as bullish pressure subsides.
- The derivatives data shares a bearish outlook as Solana nears its lowest trading price in two weeks.

Solana (SOL) is down nearly 7.008% so far this week on Friday as the broader crypto market faces a surge in volatility due to the reinstatement of US President Donald Trump’s tariffs. The US Appeals court lifted the ban on Trump’s tariffs temporarily on Thursday after the US International Trade court struck down tariffs on Wednesday. SOL is inching closer to its lowest trading price in two weeks as bullish momentum erodes and bearish sentiment surges in the derivatives market due to massive long liquidations.
Solana targets below $150
Solana trades at $162.72, with over a 2% drop at press time on Friday, marking its third consecutive bearish candle. Over the last three weeks, SOL has traded in a sideways range between $185 and $165.
During the consolidation phase, the Relative Strength Index (RSI) has dropped to 46 from the overbought region, flashing a bearish divergence with price action. As RSI slips under the halfway line, it indicates a surge in bearish momentum. The indicator also warns of the potential for a steeper correction, as it remains far above the oversold zone.
The Moving Average Convergence/Divergence (MACD) indicator and its signal line are on a downtrend towards the centre line, reflecting a loss of bullish momentum. Additionally, the red histogram bars intensify, flashing a bearish trend reversal possibility.
The bullish failure to cross above the 50% Fibonacci retracement, drawn from $261.97 on January 18 to $105.40 on April 8, reflects profit booking by investors amid uncertain market conditions.
If Solana fails to hold above $165.94, the lowest closing price in the last three weeks on May 17, investors could witness SOL testing lower levels. The immediate support lies at $140.32, highlighted by the previous low on April 30.
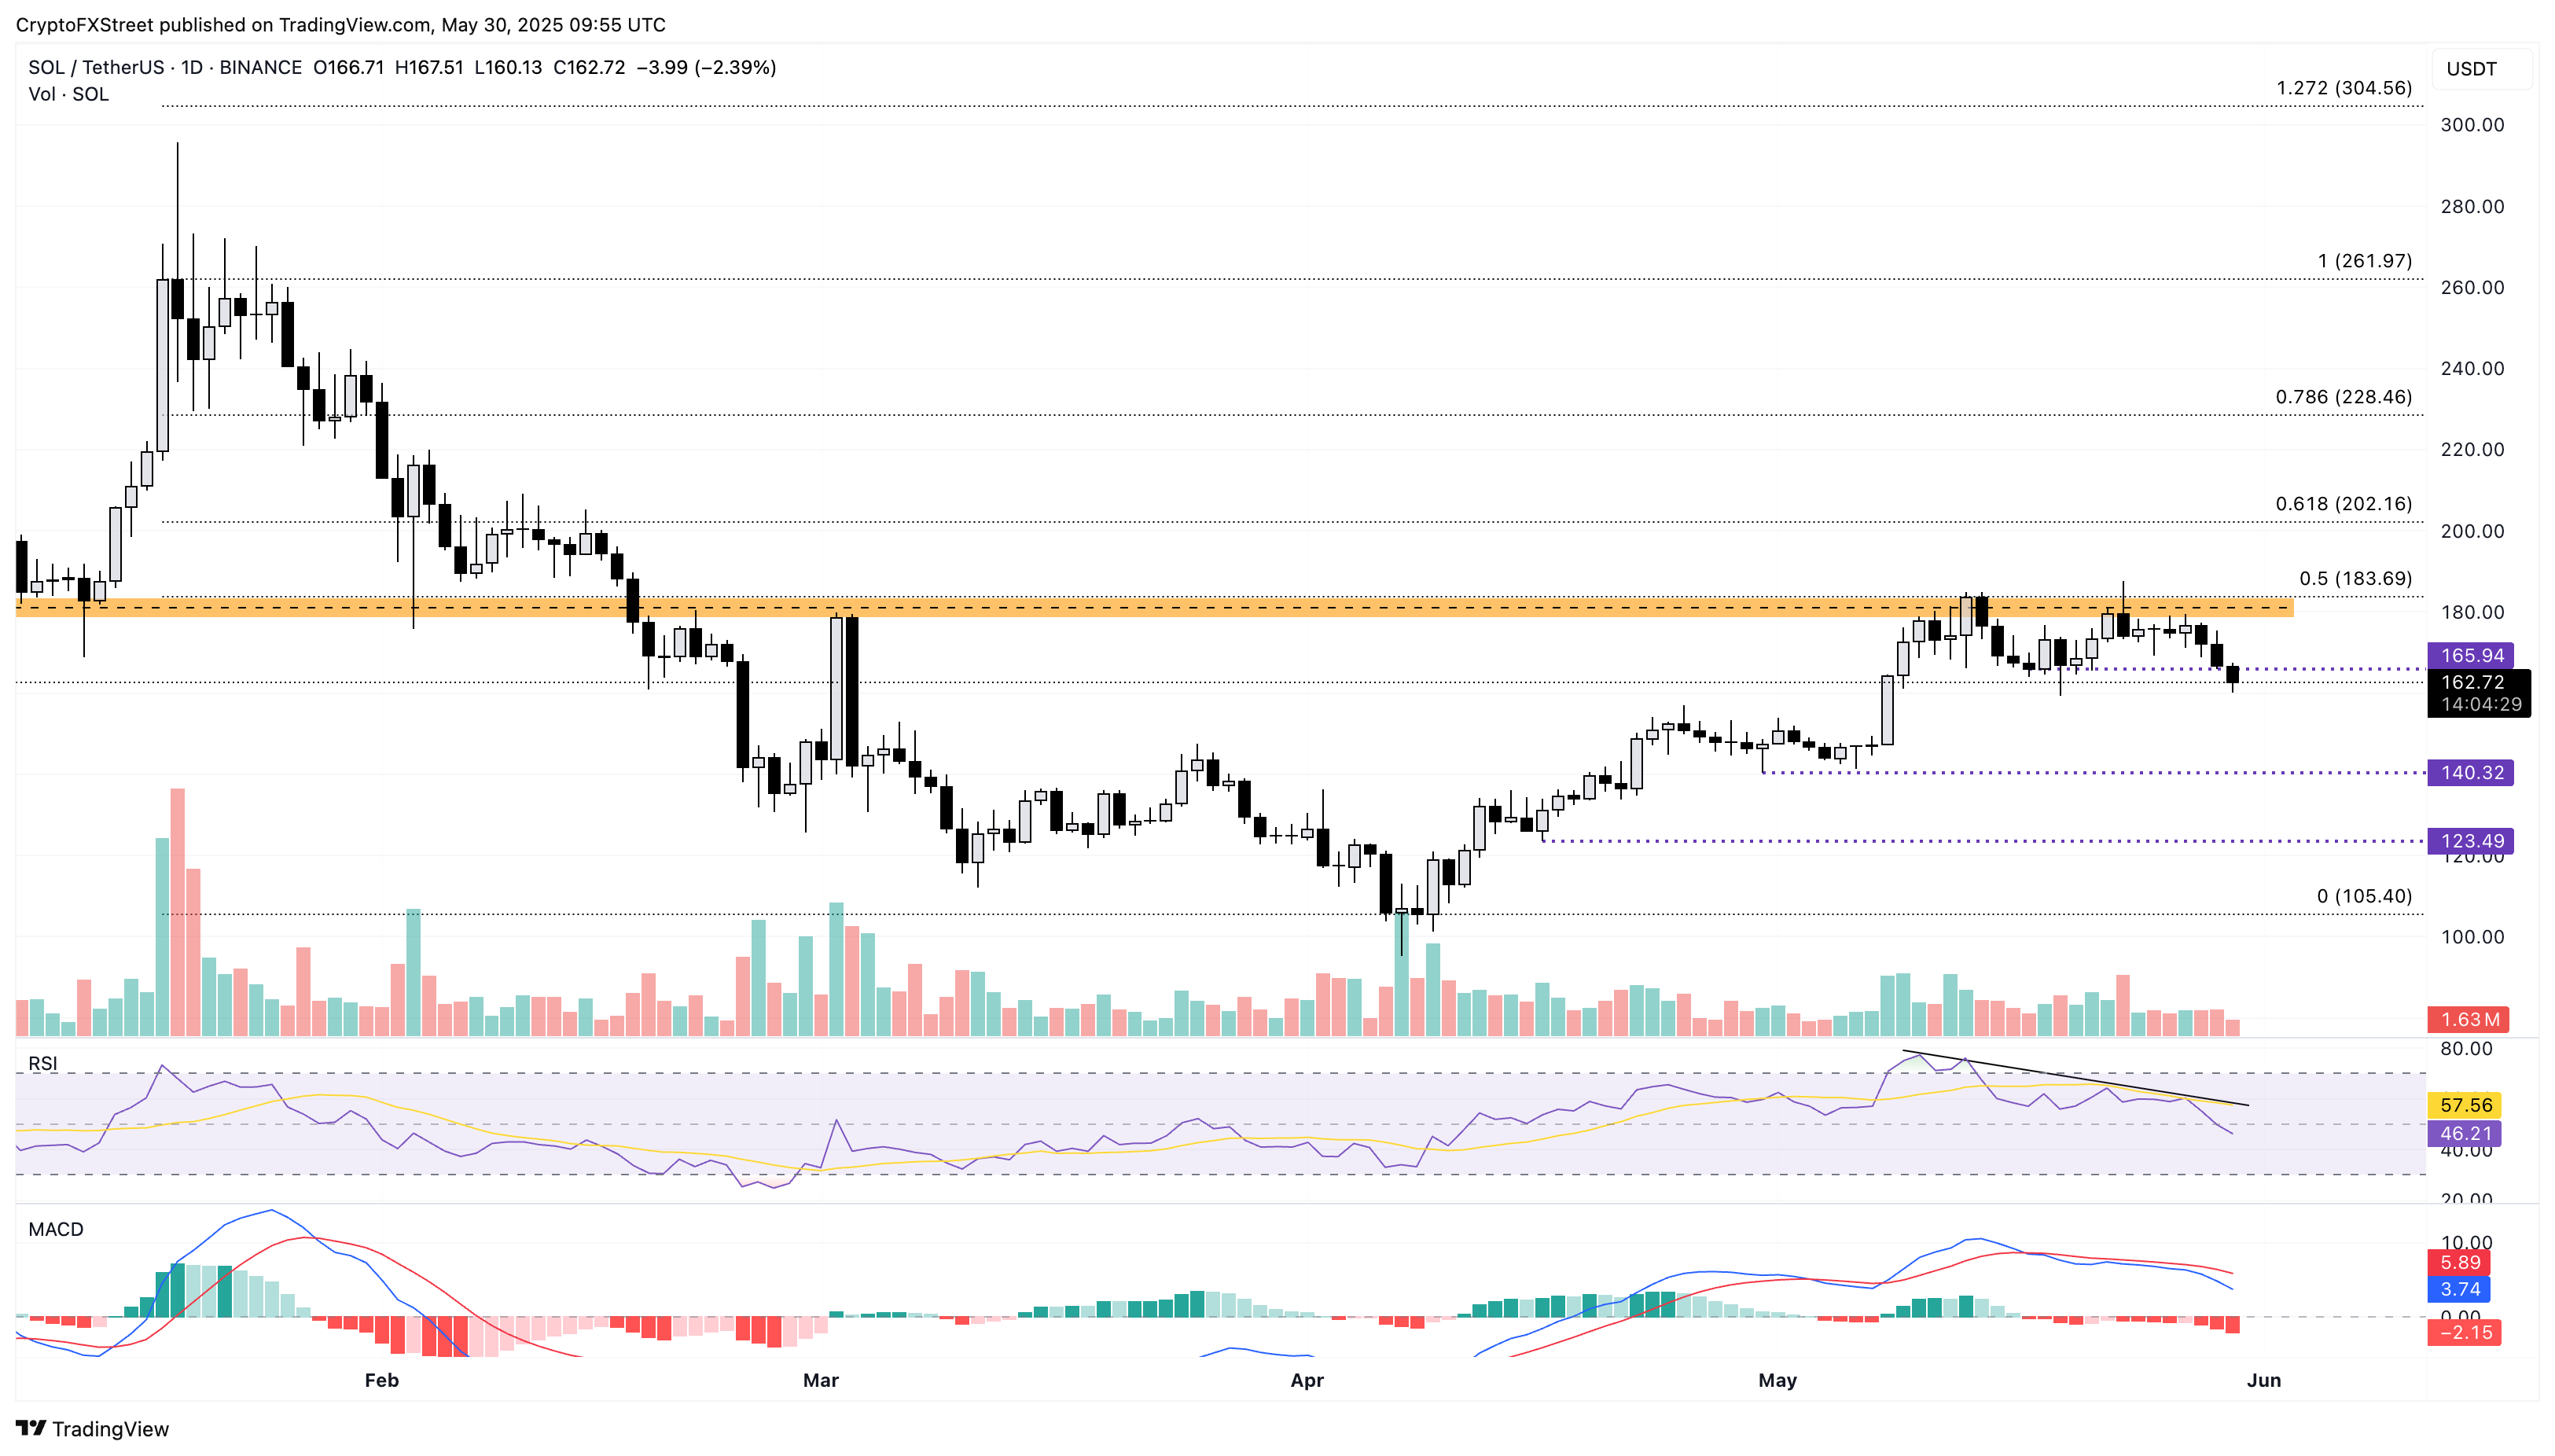
SOL/USDT daily price chart. Source: Tradingview
To nullify the bearish thesis, Solana must sustain a daily closing price above $165. Doing so could help SOL retest the $185 supply zone.
Bearish intent on a rise in Solana derivatives
As Solana's technical outlook turns bearish, the derivatives market reports a massive wipeout of bullish traders. According to Coinglass, Solana Futures Open Interest (OI) has decreased by 3.23% over the past 24 hours at press time, reaching $7.11 billion. This reflects a sudden drop in traders' interest in Solana, mainly due to increased volatility.
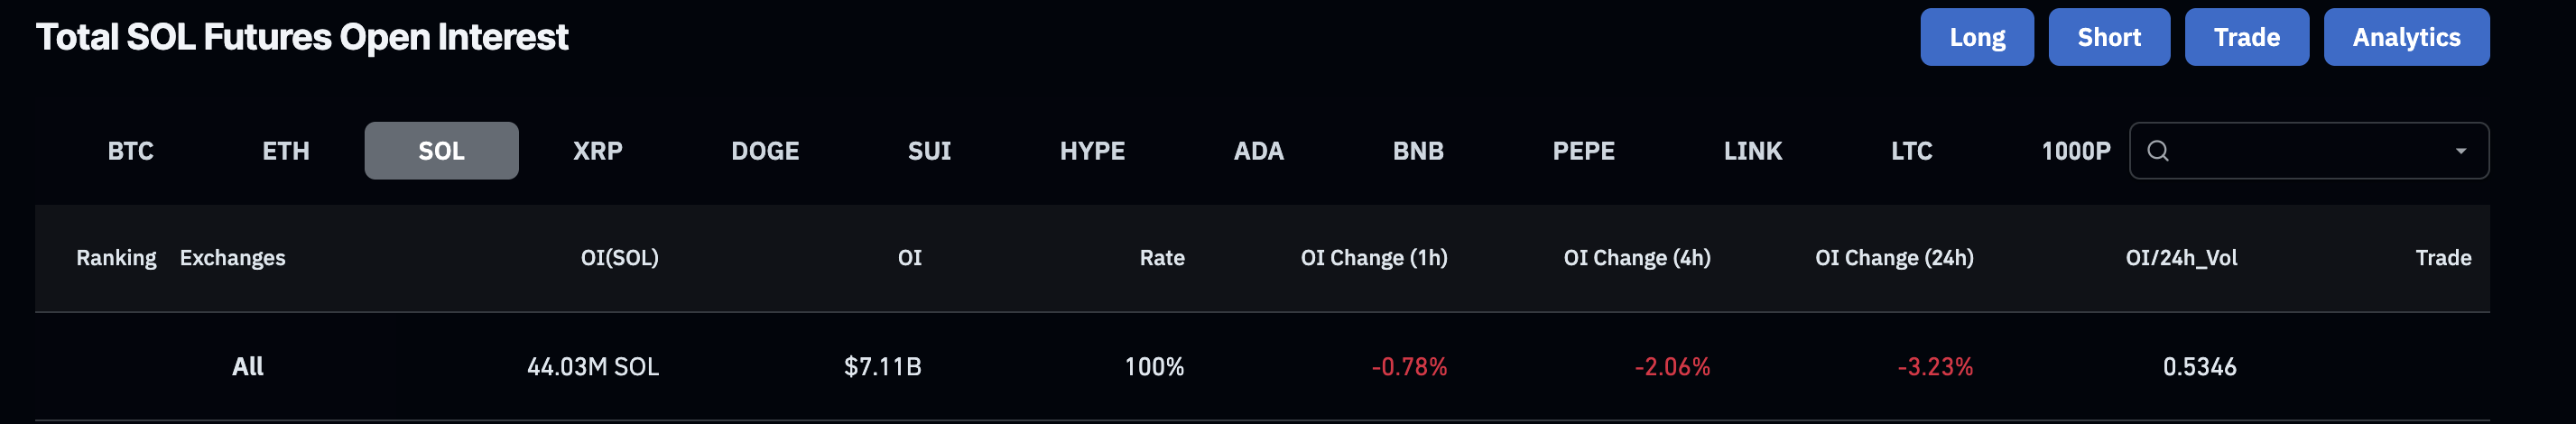
Total SOL Futures Open Interest. Source: Coinglass
The liquidation chart shows long liquidations rising to $18.98 million on Friday. This is more than three times the number of short liquidations, limited to $464.75K, indicating the exodus of bullish-aligned Solana bulls.
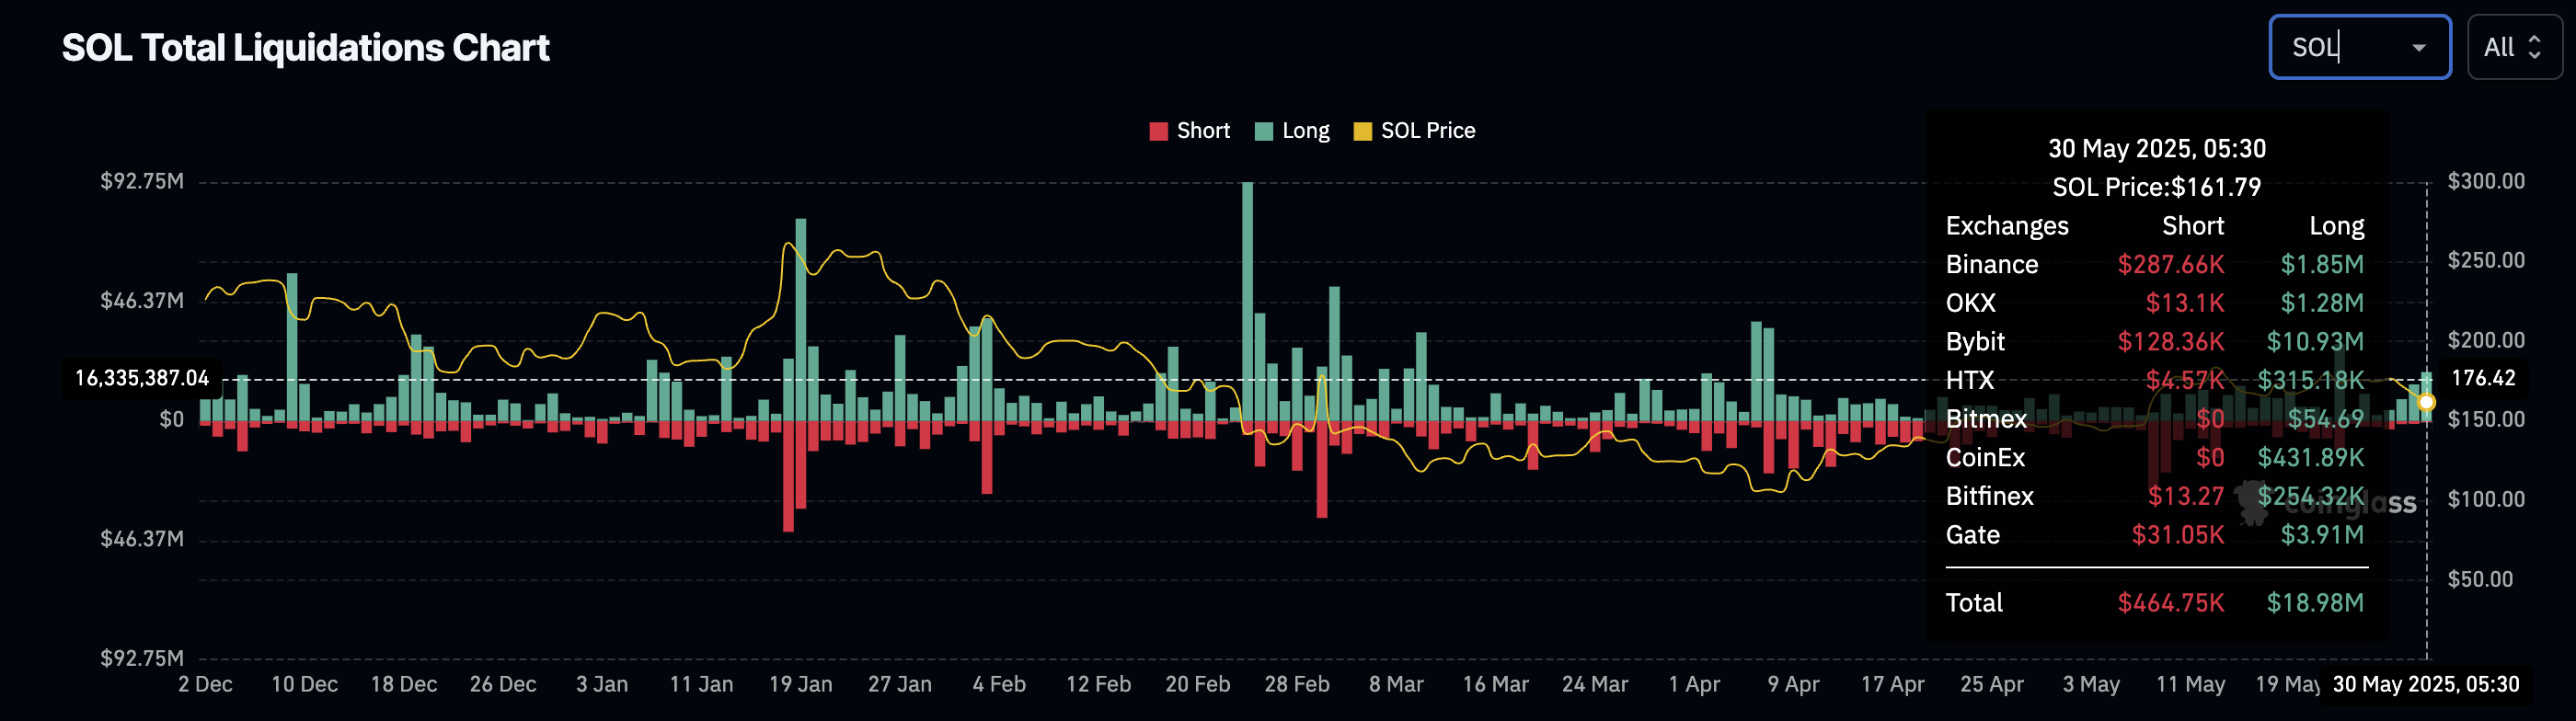
SOL Liquidations Chart. Source: Coinglass
Due to the exit of Solana bulls, the OI-weighted funding rate has flipped negative to -0.0013%. This reflects declining bullish activity and paints a gloomier future for Solana.
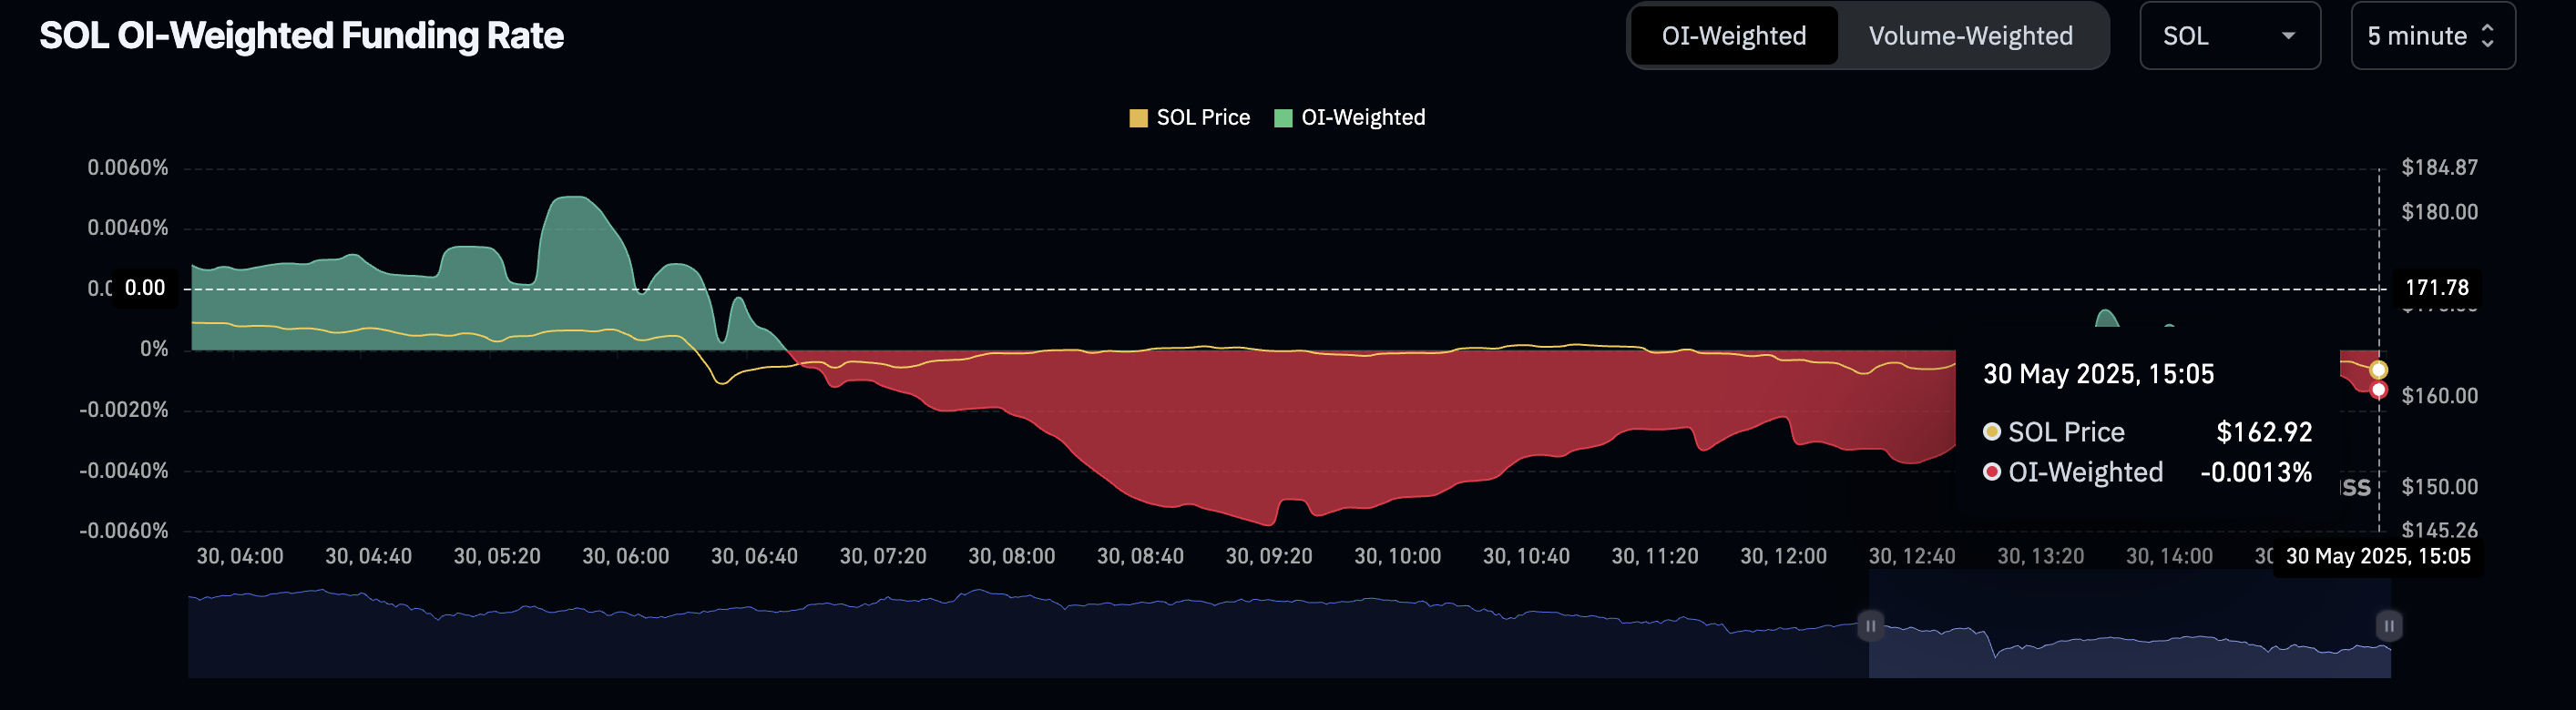
SOL OI-Weighted Funding Rate. Source: Coinglass
Author

Vishal Dixit
FXStreet
Vishal Dixit holds a B.Sc. in Chemistry from Wilson College but found his true calling in the world of crypto.


