Solana Price Forecast: SOL sell-off below $200 looms as DeFi TVL, funding rates tumble
- Solana trims gains toward the $200 level, reflecting high volatility in the broader cryptocurrency market.
- Solana’s DeFi ecosystem’s staking balance has decreased 15% from its September peak of $13.22 billion.
- Solana Open Interest-weighted funding rate flips negative as traders pile into short positions.

Solana (SOL) is trading downward at around $206 at the time of writing on Tuesday, reflecting a healthy correction after a steady rise from the weekend through to Monday.
Technically, there lies a narrow range of $200 to $205, but a weak derivatives market and a 15% decline in the ecosystem’s staking balance highlight potential risks that could prolong the pullback.
Solana DeFi TVL, funding rates decline
Solana’s Decentralized Finance (DeFi) reached a new all-time high in Total Value Locked (TVL) on September 14, with $13.22 billion held in smart contracts across all protocols on the chain. However, extreme volatility in the broader cryptocurrency market, which coincided with the price declining from highs around $250, culminated in a sharp drop to $10.78 billion on Friday.
The DeFi TVL averages $11.23 billion on Tuesday, but shows signals of further decline if the Solana price drops below the critical $200 level. Holders often withdraw funds from staking contracts, intending to sell, thus increasing the risk of a sell-off.
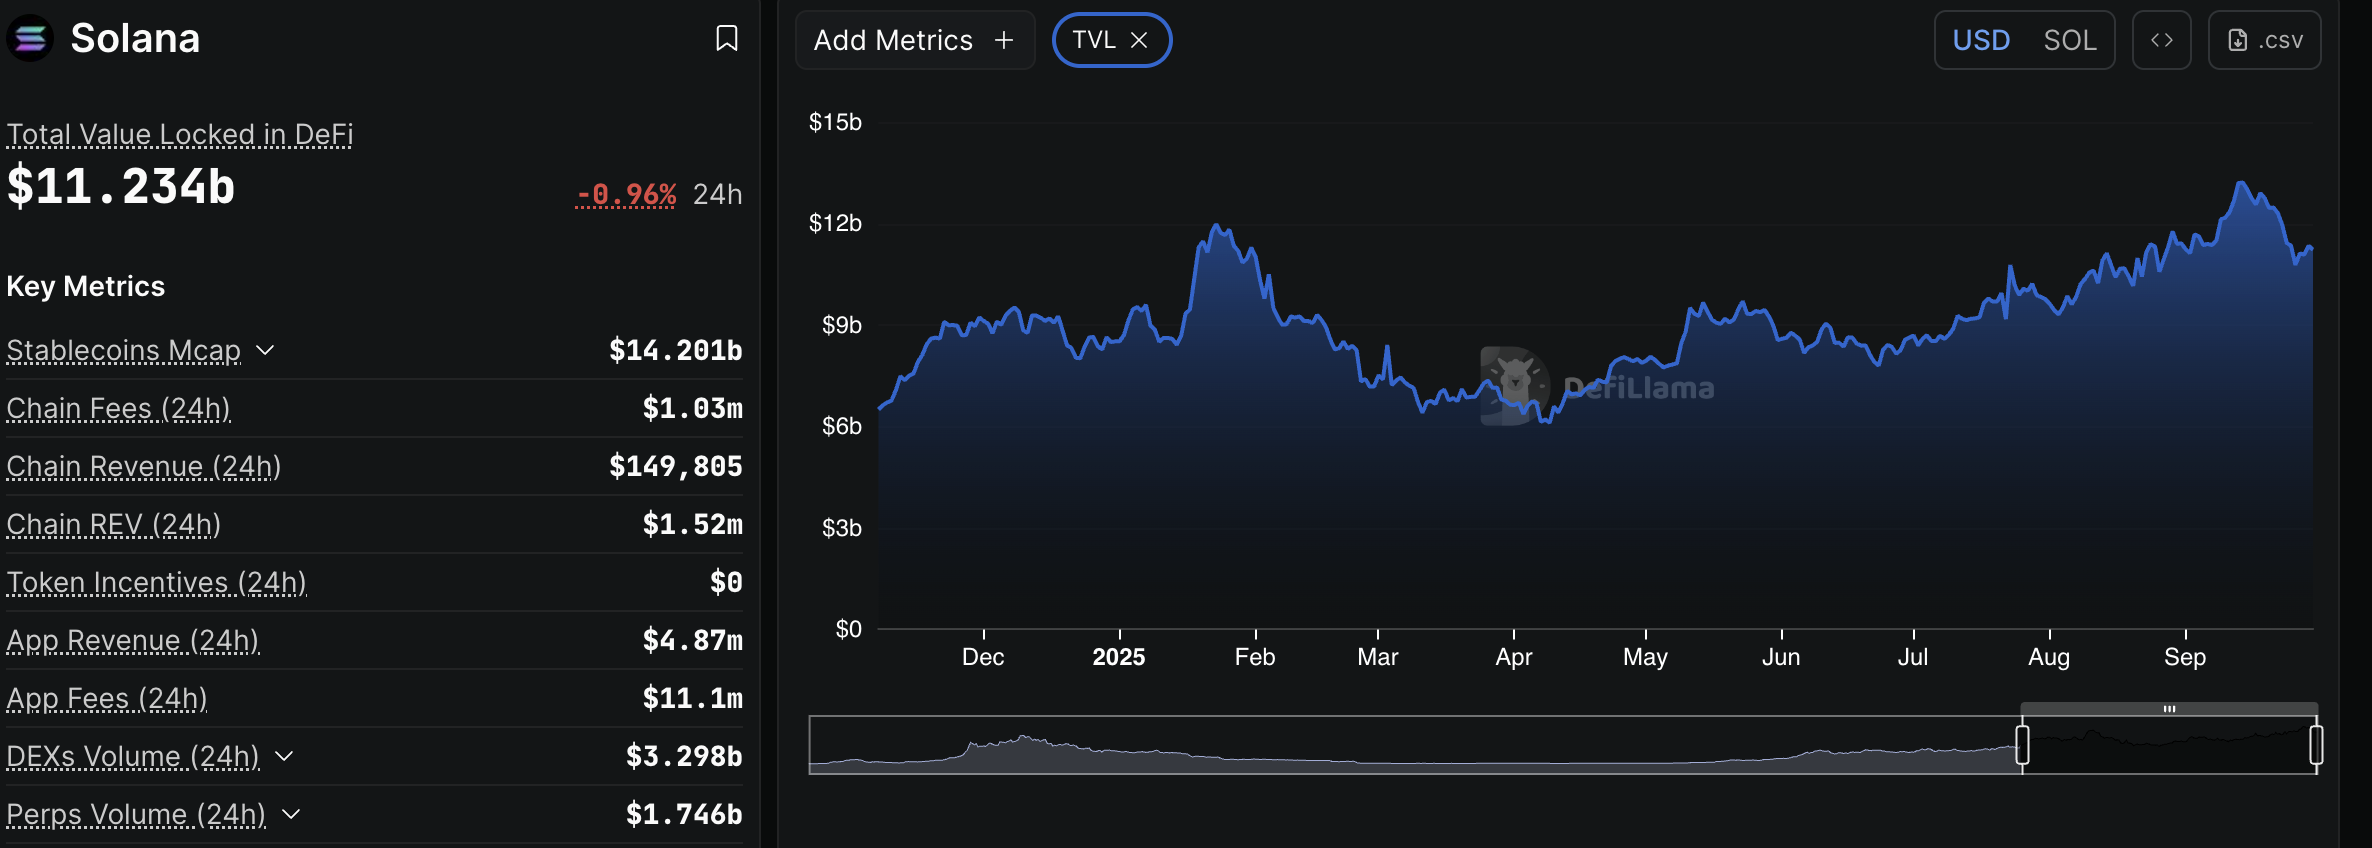
Solana DeFi TVL | Source: CoinGlass
Solana’s derivatives market also shows weakness, as evidenced by the Open Interest (OI) OI-Weighted Funding Rate flipping negative. Negative funding rates often indicate risk-off sentiment, as traders increasingly shun long positions while piling into short positions. The next few days could provide more insight into the direction the SOL OI-Weighted Funding Rate takes and whether a recovery above $220 will follow, or if investors should begin acclimating to losses below the $200 level.
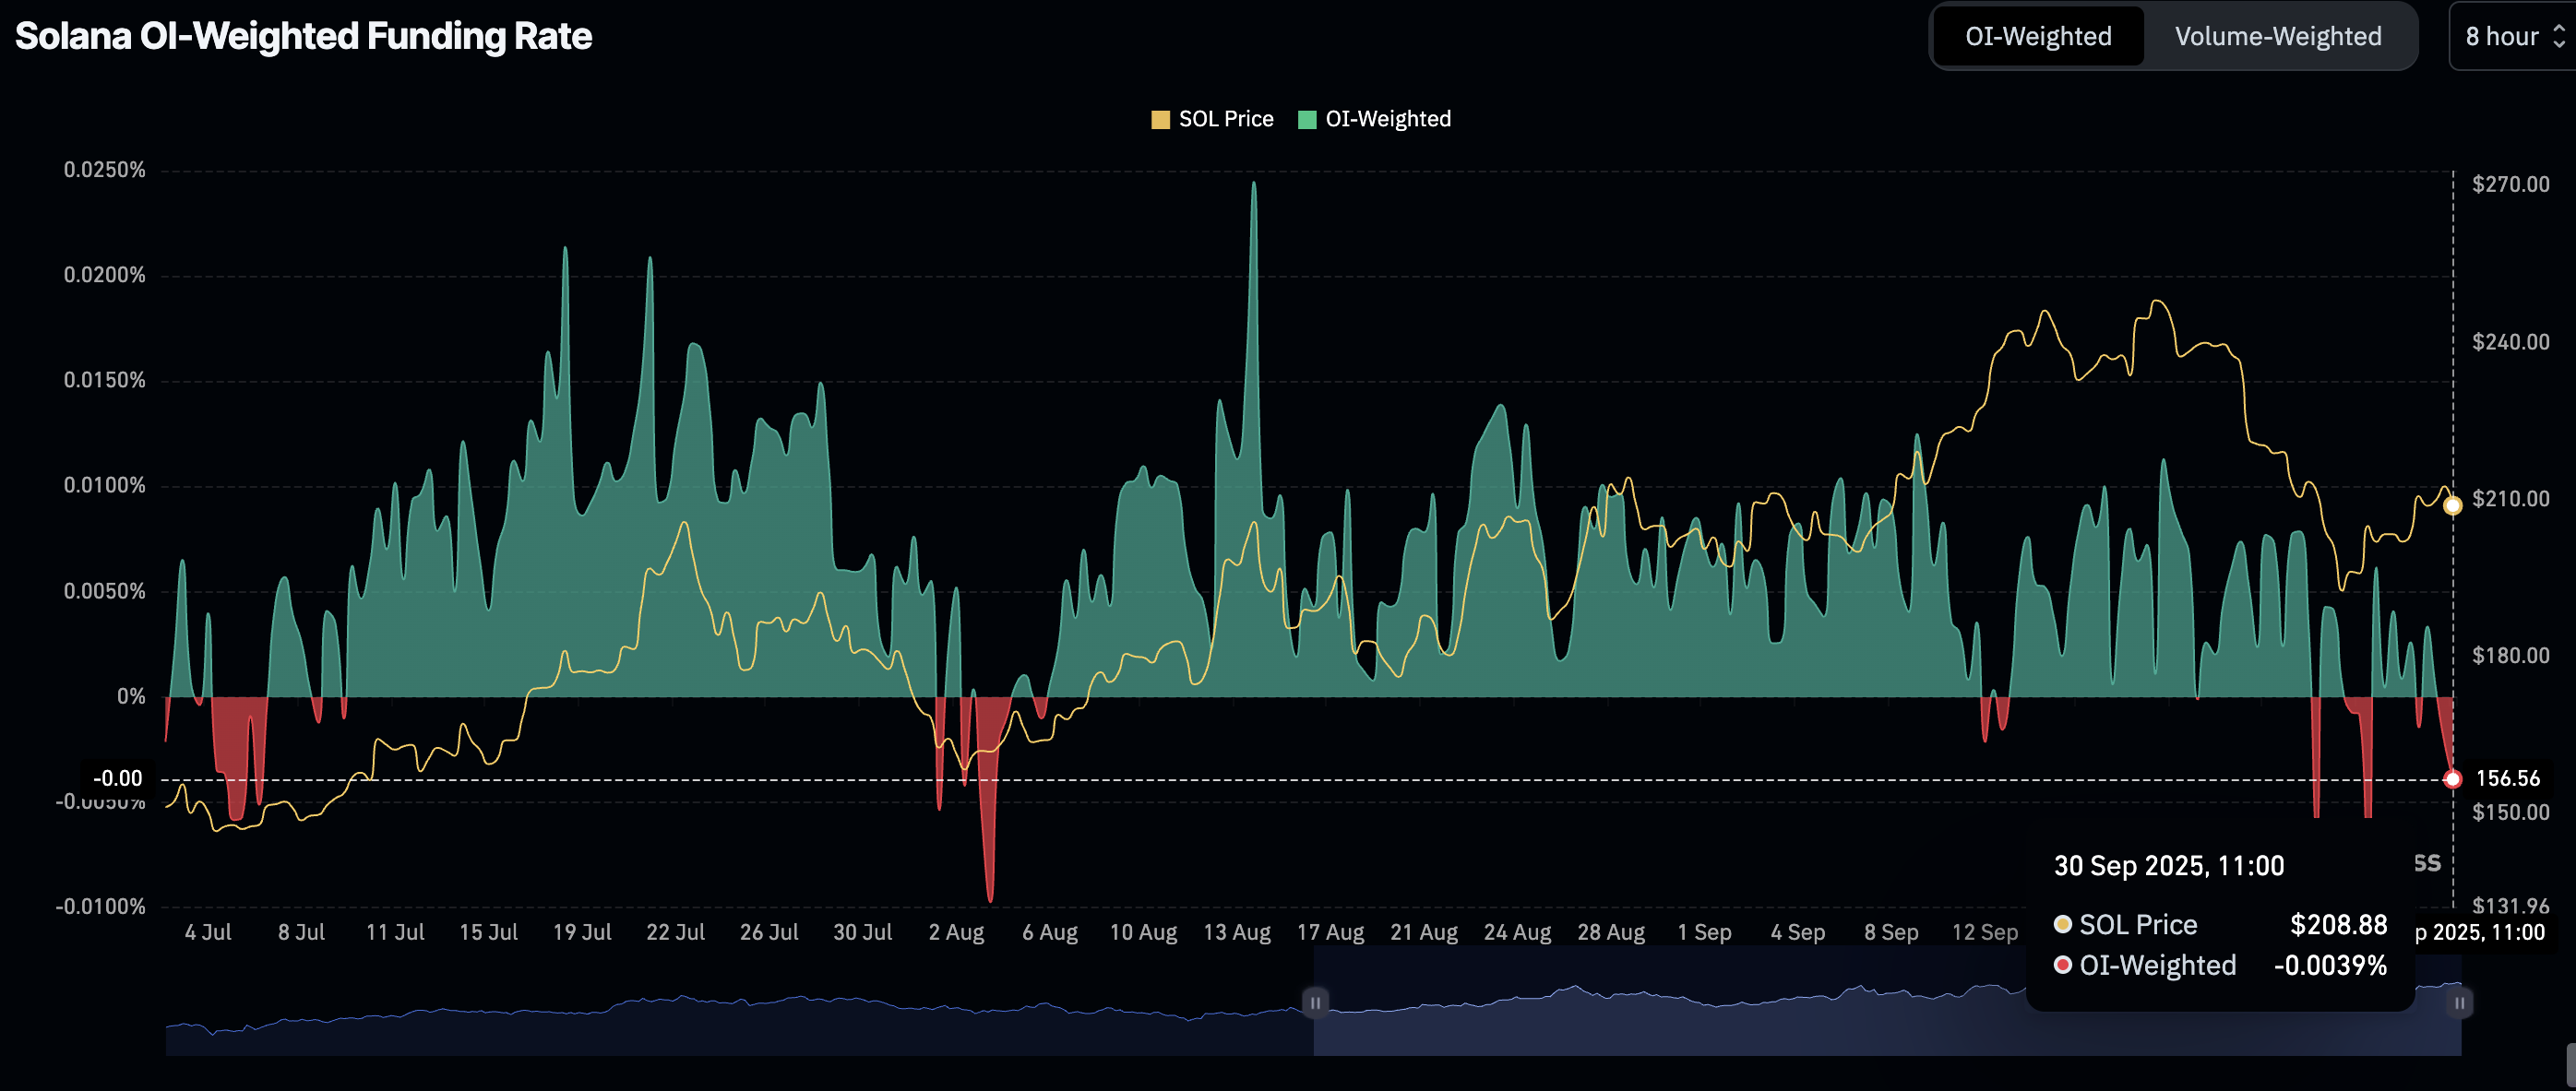
Solana OI-Weighted Funding Rate | Source: CoinGlass
Technical outlook: Solana faces a potential deeper pullback
Solana trades below the 50-day Exponential Moving Average (EMA) at $208 after rejection under $215 on Monday. The reversal is reflected in the Relative Strength Index (RSI), which failed to lift above the midline, instead dropping to 44 on the daily chart.
As the RSI declines below the midline, it suggests bearish momentum is gaining traction. Investors could also reduce their risk exposure, as the Moving Average Convergence Divergence (MACD) indicator has maintained a sell signal since September 21. The red histogram bars underscore the bearish outlook, which could erode gains in favor of a correction below the $200 round-number key level.
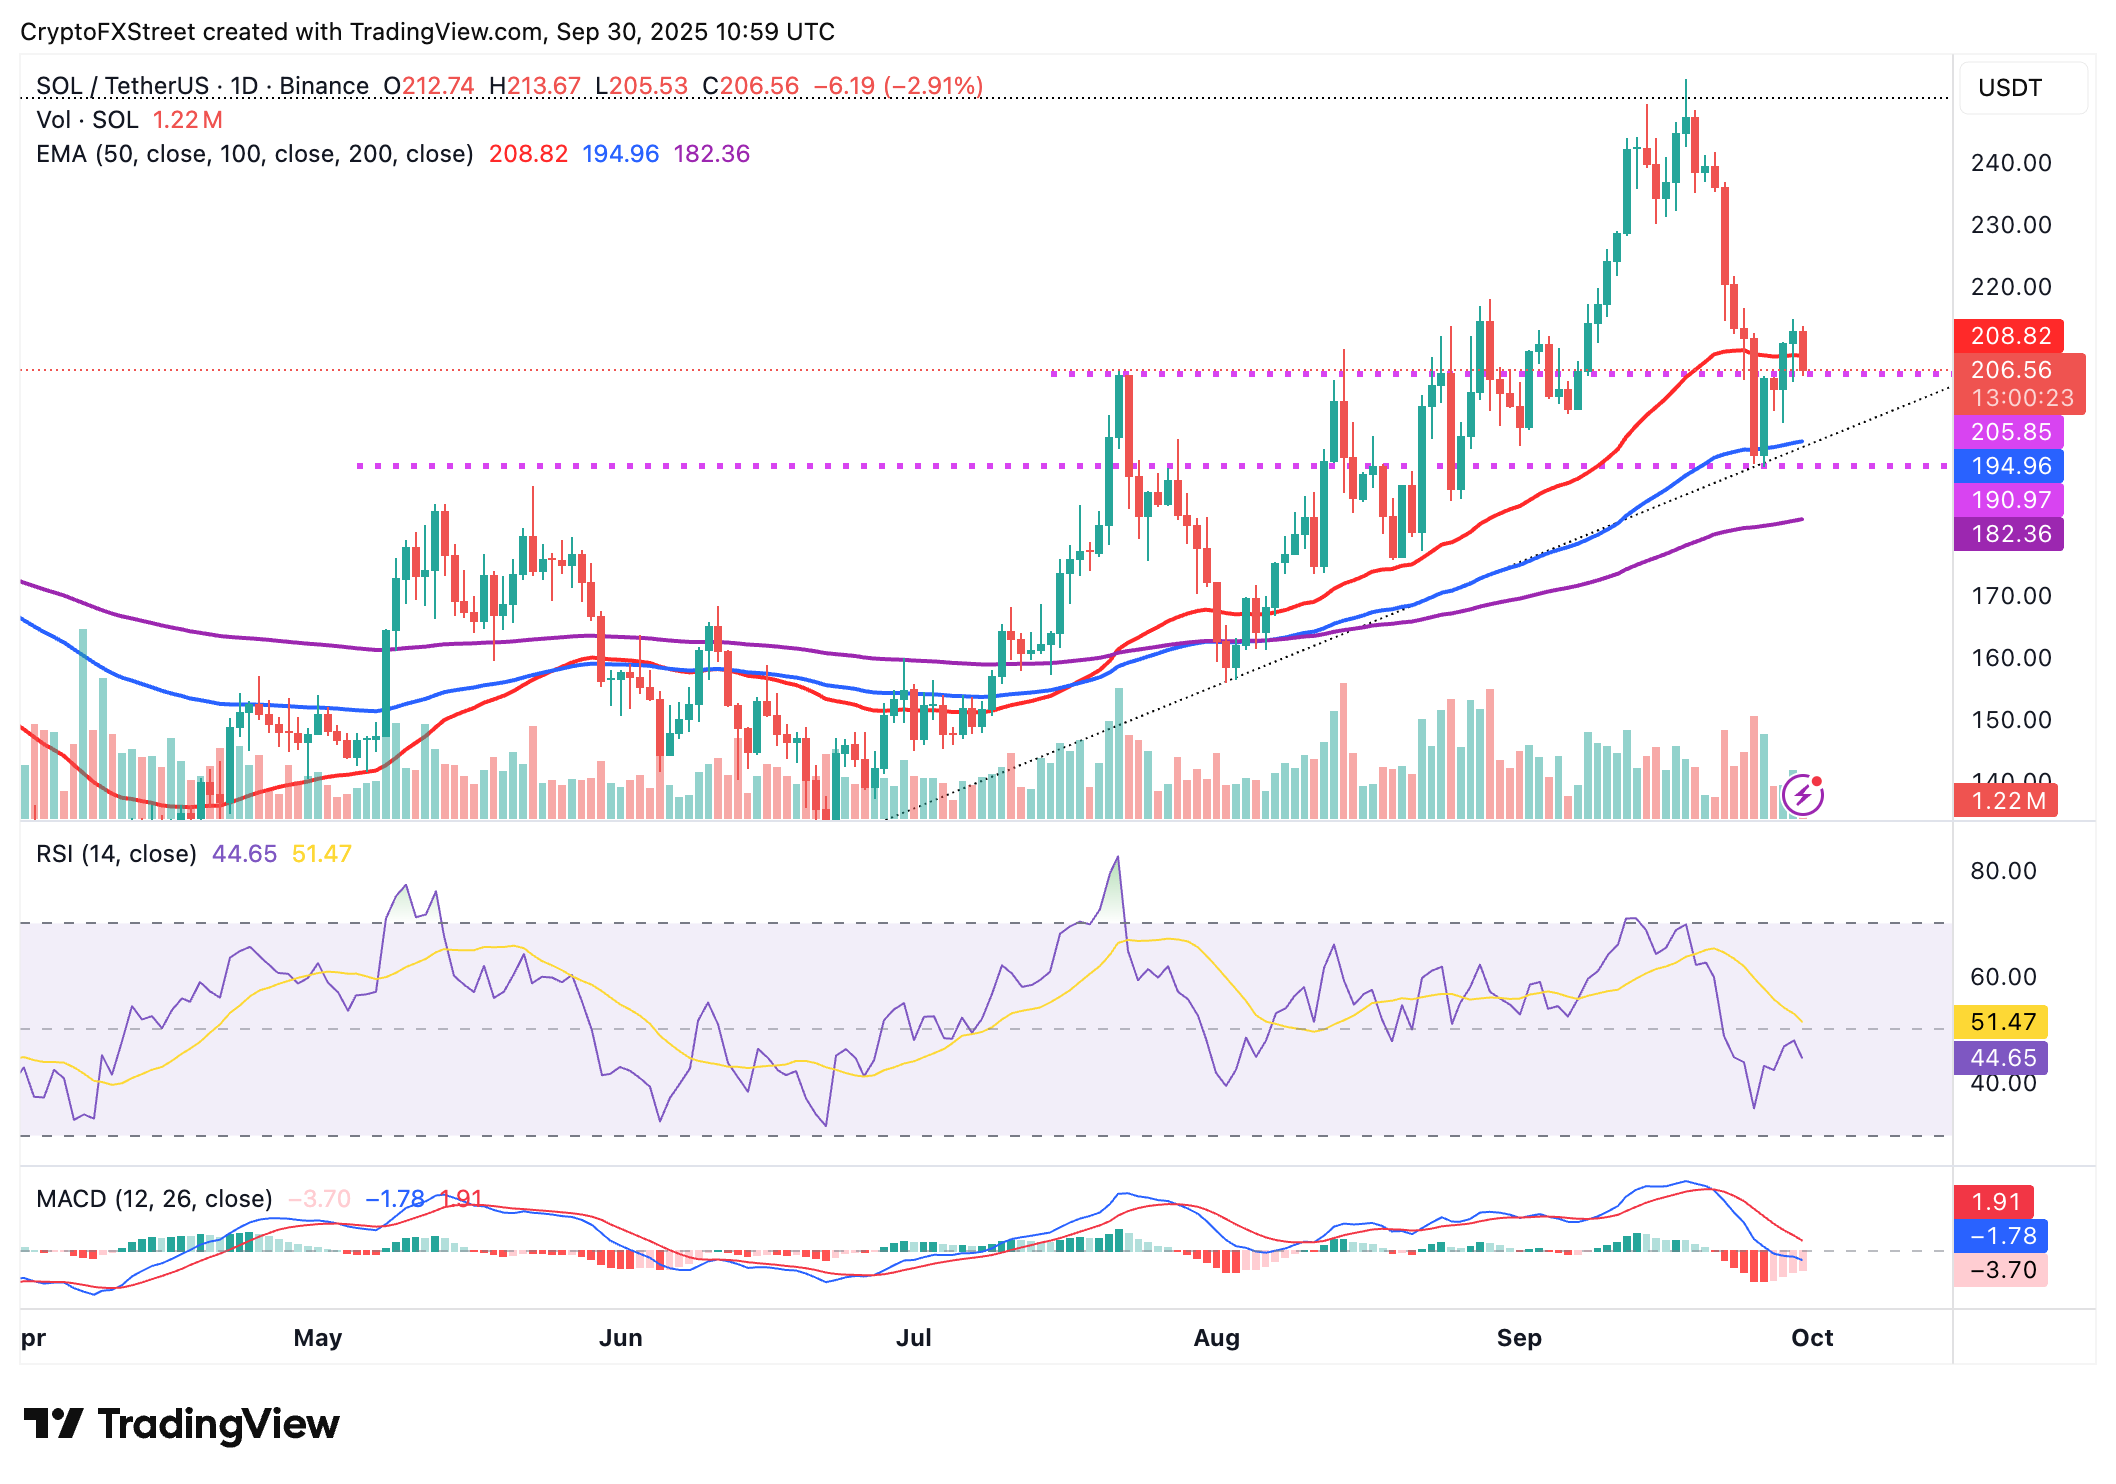
SOL/USDT daily chart
If the pullback extends below $200, traders will shift their focus to the 100-day EMA at $194 and the 200-day EMA at $182, all of which will serve as tentative support areas. Still, traders can hope for an immediate rebound above the 50-day EMA, which could pave the way for a steady uptrend above $220 and later toward $250.
Open Interest, funding rate FAQs
Higher Open Interest is associated with higher liquidity and new capital inflow to the market. This is considered the equivalent of increase in efficiency and the ongoing trend continues. When Open Interest decreases, it is considered a sign of liquidation in the market, investors are leaving and the overall demand for an asset is on a decline, fueling a bearish sentiment among investors.
Funding fees bridge the difference between spot prices and prices of futures contracts of an asset by increasing liquidation risks faced by traders. A consistently high and positive funding rate implies there is a bullish sentiment among market participants and there is an expectation of a price hike. A consistently negative funding rate for an asset implies a bearish sentiment, indicating that traders expect the cryptocurrency’s price to fall and a bearish trend reversal is likely to occur.
Author

John Isige
FXStreet
John Isige is a seasoned cryptocurrency journalist and markets analyst committed to delivering high-quality, actionable insights tailored to traders, investors, and crypto enthusiasts. He enjoys deep dives into emerging Web3 tren



