Solana Price Forecast: SOL loses strength as narrative shifts in derivatives markets
- Solana extends losses for the fifth consecutive day by 5% on Monday, risking the $126 support.
- The derivatives market sees a bearish shift in investor sentiment, with Open Interest declining and the funding rate turning negative.
- The technical outlook for Solana indicates a bearish bias as selling pressure renews.

Solana (SOL) trades at $126 under intense selling pressure, recording a 5% intraday loss by press time on Monday, marking the fifth straight bearish daily candle. The high-speed blockchain witnesses a risk-off sentiment in the derivatives market as investors withdraw capital at stake while bears pay a premium to hold short positions. Technically, Solana could extend the decline as bearish momentum remains heightened.
Solana faces bearish pressure as investors lose risk appetite
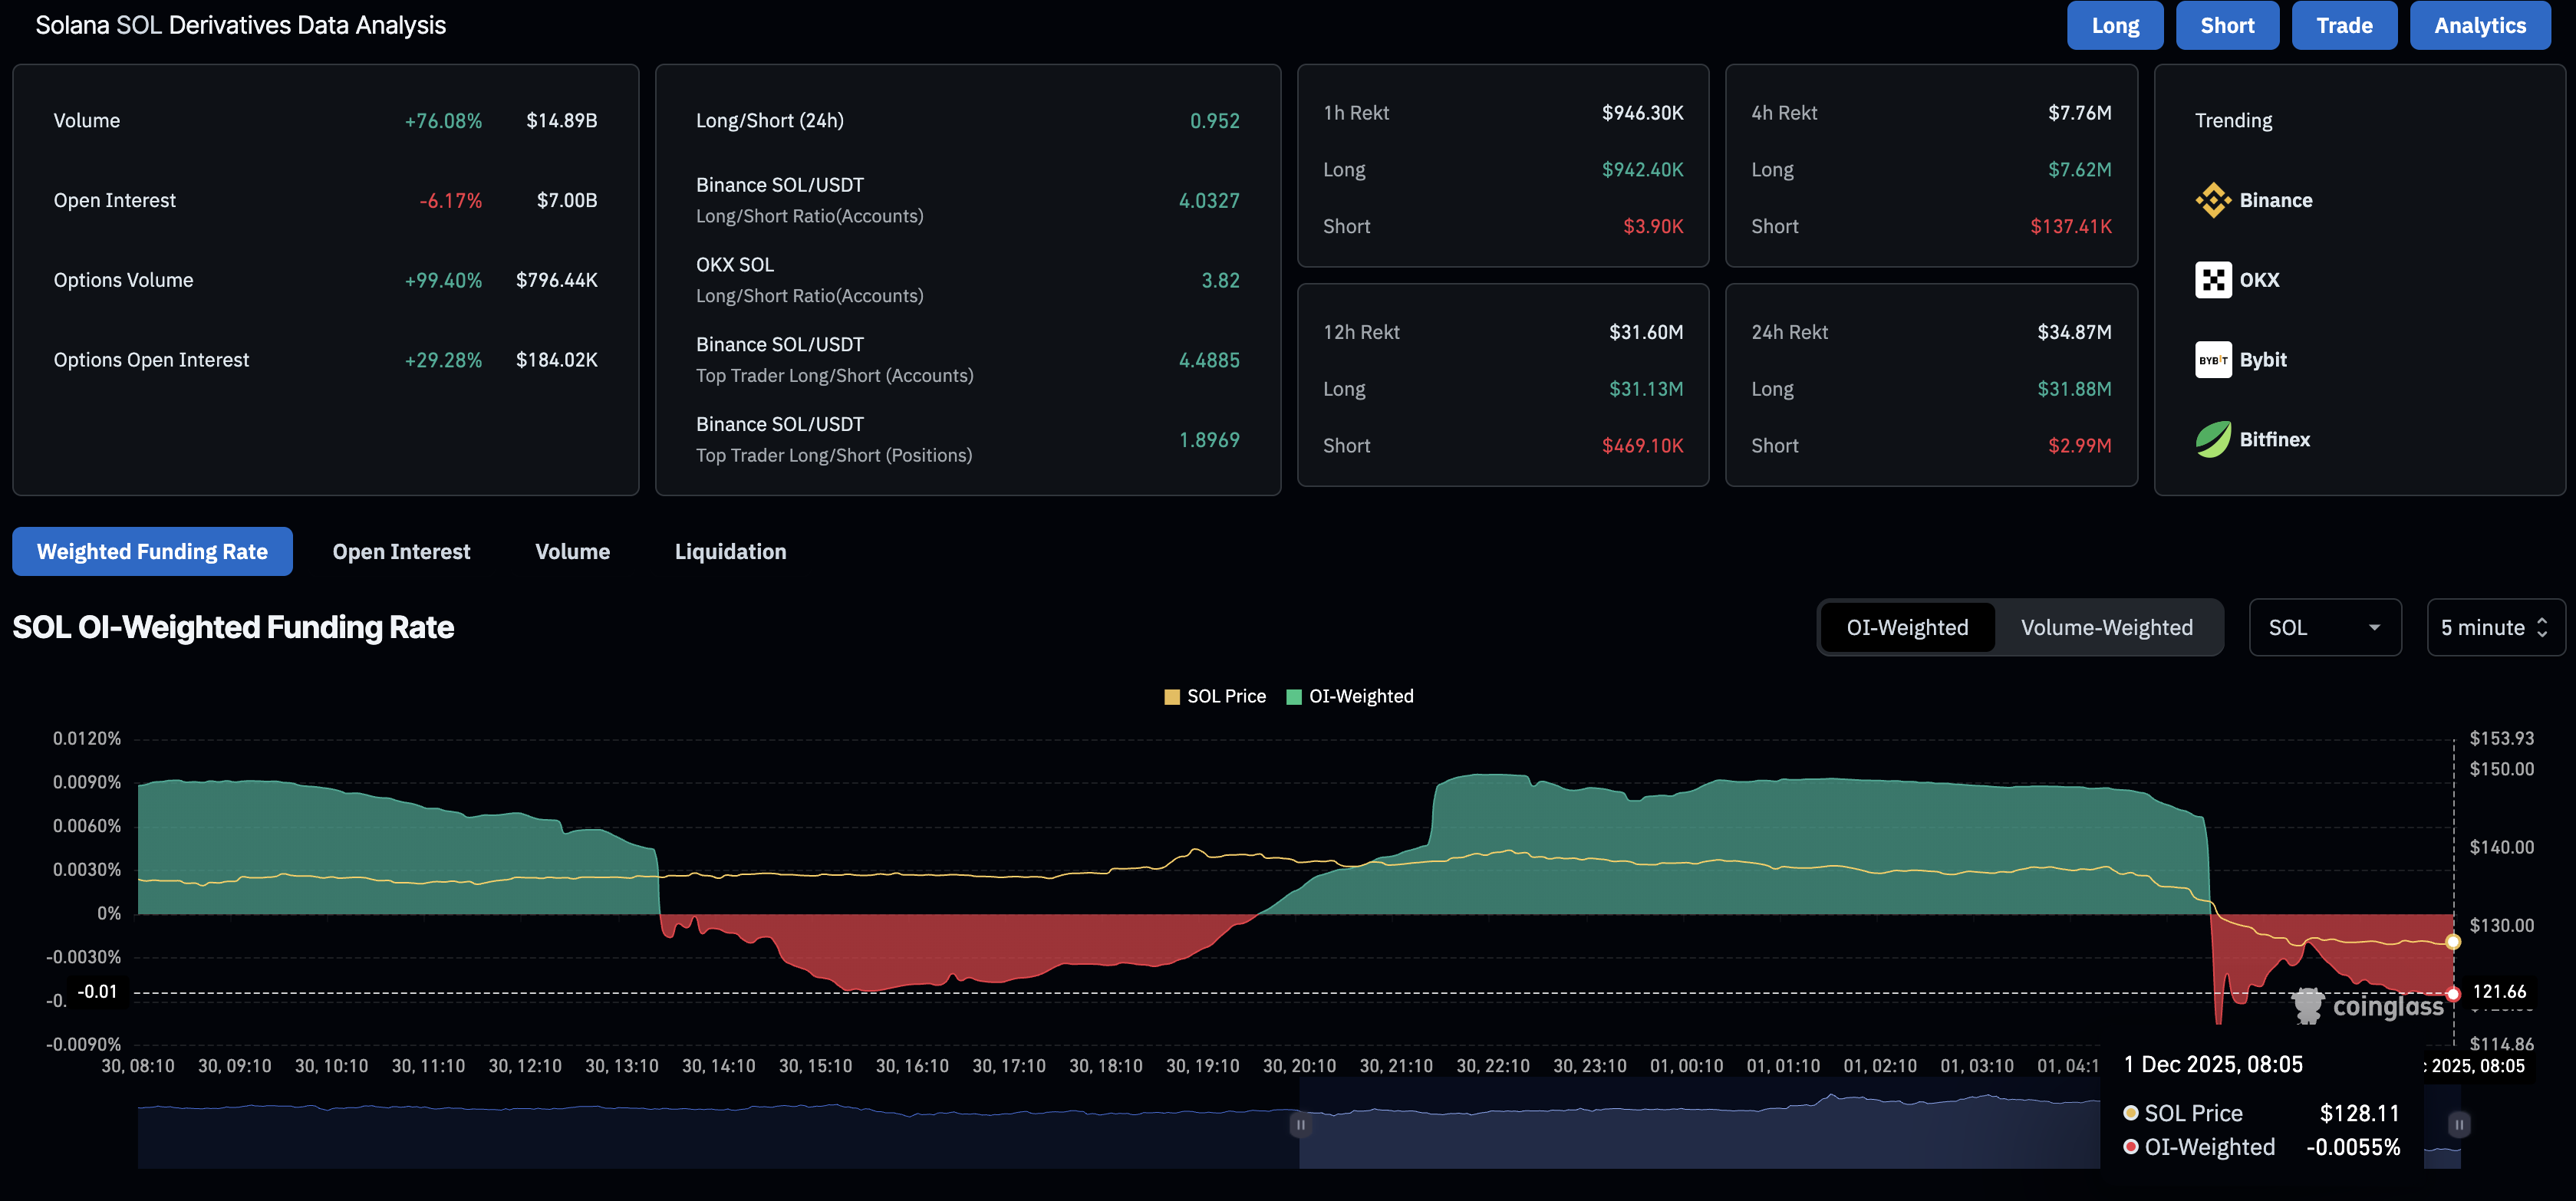
Solana is losing investor interest amid a broader cryptocurrency market sell-off, as Bitcoin (BTC) drops below $87,000, resulting in over $600 million in 24-hour liquidations across the market. CoinGlass data shows that the SOL futures Open Interest (OI) – the notional value of all outstanding contracts – is down 6.17% in the last 24 hours to $7.00 billion. This decline in capital exposure suggests that investors are losing their risk appetite, which is increasing market fear.
In line with risk-off sentiment, the OI-weighted funding rate turns negative to -0.0055% on Monday, indicating increased confidence among bears. Additionally, the $31.88 million in long liquidations outpaced the $2.99 million in short liquidations over the last 24 hours, reflecting strong bearish dominance that wiped out bullish positions.
Solana risks losing crucial support as bearish momentum increases
Solana is poised to form a bearish Marubozu candle on the daily chart, with a 5% drop by press time on Monday. The short-term decline in Solana seen over the last five days has erased the previous week’s gains, retesting the $126 support level marked by the June 22 low.
If SOL marks a decisive close below $126, it could extend the decline to the March 11 low at $112, followed by $95 marked on April 7.
The Relative Strength Index (RSI) is at 33 on the daily chart, extending its hibernation under the midline since early October. If RSI continues to hover around the oversold zone boundary line at 30, Solana could experience further selling pressure.
Although the RSI warns of a downward trend, the Moving Average Convergence Divergence (MACD) remains above its signal line, suggesting a slight bullish bias. However, if MACD crosses below the red line, it would confirm refreshed bearish momentum, triggering a sell signal.
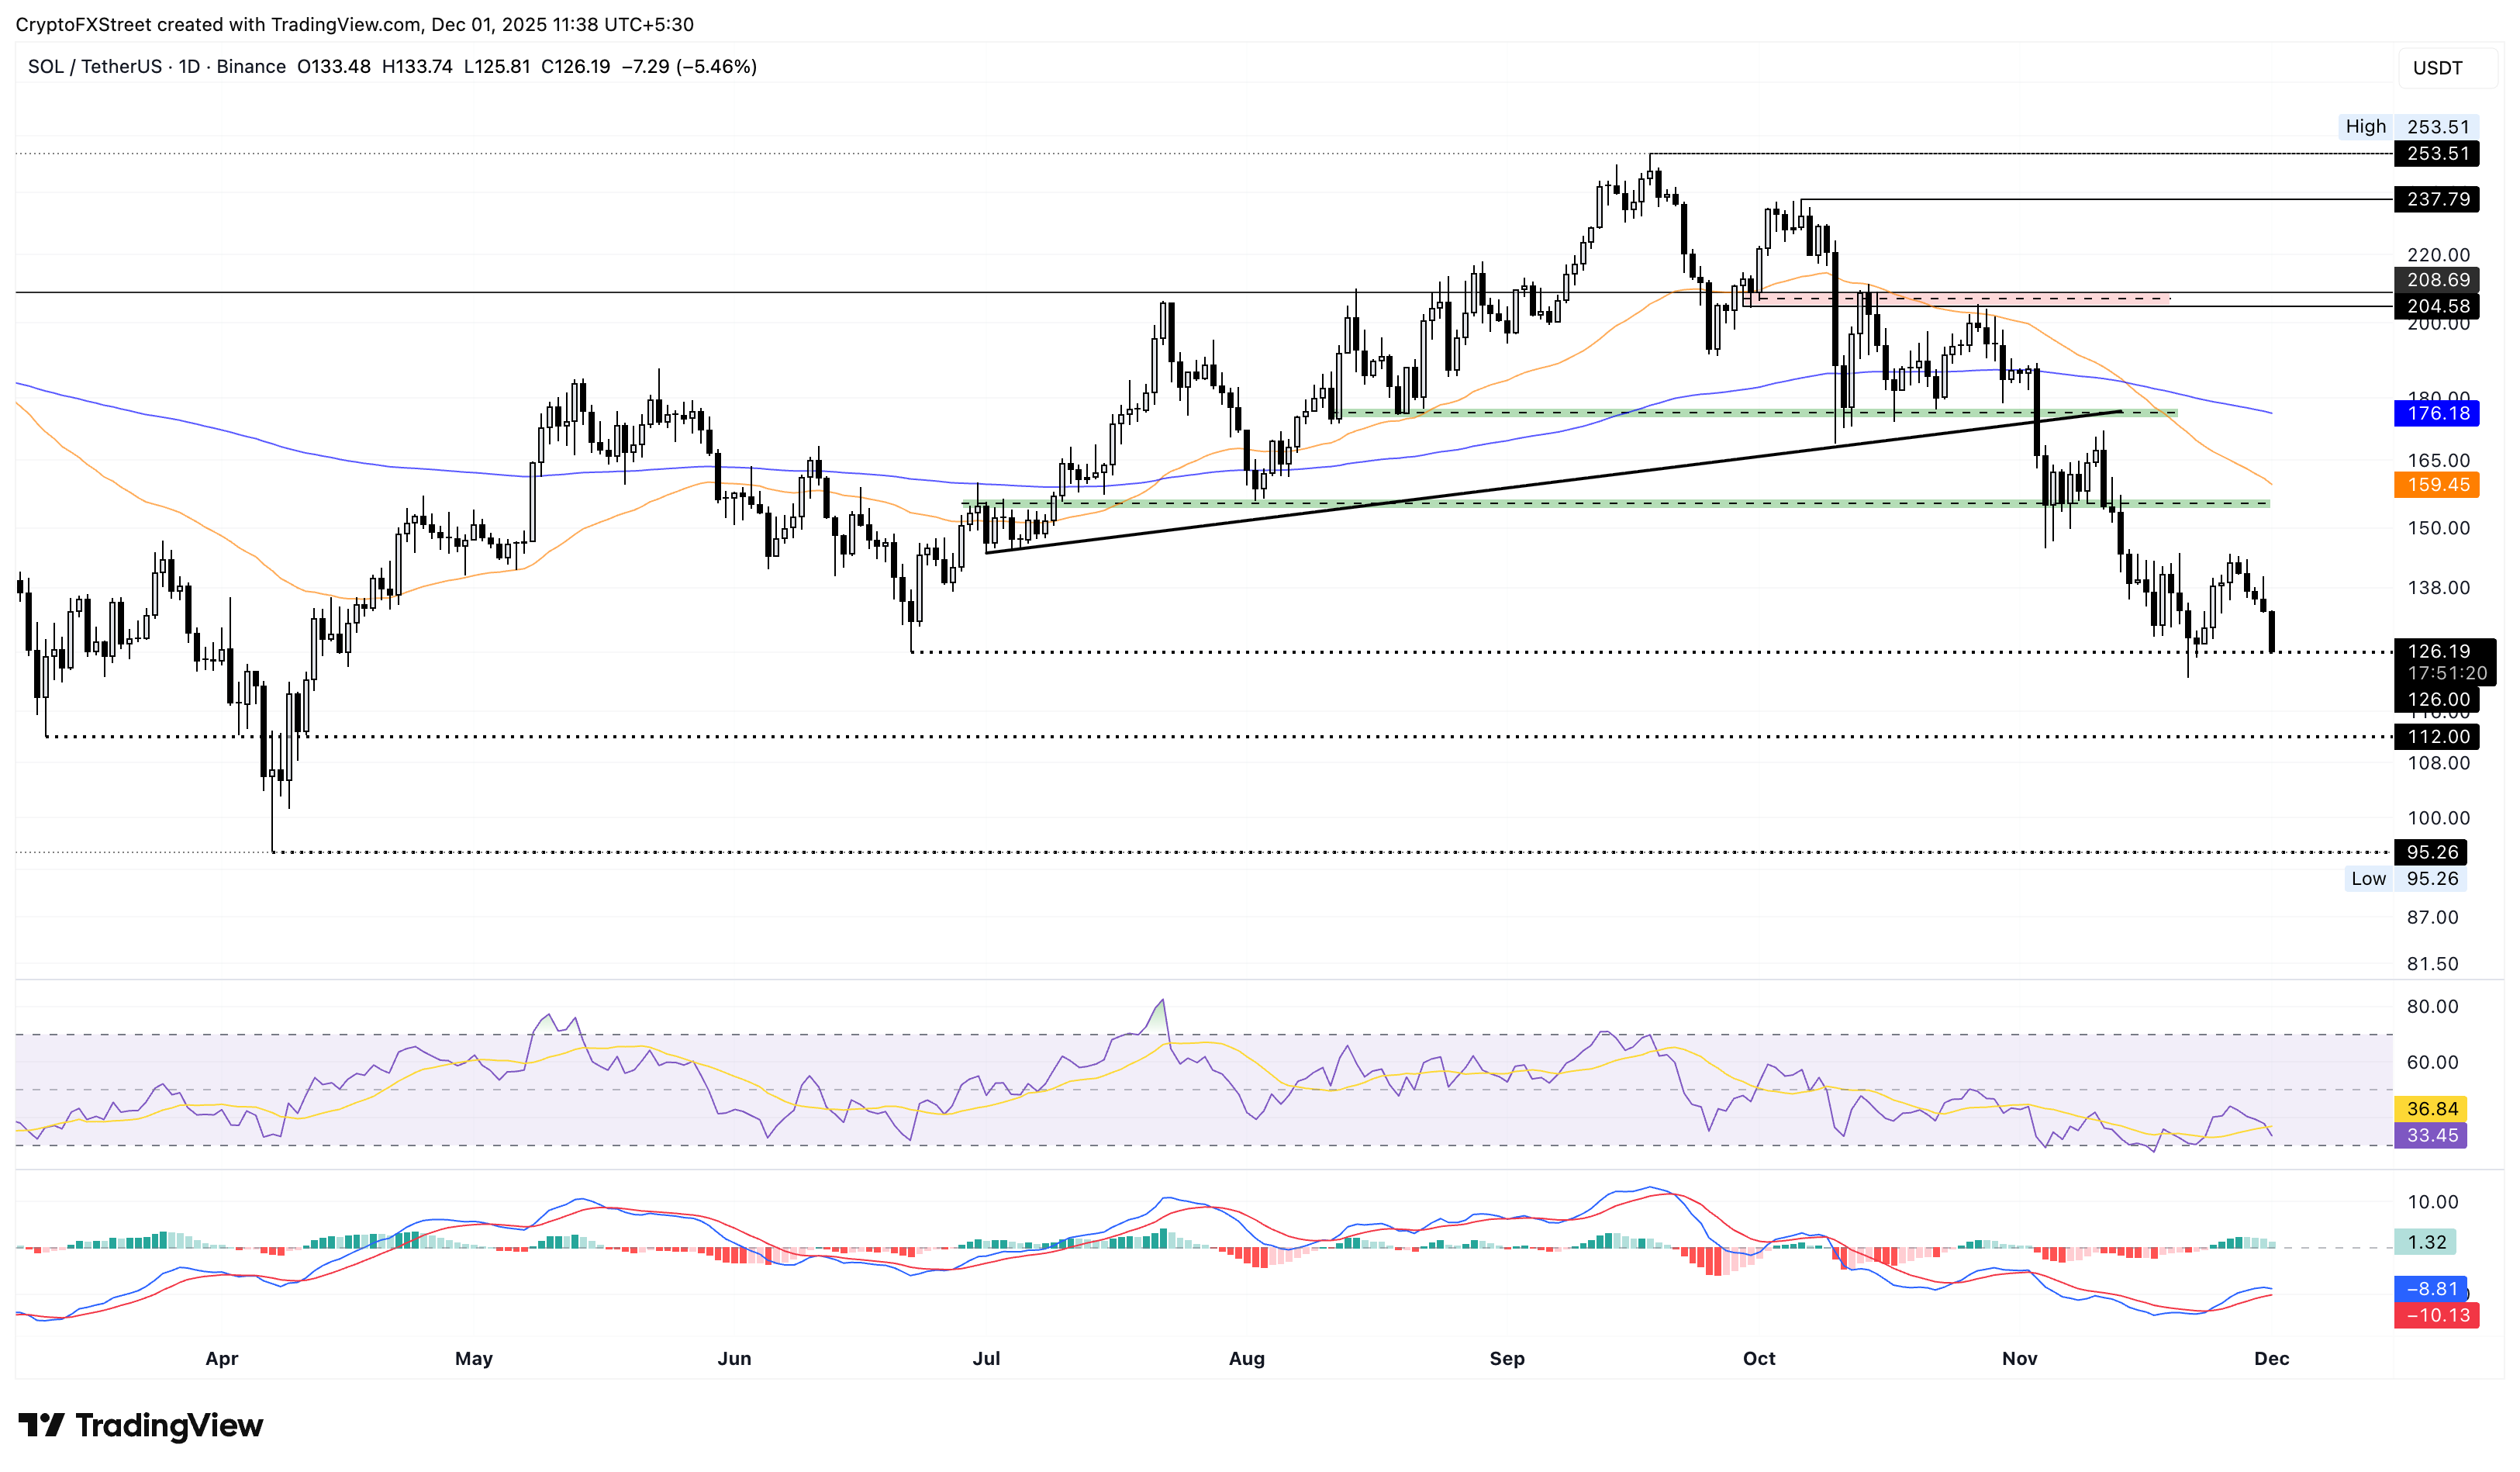
Looking up, a potential rebound in SOL from $126 could target the $150 psychological level.
Author

Vishal Dixit
FXStreet
Vishal Dixit holds a B.Sc. in Chemistry from Wilson College but found his true calling in the world of crypto.



