Solana Price Forecast: SOL climbs above $137 as spot ETF demand accelerates
- Solana trades above $137 on Tuesday after rallying more than 7% in the previous week.
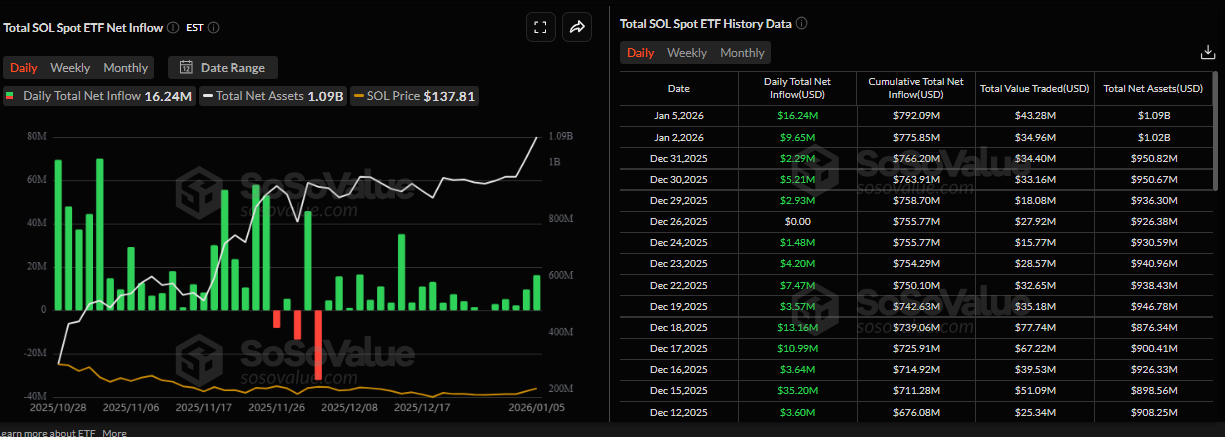
- US-listed spot ETFs recorded $16.24 million in inflows on Monday, marking the largest single-day inflow since mid-December.
- On-chain indicators suggest further upside potential, as stablecoin market capitalization rises, alongside increased whale activity and buy-side dominance.

Solana (SOL) price extends gains above $137 at the time of writing on Tuesday, up more than 7% in the previous week. Institutional demand for SOL continues to strengthen, as spot exchange-traded funds (ETFs) recorded positive flows of more than $16 million on Monday, marking the largest single-day inflow since mid-December. Meanwhile, supportive on-chain metrics indicate a bullish outlook, hinting at further gains for SOL.
Institutional demand continues to strengthen
Institutional demand for Solana has continued to grow since its launch on October 28. SoSoValue data shows that spot Solana ETFs recorded $16.24 million in inflows on Monday, the highest single-day inflow since mid-December. Moreover, the total net assets surpassed $1 billion so far this week, suggesting rising institutional demand. If inflows continue and intensify, SOL could see a price rally.
Solana’s on-chain data shows bullish bias
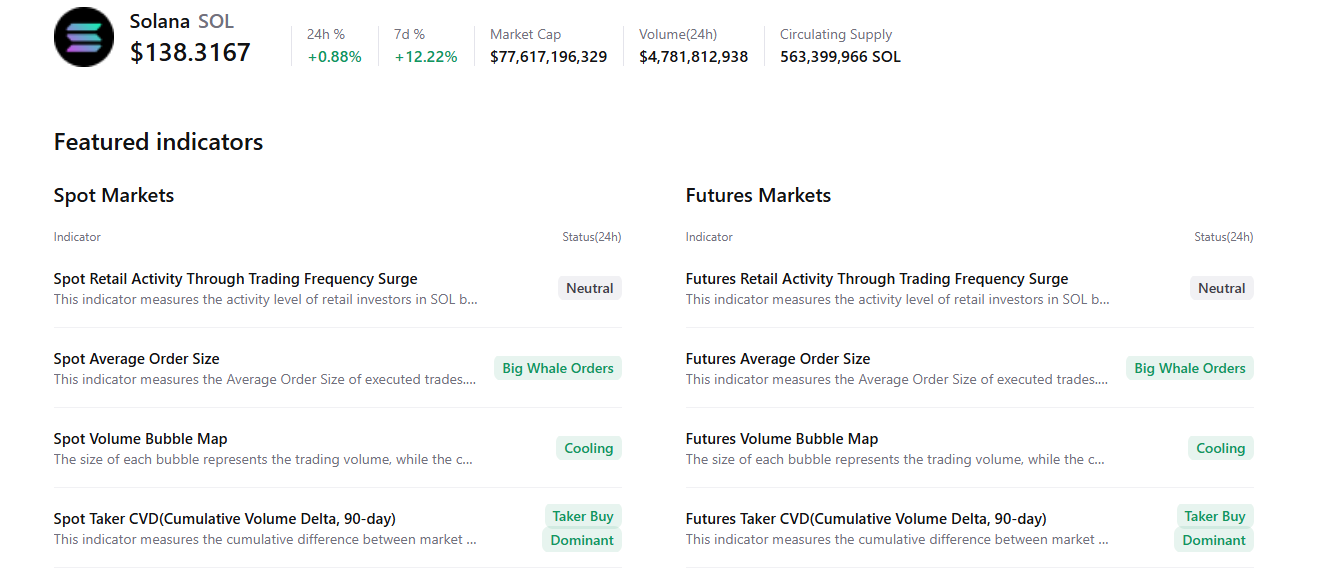
CryptoQuant’s summary data points to a bullish outlook, as Solana’s spot and futures markets show large whale orders, cooling conditions and buy-side dominance. All these factors signal improving sentiment among traders, hinting at a potential continuation of the bullish move in the upcoming days.
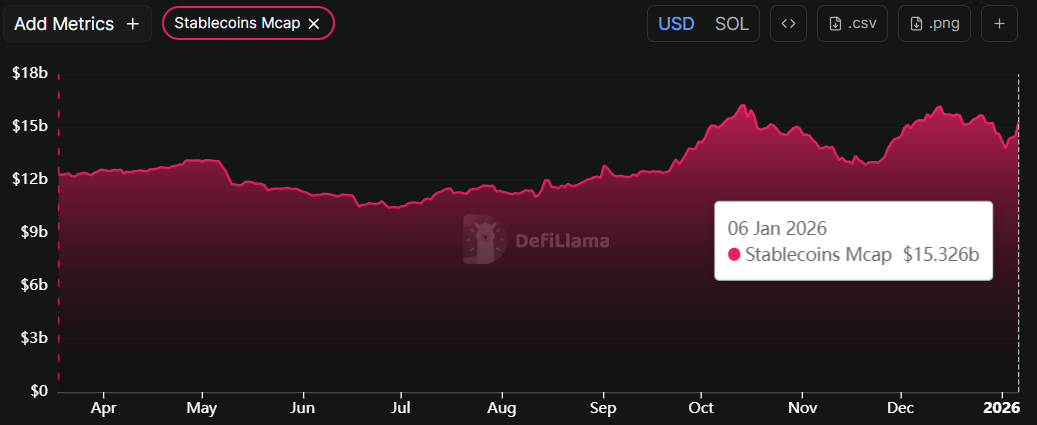
DefiLlama data shows that SOL’s stablecoin total supply has been recovering since early January and currently stands at $15.32 billion. Such stablecoin activity and value increase on the SOL project indicate a bullish outlook, as they boost network usage and can attract more users to the ecosystem.
Solana Price Forecast: SOL bulls aiming for the $150 mark
Solana price broke above the upper trendline of a falling wedge pattern (drawn by connecting multiple highs and lows since early October) on December 26. It rose over 12% through Monday, closing above the 50-day Exponential Moving Average (EMA) at $163.45. As of Tuesday, SOL is trading above $137.
If SOL continues its upward trend, it could extend the rally toward the next resistance level at $150.61, its 100-day EMA.
The Relative Strength Index (RSI) on the daily chart reads 63, above the neutral level of 50, indicating bullish momentum gaining traction. In addition, the Moving Average Convergence Divergence (MACD) indicator shows a bullish crossover and rising green histogram bars above the neutral level, further supporting the bullish outlook.
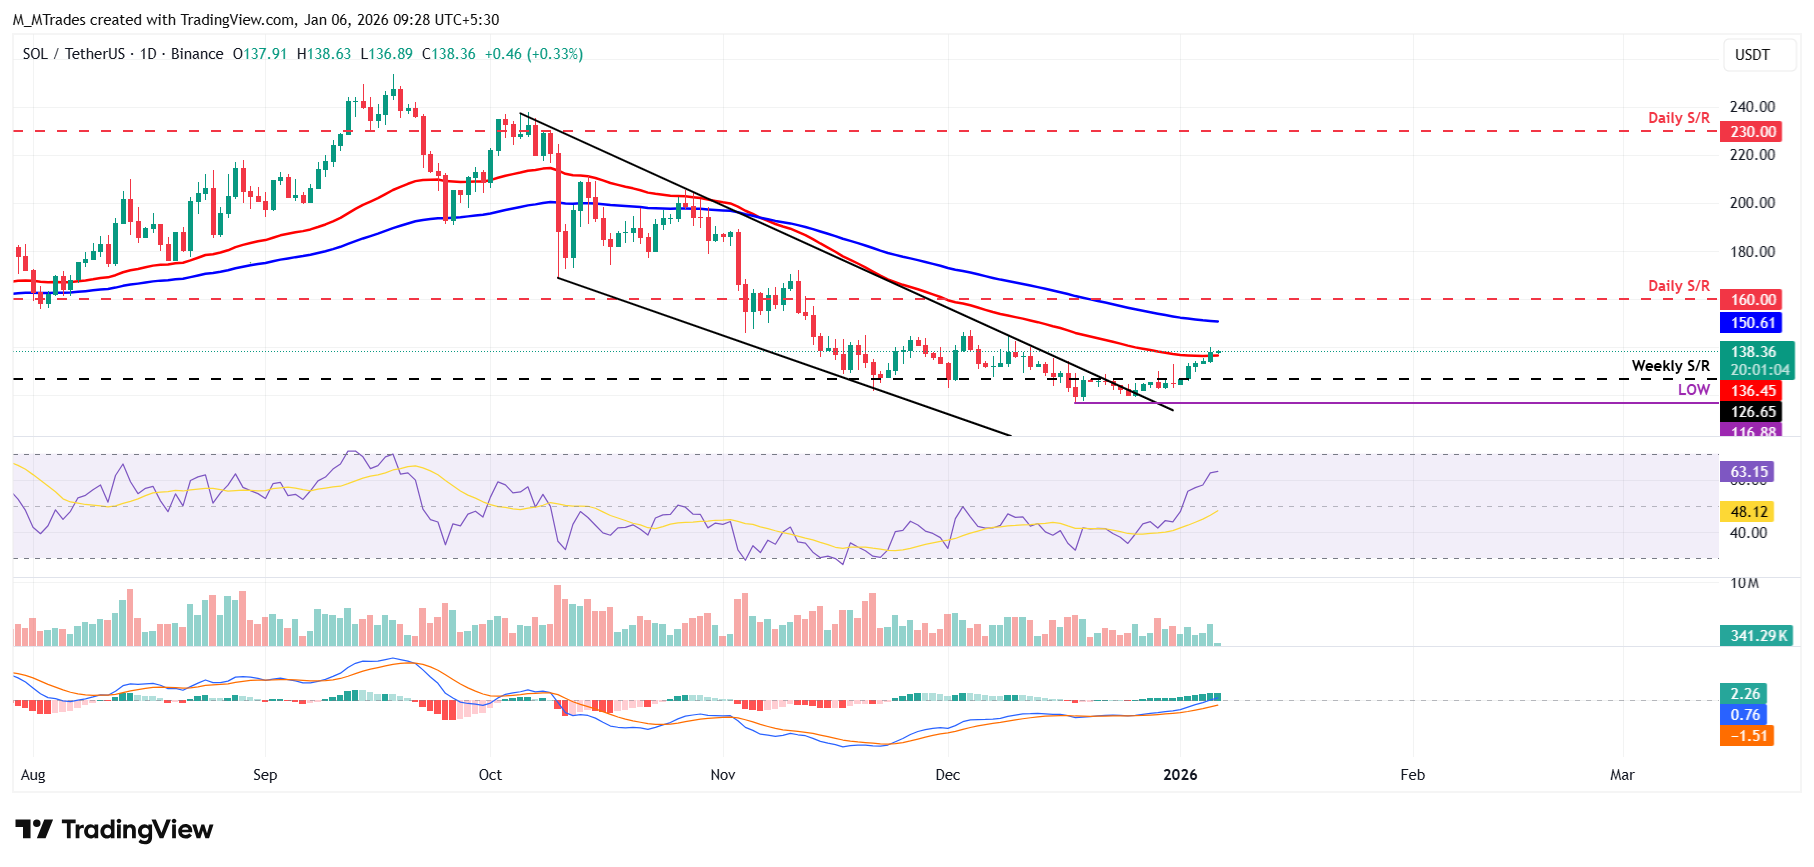
On the other hand, if SOL corrects, it could extend the decline to find support around the weekly level at $126.65.
Author

Manish Chhetri
FXStreet
Manish Chhetri is a crypto specialist with over four years of experience in the cryptocurrency industry.


