Solana price aims for $9 as bears make their presence known
- Solana price fell by 8% from the previous week.
- SOL has yet to retest three significant moving averages during this year's downtrend.
- A breach above last week's trading range is needed to consider a retracement into the breached moving indicators.

Solana price is undergoing a persistent bearish stronghold. Last week's 8% downswing brought the yearly decline to 93%. Now it appears the bears are aiming for new yearly lows.
Solana price in a strong downtrend
Solana price finally resolved the confusion about SOL's congestive price action witnessed throughout the fall. On December 15, the centralized smart-contract token pierced the south side of the $12-$14 trading range and produced a 10% loss of market value. Solana's price has since struggled to retaliate and gain re-entrance to its' lost levels of support.
The SOL price currently auctions at $12.09. Since the start of the year, SOL has progressively lost interest from bulls hanging out at nearly all expected target zones. At the time of writing, the 50-day, 100-day, and 200-day simple moving averages each hover above SOL's current price. Classical technical analysis would suggest that the Solana price is in a true downtrend, and trying to catch a knife could lead to a lethal loss of capital.
SOL's daily trading price lies 40% beneath the closest simple moving average (the 50-day SMA). The bull's failure to retrace into the aforementioned moving average, following a month-long bout of consolidation, is telling of the bears' underlying strength on the market.
On February 15, during the 2021 bullrun, SOL witnessed a 20% market decline after piercing the $9 barrier. Because SOL hovers just above the newly established yearly lows at $10.94, considering historical key levels is a justified idea for bear market target zones. A breach of the $9 liquidity level would result in a 25% decline from the Solana's market value.
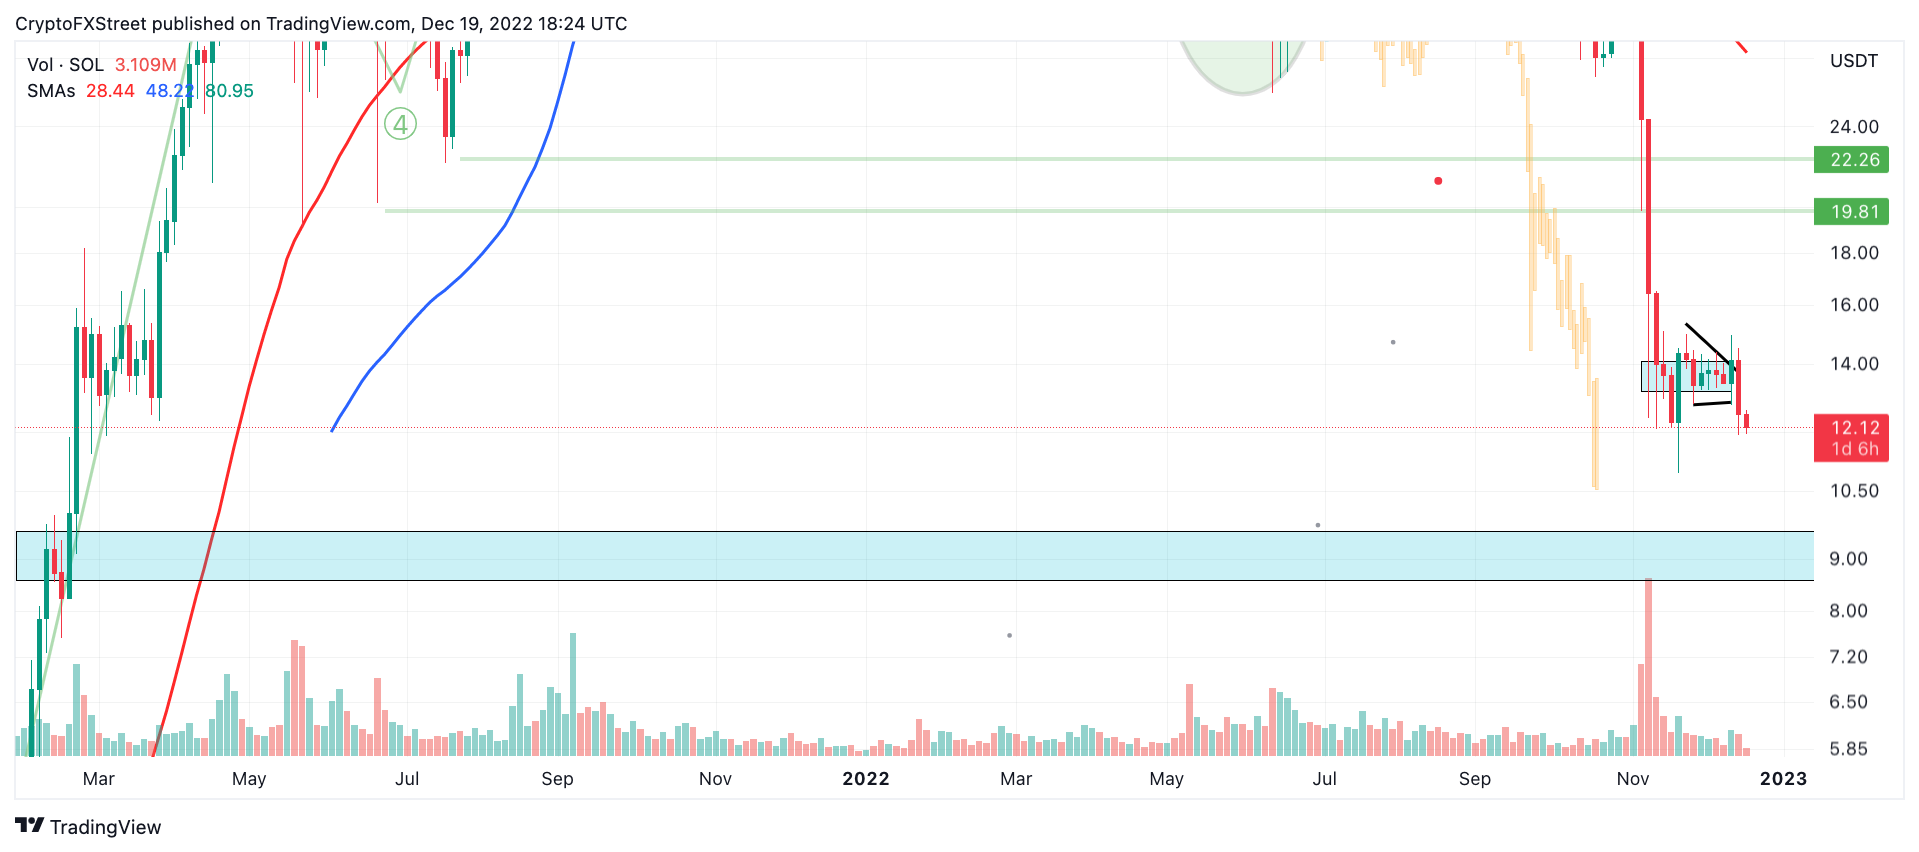
SOL/USST 3-Day Chart
Based on the previous bearish outlook, A break above the previous week's swing high is needed to consider aiming for higher bullish targets. A hurdle above the level would invalidate the bearish bias creating the possibility for a spike into the 50-day SMA at $17 for a 40% gain.
Author

Tony M.
FXStreet Contributor
Tony Montpeirous began investing in cryptocurrencies in 2017. His trading style incorporates Elliot Wave, Auction Market Theory, Fibonacci and price action as the cornerstone of his technical analysis.


