Solana and Sui surge, igniting interest in DeFi as TVL rebounds
- Solana price rises above $150, supported by an increase in the network's DeFi TVL to $7.84 billion.
- SUI's price approaches $3.00 as its DeFi ecosystem TVL surges over 20% in 24 hours, reaching $1.52 billion.
- SOL and SUI derivatives open interest explodes, signaling trader confidence amid growing risk-on sentiment.

Altcoins like Solana (SOL) and Sui gain strength on Wednesday, buoyed by several factors, including a significant recovery in the networks' Total Value Locked (TVL) in Decentralized Finance (DeFi). Moreover, open interest in the derivatives market and rising trading volume signal trader confidence in the short term.
According to Coinglass, SOL's Open Interest (OI) has increased by 13.98%, reaching $5.76 billion over the last 24 hours. Short position holders experienced a significant jump in liquidations, up to $20.24 million, compared to $2 million in long positions.
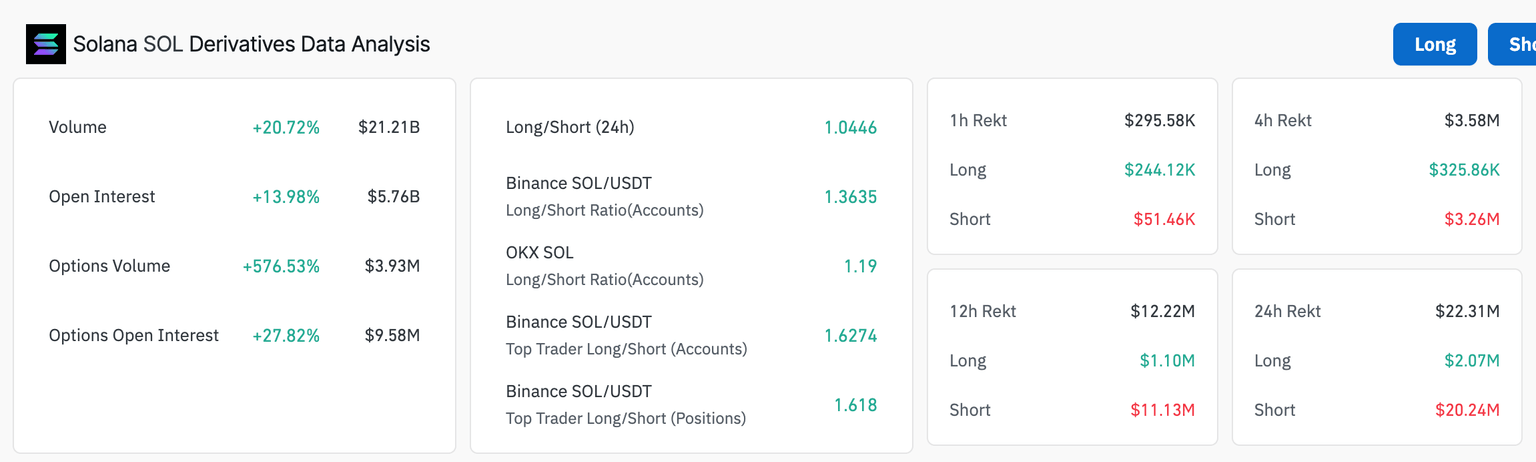
Solana derivatives data | Source: Coinglass
A similar trend occurred, with Sui's OI surging 37.57% to $1.04 billion in the last 24 hours. The uptick in price liquidated $12.27 million in short positions compared to $1.91 million in long positions.
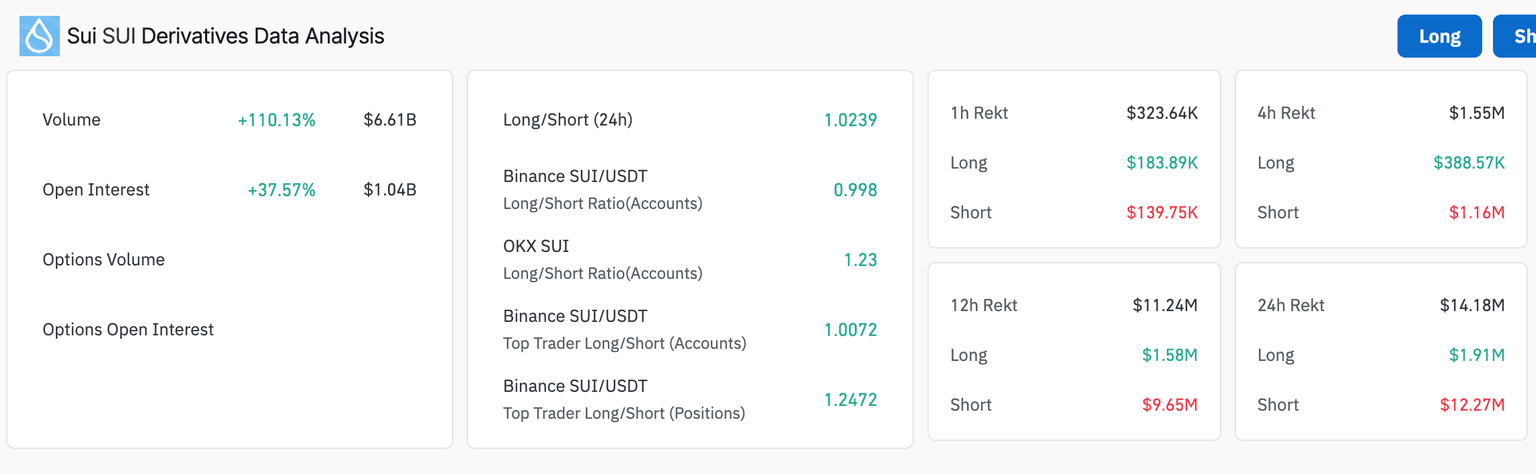
Sui derivatives data | Source: Coinglass
Solana and Sui TVL in DeFi break downtrends
The rebound in altcoins supporting DeFi ecosystems has led to a significant increase in the Total Value Locked, suggesting increased user trust, engagement, and liquidity, and signaling more users are locking their assets into the platform.
According to DefiLlama, Solana TVL plummeted to approximately $6.9 billion in April after peaking at $11.99 billion in February. As Solana's price recovered amid a growing risk-on sentiment in the broader cryptocurrency market following the suspension of reciprocal tariffs for 90 days in the United States (US), the TVL increased. Confidence in Solana's future and stability in the crypto market triggered a 7.6% increase in the TVL to $7.84 billion.
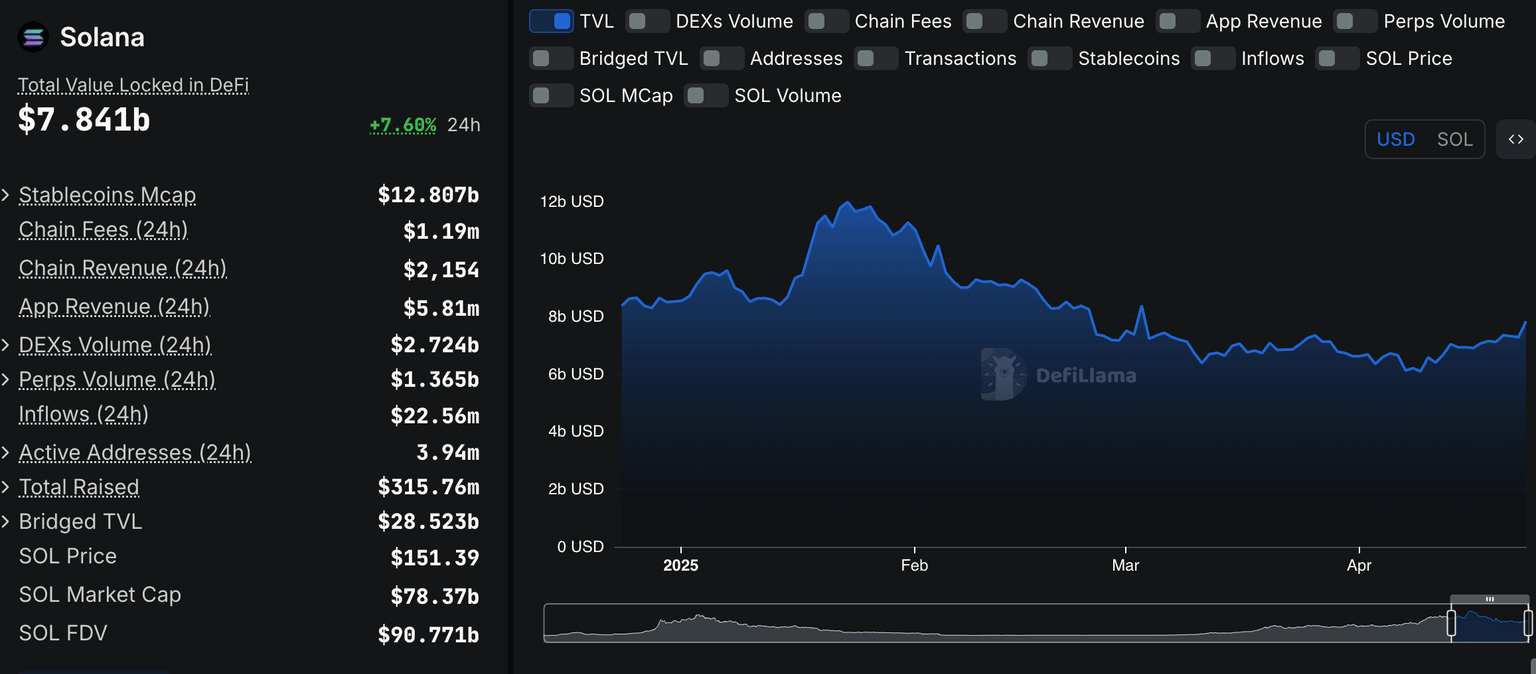
Solana DeFi TVL: Source | DefiLlama
On the other hand, Sui, the protocol powering the token SUI, recorded a significant increase in TVL in DeFi, growing by over 20% to reach $1.52 billion in the last 24 hours. This increase emphasizes the growing interest in the ecosystem and confidence in SUI's performance. Investors often lock their holdings in smart contracts to earn rewards and boost their portfolios when the market is stable and showing signs of growth.
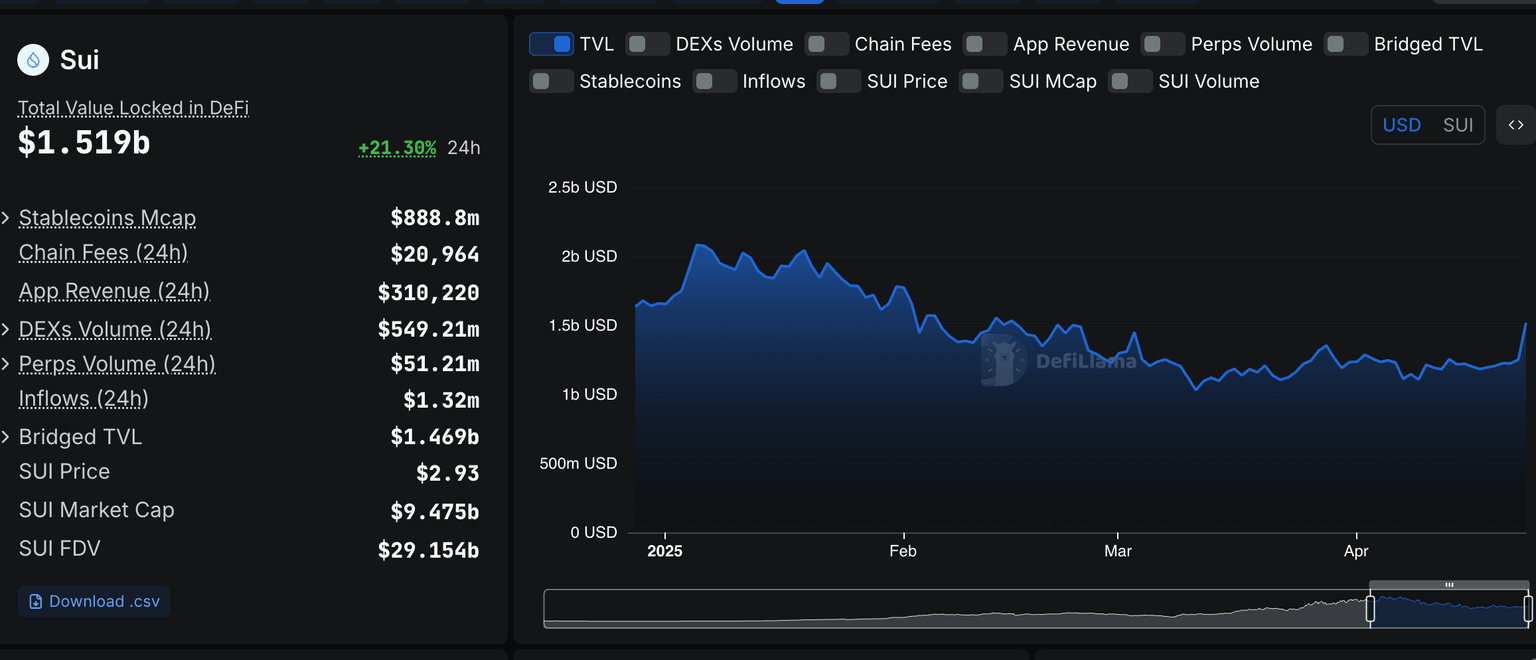
Sui DeFi TVL: Source | DefiLlama
Solana price rises sharply above $150
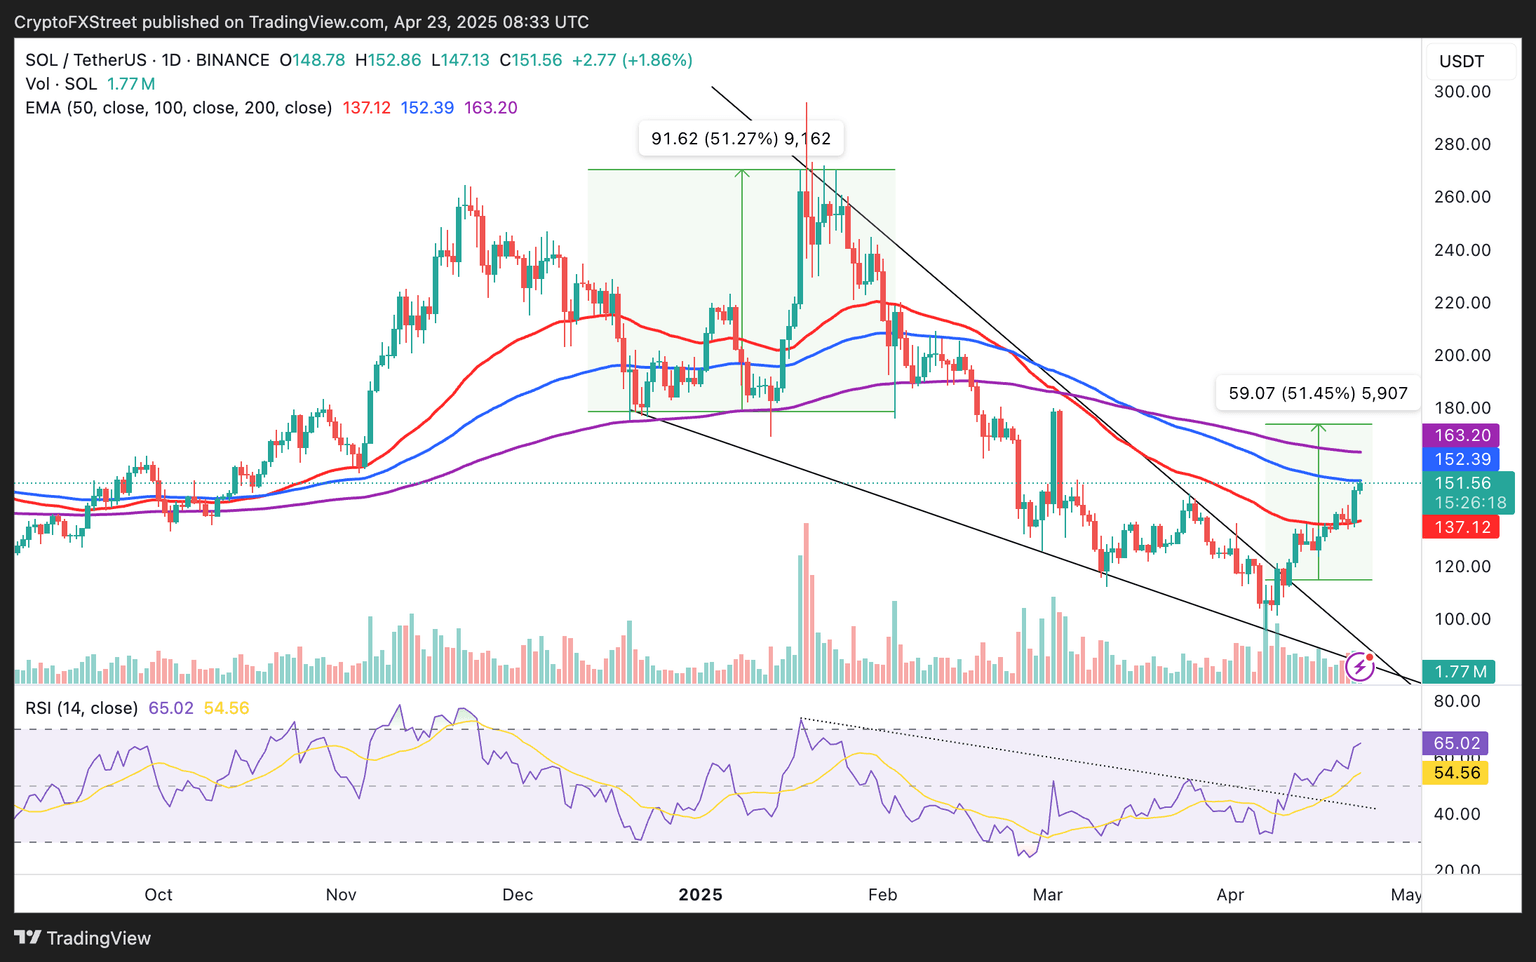
Solana's price continues to extend its recovery following the breakout from a falling wedge pattern on April 11. The smart contracts token surged, stepping above the 50-day Exponential Moving Average (EMA), before reclaiming the $150 psychological level on Wednesday.
Solana seeks support above the 100-day EMA at $152.39 before expanding the bullish scope toward the 200-day EMA at $163.20. The Relative Strength Index (RSI) indicator remains at 65.06, inching closer to the overbought region, which signals strong bullish momentum. However, traders may want to prepare for all outcomes, including profit-taking, which could trigger a pullback and risks from the broader macroeconomic environment.
SOL/USDT daily chart
Sui price approaches $3
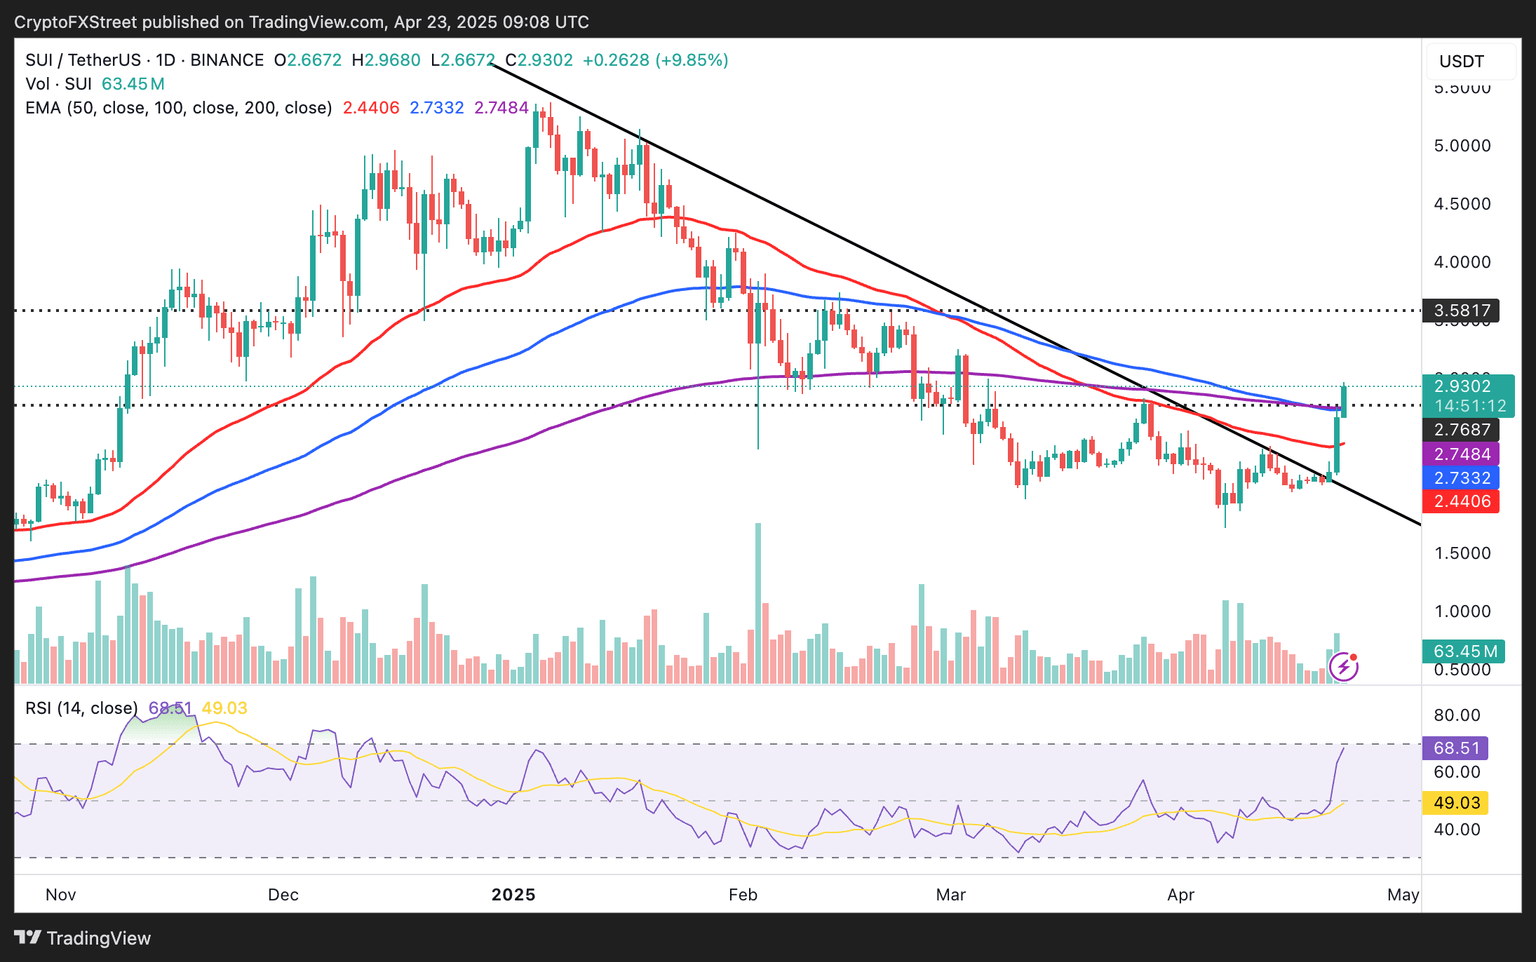
Sui's price surges over 9% on the day, exchanging hands at $2.93 at the time of writing. The layer-1 token broke above a 4-month descending trendline highlighted on the daily chart below, reversing the trend and paving the way for another rally, with the token now eyeing its all-time high of $5.35, achieved in January.
If SUI holds above confluence support formed by the 100 and 200-day EMAs at approximately $2.74, traders could hold their positions, anticipating the next breakout past $3.00.
SUI/USDT daily chart
As the RSI indicator closes in on the overbought region, SUI gains strength to sustain the uptrend. Still, the proximity of the overbought region introduces fresh risks, which could reverse the trend, heightened by possible profit-taking. Beyond the confluence support at $2.74, Sui could extend the bearish leg to the 50-day EMA at $2.44.
Cryptocurrency metrics FAQs
The developer or creator of each cryptocurrency decides on the total number of tokens that can be minted or issued. Only a certain number of these assets can be minted by mining, staking or other mechanisms. This is defined by the algorithm of the underlying blockchain technology. On the other hand, circulating supply can also be decreased via actions such as burning tokens, or mistakenly sending assets to addresses of other incompatible blockchains.
Market capitalization is the result of multiplying the circulating supply of a certain asset by the asset’s current market value.
Trading volume refers to the total number of tokens for a specific asset that has been transacted or exchanged between buyers and sellers within set trading hours, for example, 24 hours. It is used to gauge market sentiment, this metric combines all volumes on centralized exchanges and decentralized exchanges. Increasing trading volume often denotes the demand for a certain asset as more people are buying and selling the cryptocurrency.
Funding rates are a concept designed to encourage traders to take positions and ensure perpetual contract prices match spot markets. It defines a mechanism by exchanges to ensure that future prices and index prices periodic payments regularly converge. When the funding rate is positive, the price of the perpetual contract is higher than the mark price. This means traders who are bullish and have opened long positions pay traders who are in short positions. On the other hand, a negative funding rate means perpetual prices are below the mark price, and hence traders with short positions pay traders who have opened long positions.
Author

John Isige
FXStreet
John Isige is a seasoned cryptocurrency journalist and markets analyst committed to delivering high-quality, actionable insights tailored to traders, investors, and crypto enthusiasts. He enjoys deep dives into emerging Web3 tren


